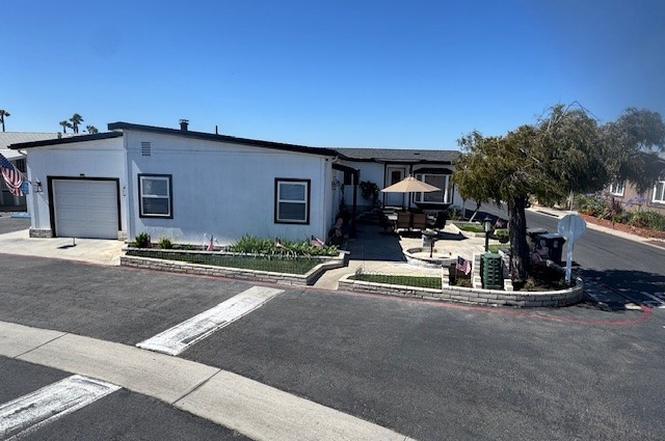
21851 Newland St #232 · Huntington Beach, CA
Flood risk 10/10 · Severe
- FEMA flood zone
- X
- Chance of flooding over 30 yrs
- 0.99%
- Est. flood insurance / yr
- $507 – $1,088
Fire risk 1/10 · Minimal
- Est. fire insurance / yr
- $659 – $1,223
Heat risk 5/10 · Moderate
- Hot days now (above 82°F)
- 7 days/yr
- Hot days in 30 yrs
- 23 days/yr
Wind risk 1/10 · Minimal
- Chance of severe wind over 30 yrs
- —
Air-quality risk 4/10 · Minor
- Unhealthy air days now
- 5 days/yr
- Unhealthy air days in 30 yrs
- 5 days/yr
Risk factors via First Street. Map © Google.
Why this score? — see what drove the B grade
The composite is a weighted blend of 9 inputs, each scored 0–100. Each bar is that input's sub-score; the figure is the points it added to the 100-point composite (weight × sub-score).
- Cash flow +30.0/30.0
- 1% rule +10.0/10.0
- DSCR +10.0/10.0
- ARV discount +7.5/15.0
- Schools +6.5/10.0
- Livability +3.4/5.0
- Rent growth +2.8/5.0
- Condition / age +2.5/5.0
- Appreciation +0.0/10.0
$269,900
🖨 Deal sheet 📄 Offer letter ✓ Due diligence
Listing remarks
Remodeled Beach Home – Huntington by the Sea . Just Steps from the Ocean | Oversized Corner Lot | Gated Community. This beautifully remodeled beach home sits on an Extra-Large Corner Lot and offers a spacious, open floor plan with 1,944 Sq. Ft. That's only $138.84 Sq. Ft. for this very unique gated beach property. Other properties in here are up to $236 SqFt with a much smaller lot and no garage. Key Features: * 3 Bedrooms + Office/4th Bedroom ' 2 Bathrooms. (MBed-11.5x15, Bed2-10.2x11.2, Bed3-9x18, Bed4/Office-11.3x8.9). * Huge permitted 600 Sq. Ft. (20'x30') family room w/ fireplace, plumbed for a wet bar. * Separate dining room perfect for entertaining. * Bright and airy inte
Key facts
- Separate dining room
- New central heating
- Re-piped plumbing
Tags
Property features AI
Finance
- Other: Located in Huntington By The Sea park; Directions reference: Newland & PCH
- HOA & community: Community features: street lighting, sidewalks; Land lease: $3,900.65 monthly
Exterior
- Parking: Attached carport with 3 spaces
- Utilities: Public sewer; District/public water
- Home design: Single-story; Entry on main level; Mobile home (double body, 24' x 56'); View and located across the road from a lake/ocean
- Construction: Mobile home remains; Year built source: seller
- Exterior features: Awning; Rooftop patio; Community pool
Interior
- Kitchen: Gas cooktop; Gas range; Gas oven; Garbage disposal; Gas water heater
- Flooring: Laminated flooring
- Bathrooms: 2 full bathrooms
- Heating & cooling: Central furnace
- Interior features: Ceiling fan; Open floor plan; Storage space; Association/community spa
- Laundry & utility: Laundry inside
Neighborhood map
What this means for you Summary
Snapshot
- This is a 3-bed/2.0-bath manufactured listed at $270k.
Deal economics
- At list price, monthly cash flow is $2k ($25k/yr) — positive.
- The deal already cash-flows at list — no discount required.
- Meets the 1% rule at list price ($5k rent vs $270k).
- Recommended offer: $238k (12.0% below list) — sets the bar for market timing.
- Cap rate 15.9% vs local median 1.6% in Huntington Beach — top-decile yield for the area; either an underpriced asset or a hidden risk that comps aren't pricing in. Stress-test before assuming the spread holds.
Location & tenants
- Location reads 67/100 on livability (#306 in CA) — a middle-class / working-renter tenant base. Strengths: employment A+, commute A-, schools B+; Watch: amenities C-, cost of living F, health & safety F.
- Huntington Beach Union High (suburban): math 65% / reading 82% proficiency, ranked #39 of 517 in CA (top 8%) — strong family-tenant draw, lease renewals of 3-5y typical.
- Market conditions: Rents rising (+1.2%/yr); 116 active listings in the ZIP; 31 comparable units currently listed for rent nearby; rentals leasing fast (median 1d on market — plan ~1-2 weeks tenant-placement turnaround); high-income renter base; 6,974 units permitted in Orange County in 2024 (3,839 in 5+ unit buildings).
- At $5,105/mo this rent would consume 47% of the median local household income ($131k/yr) (locally 1226% of renters already pay >50% of income on rent) — very limited rent-growth headroom before tenants either downsize or default.
Forward outlook
- Local home prices are declining (-3.0%/yr); year-one equity from $2k of loan paydown is wiped out by about $8k of value loss. Plan a longer hold.
- Orange County population projected at +14% by 2050 — modest demand growth; plan on rents tracking national, not racing it.
- At projected returns (-3.0% appreciation + 1.2% rent growth), your $76k cash investment doubles in ~4 years — after that, you're playing with house money.
Negotiation context
- It's been on market 283 days — a 12% lower offer ($238k) is reasonable based on typical stale-listing flexibility.
- 5 sale attempts since 26y ago; this cycle's ask has dropped $80k (23%) from the opening price — seller is motivated, your offer sets the floor, not the list.
Risks & watch-outs
- Watch-outs: flood insurance adds $66/mo.
- Climate carrying-cost: severe flood risk; extreme-heat days projected 7→23/yr by 2055 (HVAC capex compounding) — expect insurance premiums to compound above CPI over the hold.
Questions for the listing agent
- It's been on market 283 days. Have you received any prior offers? Is the seller open to a 12% concession, seller financing, or rate buy-down credit?
- Built in 1977 — when were the roof, HVAC, electrical panel, plumbing, and water heater last replaced?
- What's the actual annual flood-insurance premium (NFIP or private), and is the property in a SFHA with mandatory coverage?
- Why hasn't it sold? Are there any deal-killer items the seller is aware of (foundation, flood, title, zoning, code violations)?
- Is there a deadline driving the sale (1031 exchange, divorce, estate, relocation)? That informs how much negotiation room exists.
- Schools are B-rated — typically a magnet for longer-tenancy family renters. What's the average tenant stay here, and is there a school-zone premium baked into asking?
- What's the average days-on-market for RENTAL listings here right now (not sales)? A rising rental-DOM trend means longer vacancies and softer asking-rent achievability than the comps imply.
- What's the recent tenant-quality profile in this submarket — average credit score on applications, eviction rate, late-payment / NSF rate, and stable-employment percentage? A property-management company in the area should have these aggregated.
- How much new for-sale + rental construction is in the pipeline within 1–3 miles? Heavy new supply typically softens prices + rents 12–24 months out; constrained supply supports both.
Investment metrics
- 1% rule
- 1.89% ✓
- Cap rate
- 15.93%
- Cash-on-cash
- 34.42%
- DSCR
- 2.53
- GRM
- 4.4
CMA / ARV
No comps found within radius.
Projected returns pro-forma
-3.0% appreciation · 1.2% rent growth · sell at horizon
- IRR
- 26.5%
- Equity multiple
- 2.07×
- Total profit
- $81,107
- Equity at exit
- $40,243
- IRR
- 33.0%
- Equity multiple
- 3.75×
- Total profit
- $207,458
- Equity at exit
- $23,336
Cash invested: $75,572 (down + closing). Projections, not guarantees.
Landlord ↔ Tenant lean methodology
- Overall (STATE)
- 18 Strongly Tenant-Friendly
- State California
- 18 Strongly Tenant-Friendly · D+13
- County
- — inherits STATE
- City
- — inherits STATE
ZIP-level market 92646
- Rents YoY
- 1.2%
- Active inventory
- 116
- Price-to-rent
- 4.4×
Monthly cashflow live
- Estimated rent
- $5,105 high interval (Pro) →
- Mortgage (P&I)
- −$1,415
- Tax est. 1.5%
- −$337 /mo · $4,048/yr
- Insurance
- −$112
- Flood insurance flood zone
- −$66 /mo · $798/yr
- HOA
- −$0
- Vacancy / Maint / Mgmt
- −$1,072
- Net cashflow
- $2,101
Break-even live
UW: 25.0% down · 7.5% · 30yr · 1.5% tax · 5.0% vac · 8.0% maint · 8.0% mgmt
Financing live
Cash to close
- Down payment
- $67,475
- Closing costs
- $8,097
- Reserves months
- —
- Total cash needed
- —
Loan-product check · same deal, 3 products live
Conventional
25% down · 7.5% · 30yr
- Down + closing
- —
- Monthly P&I
- —
- Monthly cashflow
- —
- DSCR
- —
- Eligible?
- —
Personal DTI + credit; lowest rate.
DSCR
20% down · 8.5% · 30yr
- Down + closing
- —
- Monthly P&I
- —
- Monthly cashflow
- —
- DSCR
- —
- Eligible?
- —
No personal income docs; deal must DSCR.
Hard money
10% down · 12.0% · 12mo
- Down + closing
- —
- Monthly P&I
- —
- Monthly cashflow
- —
- DSCR
- —
- Eligible?
- —
Short-term bridge; refi at stabilization.
Rent comps 31 comps
| Address | Beds | Baths | Sqft | Rent | $/sqft | DOM | Units | Dist |
|---|---|---|---|---|---|---|---|---|
| 21851 Newland St #104 Huntington Beach, CA | 3.0 | 2.0 | 1248 | $4,000 | $3.21 | 17d | 1 | 0.02mi |
| 8216 Foxhall Dr Huntington Beach, CA | 4.0 | 2.5 | 1482 | $5,195 | $3.51 | 2d | 1 | 0.42mi |
| 8121 Foxhall Dr Huntington Beach, CA | 3.0 | 1.5 | 1296 | $4,950 | $3.82 | 1d | 1 | 0.47mi |
| 7972 Aldea Cir Unit 1 Huntington Beach, CA | 2.0 | 2.5 | 1900 | $5,750 | $3.03 | 22d | 1 | 0.61mi |
| 9022 Niguel Cir Huntington Beach, CA | 4.0 | 2.0 | 2248 | $7,000 | $3.11 | 11d | 1 | 0.67mi |
| 7961 Southwind Cir Huntington Beach, CA | 3.0 | 2.5 | 1664 | $6,195 | $3.72 | 1d | 1 | 0.73mi |
| 7866 Southwind Cir Huntington Beach, CA | 3.0 | 2.0 | 1787 | $5,000 | $2.80 | 1d | 1 | 0.77mi |
| 7946 Waterfall Cir Huntington Beach, CA | 2.0 | 2.5 | 1439 | $4,500 | $3.13 | 1d | 1 | 0.80mi |
| 7832 Seaglen Dr Huntington Beach, CA | 3.0 | 2.5 | 1700 | $8,000 | $4.71 | 1d | 1 | 0.81mi |
| 8342 Castilian Dr Huntington Beach, CA | 3.0 | 2.0 | 1885 | $6,000 | $3.18 | 1d | 1 | 0.83mi |
| 20966 Seacoast Cir Huntington Beach, CA | 3.0 | 2.5 | 1685 | $4,300 | $2.55 | 7d | 1 | 0.86mi |
| 7795 Neptune Dr Huntington Beach, CA | 2.0–4.0 | 1.5–2.5 | 1155 | $4,654 | $4.03 | 1d | 3 | 0.88mi |
| 20904 Monarch Ln #27 Huntington Beach, CA | 3.0 | 3.0 | 2409 | $5,000 | $2.08 | 2d | 1 | 0.91mi |
| 20904 Monarch Ln #27 Huntington Beach, CA | 3.0 | 2.5 | 2409 | $5,000 | $2.08 | 6d | 1 | 0.91mi |
| 80 HUNTINGTON St Huntington Beach, OS | 2.0 | 2.0 | 1276 | $3,825 | $3.00 | 1d | 1 | 0.91mi |
| 9192 Christine Dr Huntington Beach, CA | 3.0 | 2.0 | 1453 | $6,700 | $4.61 | 5d | 1 | 0.94mi |
| 9352 Mokihana Dr Huntington Beach, CA | 4.0 | 2.5 | 1860 | $5,300 | $2.85 | 1d | 1 | 1.01mi |
| 21040 Pacific City Cir Huntington Beach, CA | 1.0–3.0 | 1.0–2.5 | 1137 | $8,055 | $7.08 | 1d | 28 | 1.04mi |
| 21892 Starfire Ln Huntington Beach, CA | 4.0 | 3.0 | 2265 | $5,950 | $2.63 | 2d | 1 | 1.07mi |
| 8777 Tulare Dr Unit 413d Huntington Beach, CA | 3.0 | 2.0 | 1287 | $3,900 | $3.03 | 1d | 1 | 1.09mi |
| 200 Pacific Coast Hwy Huntington Beach, CA | 2.0 | 2.0–2.5 | 1299 | $4,575 | $3.52 | 15d | 2 | 1.26mi |
| 200 Pacific Coast Hwy Huntington Beach, CA | 1.0–2.0 | 1.0–2.0 | 1064 | $4,900 | $4.61 | 1d | 2 | 1.26mi |
| 414 Main St #210 Huntington Beach, CA | 2.0 | 2.5 | 1530 | $6,500 | $4.25 | 22d | 1 | 1.32mi |
| 203 Frankfort Ave Huntington Beach, CA | 3.0 | 2.5 | 2053 | $6,950 | $3.39 | 17d | 1 | 1.34mi |
| 340 5th St Huntington Beach, CA | 2.0 | 2.5 | 2060 | $5,900 | $2.86 | 1d | 1 | 1.36mi |
| 9272 Sunridge Dr Huntington Beach, CA | 4.0 | 2.0 | 1684 | $6,000 | $3.56 | 1d | 1 | 1.37mi |
| 735 Alabama St Huntington Beach, CA | 4.0 | 3.5 | 2607 | $7,900 | $3.03 | 1d | 1 | 1.44mi |
| 909 California St Huntington Beach, CA | 3.0 | 3.0 | 2072 | $6,000 | $2.90 | 20d | 1 | 1.44mi |
| 610 Main St Huntington Beach, CA | 3.0 | 2.5 | 2083 | $6,500 | $3.12 | 1d | 1 | 1.46mi |
| 215 6th St Huntington Beach, CA | 3.0 | 2.5 | 2273 | $10,000 | $4.40 | 1d | 1 | 1.48mi |
| 626 Lake St #54 Huntington Beach, CA | 3.0 | 3.0 | 1400 | $3,895 | $2.78 | 24d | 1 | 1.49mi |
Listing history 25 events
-
2026-06-18days on market $269,900 Active 283 DOM
-
2026-06-17days on market $269,900 Active 282 DOM
-
2026-06-16days on market $269,900 Active 281 DOM
-
2026-06-15days on market $269,900 Active 280 DOM
-
2026-06-13days on market $269,900 Active 278 DOM
-
2026-06-13days on market $269,900 Active 277 DOM
-
2026-06-09days on market $269,900 Active 274 DOM
-
2026-06-08days on market $269,900 Active 273 DOM
-
2026-06-07days on market $269,900 Active 272 DOM
-
2026-06-04days on market $269,900 Active 269 DOM
-
2026-06-03days on market $269,900 Active 268 DOM
-
2026-06-02days on market $269,900 Active 267 DOM
-
2026-06-01days on market $269,900 Active 266 DOM
-
2026-05-31days on market $269,900 Active 265 DOM
-
2026-03-27price $269,900
-
2025-09-15price $299,376
-
2025-09-08$349,900 Active
-
2008-08-01historical
-
2008-06-02$169,000
-
2008-06-01historical
-
2008-04-02$189,900
-
2007-09-28historical
-
2007-07-10$220,000
-
2000-10-22historical
-
2000-08-22$149,900
ⓘ Source: listings_history table (triggers on properties + properties_extension) + one-shot
backfill from property_details.listing_events for pre-trigger history.
Climate risk First Street
- Flood 10/10 Extreme FEMA zone X · 99% chance over 30 yrs
- Wildfire 1/10 Low
- Heat 5/10 Major 7 d/yr ≥82°F today · 23 d/yr by 30 yrs out
- Wind 1/10 Low
- Air quality 4/10 Moderate 5 unhealthy d/yr today · 5 by 30 yrs out
Nearby sold comps map
Loading sold comps map…
Walkable amenities ~0.75 mi
Loading nearby amenities…
Taxation est. · year 1
- Rental income
- $61,254
- − Mortgage interest
- −$15,119
- − Property taxes
- −$4,048
- − Insurance
- −$2,147
- − Repairs & maintenance
- −$4,900
- − Management
- −$4,900
- − Depreciation
- −$7,852
- Taxable income
- $22,288
- Est. tax owed @ 24.0%
- −$5,349
- After-tax cash flow
- $19,862/yr
For passive investors: Depreciation is non-cash, so a rental often shows a tax loss while cash-flowing — sheltering income. Rental losses are passive: they offset passive income freely, and up to $25,000/yr can offset ordinary (W-2) income if you actively participate and your MAGI is under $100k (phasing out to $0 by $150k); unused losses carry forward. On sale, claimed depreciation is recaptured at up to 25%, and gains may owe capital-gains tax (a 1031 exchange can defer both). Figures are a year-1 estimate at your 24.0% rate — not tax advice; consult a CPA.
Schools (NCES district)
- District
- Huntington Beach Union High
- NCES district ID
- 0618060
- Math proficiency
- 65% ▲ 17.00%
- Reading proficiency
- 82% ▲ 8.00%
- Median HH income
- $78,159
- Composite
- 64.9/100
- National rank
- #511
- State rank
- #39 of 517 in CA
Livability — Huntington Beach
- Score
- 67/100
- State rank
- #306
- US rank
- #10298
Category grades
Schools grade is shown separately in the Schools card above.
Census & demographics
- Census place
- Huntington Beach, CA
- County
- Orange County · 3,096,323 people
- City population
- 194,835
- Metro
- Los Angeles-Long Beach-Anaheim, CA
- Population (ZIP)
- 54,615
- Household income
- $130,672
- Rent vs Own
- Severe rent burden
- 1226.0
Population outlook (Orange County) Hauer SSP2
- Today (2025)
- 3,477,456 people
- By 2030
- 3,613,117 · +3.9%
- By 2040
- 3,835,945 · +10.3%
- By 2050
- 3,968,736 · +14.1%
- By 2075
- 4,097,053 · +17.8%
- By 2100
- 3,903,633 · +12.3%
Race, ethnicity, and origin ACS 2023
- Neighborhood character
- Diverse neighborhood (Simpson 0.56)
- Race & ethnicity
- White 63% Hispanic / Latino 16% Asian 13% Two or more races 13%
- Hispanic origin (detail)
- Mexican 11%
- Common ancestry
- Italian 3% Romanian 2% Lithuanian 2%
- Foreign-born
- 15% · Vietnam, Canada, China
- Languages at home
- 80% English-only · Spanish 7% Vietnamese 5% Chinese 2%
Political lean MEDSL · Orange
- 2024 margin
- Toss-up / Even · D 49.7% · R 47.1% · Other 3.2%
- 2008→2024 swing
- +5.2pp toward D · 2008: -2.6pp · 2024: 2.6pp
- All cycles
- 2024: D+2.6 2020: D+9.0 2016: D+7.7 2012: R+8.3 2008: R+2.6
Not yet ingested
- Civics
- —
Market trends
- HPI YoY
- ▼ -1082.92%
- Current HPI
- 459.3987
- Rent YoY
- ▲ 1.20%
- Metro
- Los Angeles-Long Beach-Anaheim, CA
- State GDP YoY
- ▲ 3.21%
- F500 in state
- 116
Industry mix (Fortune 500 HQ in CA)
| Industry | F500 HQs | Revenue |
|---|---|---|
| Technology | 27 | $1,492B |
|
||
| Financial Services | 3 | $174B |
|
||
| Retail | 3 | $44B |
|
||
| Insurance | 3 | $26B |
|
||
| Media / Entertainment | 2 | $115B |
|
||
| Pharmaceuticals / Biotech | 2 | $62B |
|
||
Price history
+80.1% since first listed11 events — show timeline
- 2026-03-27 Price Changed $269,900 CRMLS
- 2025-09-15 Price Changed $299,376 CRMLS
- 2025-09-08 Listed $349,900 CRMLS
- 2008-08-01 Listing Removed — CRMLS
- 2008-06-02 Listed $169,000 CRMLS
- 2008-06-01 Listing Removed — CRMLS
- 2008-04-02 Listed $189,900 CRMLS
- 2007-09-28 Listing Removed — CRMLS
- 2007-07-10 Listed $220,000 CRMLS
- 2000-10-22 Listing Removed — CRMLS
- 2000-08-22 Listed $149,900 CRMLS
Property tax history
-4.2%/yrLatest (2025): $331 · -5.0% YoY. Source: county tax records.
Cash-flow waterfall
monthlySold comps — $/sqft
last 12 mo · ≤1 miLoading sold comps…