6384 Charleen Ln · Garfield, MI
Flood risk No data
- FEMA flood zone
- —
- Chance of flooding over 30 yrs
- —
- Est. flood insurance / yr
- —
Fire risk No data
- Est. fire insurance / yr
- —
Heat risk No data
- Hot days now (above threshold)
- —
- Hot days in 30 yrs
- —
Wind risk No data
- Chance of severe wind over 30 yrs
- —
Air-quality risk No data
- Unhealthy air days now
- —
- Unhealthy air days in 30 yrs
- —
Risk factors via First Street. Map © Google.
Why this score? — see what drove the B grade
The composite is a weighted blend of 9 inputs, each scored 0–100. Each bar is that input's sub-score; the figure is the points it added to the 100-point composite (weight × sub-score).
- Cash flow +30.0/30.0
- ARV discount +15.0/15.0
- 1% rule +10.0/10.0
- DSCR +10.0/10.0
- Rent growth +2.5/5.0
- Livability +2.5/5.0
- Condition / age +2.5/5.0
- Schools +2.4/10.0
- Appreciation +0.0/10.0
$47,500
🖨 Deal sheet 📄 Offer letter ✓ Due diligence
Listing remarks MLS
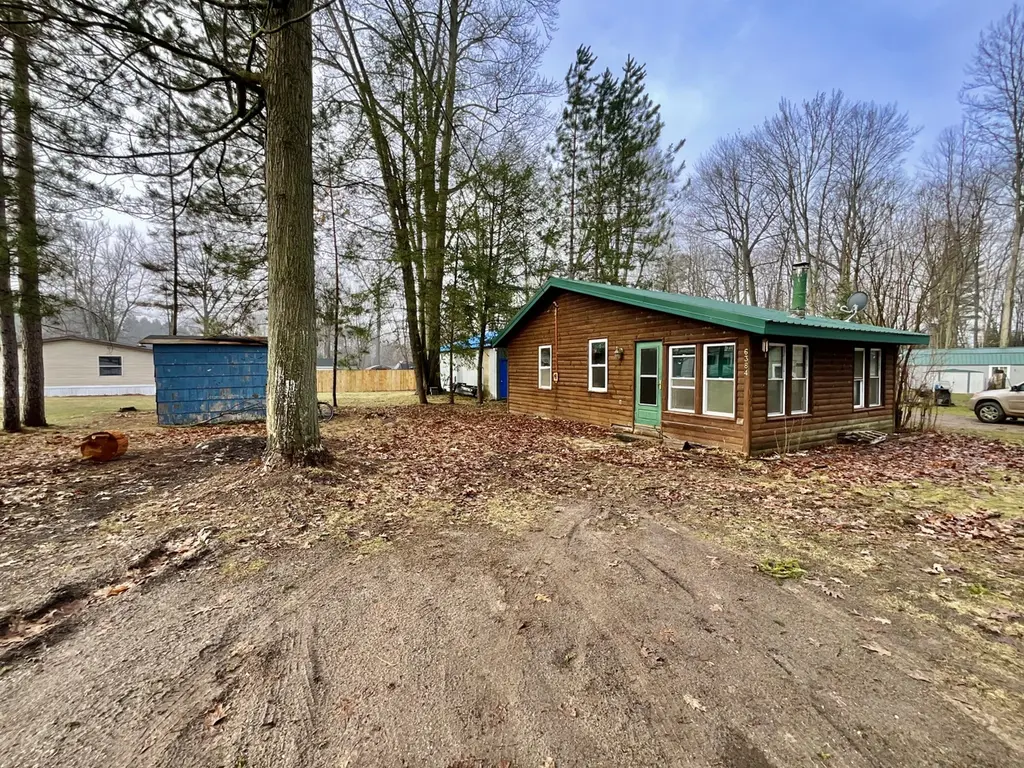
This charming cabin-style ranch offers peaceful lake view living in a quiet setting with immediate possession available. The home features an open layout with vaulted ceilings. It is equipped with infrastructure for a secondary heating unit, a durable metal roof, and low-maintenance vinyl windows. Schedule your private tour today!
Key facts
- Vinyl windows
- Metal roof
- Lake view
Tags
Neighborhood map
What this means for you Summary
Snapshot
- This is a 3-bed/1.0-bath single-family listed at $48k.
Deal economics
- At list price, monthly cash flow is $385 ($5k/yr) — positive.
- The deal already cash-flows at list — no discount required.
- Meets the 1% rule at list price ($854 rent vs $48k).
- Recommended offer: $45k (6.0% below list) — sets the bar for market timing.
Location & tenants
- Location reads: area grade B — affects rentability + tenant quality, not the cash-flow math above.
- Farwell Area Schools (town): math 24% / reading 34% proficiency, ranked #388 of 540 in MI (top 72%) — low school quality limits family demand, transient renter base, plan for 1-2y turnover; 62% free/reduced lunch — lower-income household profile, screen leases tightly.
- Market conditions: 92 active listings in the ZIP; 77 units permitted in Clare County in 2024 (0 in 5+ unit buildings).
Forward outlook
- Local home prices are declining (-3.0%/yr); year-one equity from $328 of loan paydown is wiped out by about $1k of value loss. Plan a longer hold.
- Clare County population projected at -20% by 2050 — secular population decline; favor cash flow + early exit over multi-decade hold.
- At projected returns (-3.0% appreciation + 3.0% rent growth), your $13k cash investment doubles in ~4 years — after that, you're playing with house money.
Negotiation context
- It's been on market 77 days — a 6% lower offer ($45k) is reasonable based on typical stale-listing flexibility.
- 3 sale attempts with the ask held roughly flat each time — persistent listings suggest the price (not the market) is what's stuck; bring a comps-based counter.
Questions for the listing agent
- It's been on market 77 days. Have you received any prior offers? Is the seller open to a 6% concession, seller financing, or rate buy-down credit?
- Built in 1975 — when were the roof, HVAC, electrical panel, plumbing, and water heater last replaced?
- Why hasn't it sold? Are there any deal-killer items the seller is aware of (foundation, flood, title, zoning, code violations)?
- Is there a deadline driving the sale (1031 exchange, divorce, estate, relocation)? That informs how much negotiation room exists.
- What's the average days-on-market for RENTAL listings here right now (not sales)? A rising rental-DOM trend means longer vacancies and softer asking-rent achievability than the comps imply.
- What's the recent tenant-quality profile in this submarket — average credit score on applications, eviction rate, late-payment / NSF rate, and stable-employment percentage? A property-management company in the area should have these aggregated.
- How much new for-sale + rental construction is in the pipeline within 1–3 miles? Heavy new supply typically softens prices + rents 12–24 months out; constrained supply supports both.
Investment metrics
- 1% rule
- 1.80% ✓
- Cap rate
- 16.02%
- Cash-on-cash
- 34.72%
- DSCR
- 2.55
- GRM
- 4.6
CMA / ARV
- ARV (median comp)
- $66,287
- List price
- $47,500
- Delta
- -28.34%
- Verdict
- UNDERPRICED
- Comps
- 1 within 2.0 mi
Projected returns pro-forma
-3.0% appreciation · 3.0% rent growth · sell at horizon
- IRR
- 30.2%
- Equity multiple
- 2.26×
- Total profit
- $16,804
- Equity at exit
- $7,082
- IRR
- 37.4%
- Equity multiple
- 4.47×
- Total profit
- $46,152
- Equity at exit
- $4,107
Cash invested: $13,300 (down + closing). Projections, not guarantees.
Landlord ↔ Tenant lean methodology
- Overall (STATE)
- 62 Landlord-Friendly
- State Michigan
- 62 Landlord-Friendly · EVEN
- County
- — inherits STATE
- City
- — inherits STATE
ZIP-level market 48632
- Home prices YoY
- -27.9%
- Active inventory
- 92
- Price-to-rent
- 4.6×
Monthly cashflow live
- Estimated rent
- $854 medium interval (Pro) →
- Mortgage (P&I)
- −$249
- Tax from tax record
- −$21 /mo · $255/yr
- Insurance
- −$20
- HOA
- −$0
- Vacancy / Maint / Mgmt
- −$179
- Net cashflow
- $385
Break-even live
UW: 25.0% down · 7.5% · 30yr · 1.5% tax · 5.0% vac · 8.0% maint · 8.0% mgmt
Financing live
Cash to close
- Down payment
- $11,875
- Closing costs
- $1,425
- Reserves months
- —
- Total cash needed
- —
Loan-product check · same deal, 3 products live
Conventional
25% down · 7.5% · 30yr
- Down + closing
- —
- Monthly P&I
- —
- Monthly cashflow
- —
- DSCR
- —
- Eligible?
- —
Personal DTI + credit; lowest rate.
DSCR
20% down · 8.5% · 30yr
- Down + closing
- —
- Monthly P&I
- —
- Monthly cashflow
- —
- DSCR
- —
- Eligible?
- —
No personal income docs; deal must DSCR.
Hard money
10% down · 12.0% · 12mo
- Down + closing
- —
- Monthly P&I
- —
- Monthly cashflow
- —
- DSCR
- —
- Eligible?
- —
Short-term bridge; refi at stabilization.
Listing history 21 events
-
2026-06-18days on market $47,500 Active 77 DOM
-
2026-06-17days on market $47,500 Active 76 DOM
-
2026-06-16days on market $47,500 Active 75 DOM
-
2026-06-15days on market $47,500 Active 74 DOM
-
2026-06-13days on market $47,500 Active 72 DOM
-
2026-06-12days on market $47,500 Active 71 DOM
-
2026-06-09days on market $47,500 Active 68 DOM
-
2026-06-08days on market $47,500 Active 67 DOM
-
2026-06-07days on market $47,500 Active 66 DOM
-
2026-06-07days on market $47,500 Active 65 DOM
-
2026-06-04days on market $47,500 Active 62 DOM
-
2026-06-02days on market $47,500 Active 61 DOM
-
2026-06-01days on market $47,500 Active 60 DOM
-
2026-05-31days on market $47,500 Active 59 DOM
-
2026-05-31days on market $47,500 Active 58 DOM
-
2026-04-29price $47,500 332-char remark
Show marketing remark (332 chars)
This charming cabin-style ranch offers peaceful lake view living in a quiet setting with immediate possession available. The home features an open layout with vaulted ceilings. It is equipped with infrastructure for a secondary heating unit, a durable metal roof, and low-maintenance vinyl windows. Schedule your private tour today!
-
2026-04-29price $47,500
Show marketing remark (332 chars)
This charming cabin-style ranch offers peaceful lake view living in a quiet setting with immediate possession available. The home features an open layout with vaulted ceilings. It is equipped with infrastructure for a secondary heating unit, a durable metal roof, and low-maintenance vinyl windows. Schedule your private tour today!
-
2026-03-30$49,900 Active 332-char remark
Show marketing remark (332 chars)
This charming cabin-style ranch offers peaceful lake view living in a quiet setting with immediate possession available. The home features an open layout with vaulted ceilings. It is equipped with infrastructure for a secondary heating unit, a durable metal roof, and low-maintenance vinyl windows. Schedule your private tour today!
-
2026-03-30$49,900 Active
Show marketing remark (332 chars)
This charming cabin-style ranch offers peaceful lake view living in a quiet setting with immediate possession available. The home features an open layout with vaulted ceilings. It is equipped with infrastructure for a secondary heating unit, a durable metal roof, and low-maintenance vinyl windows. Schedule your private tour today!
ⓘ Source: listings_history table (triggers on properties + properties_extension) + one-shot
backfill from property_details.listing_events for pre-trigger history.
Tax reassessment forecast MI · Partial reset (capped growth)
- Current annual tax
- $255 · $21/mo
- Projected year-2 tax
- $493 · $41/mo
- Expected delta
- +$238/yr (+$20/mo · 93.6%)
ⓘ Screening estimate from a state-policy table — verify with the county assessor before closing.
Nearby sold comps map
Loading sold comps map…
Walkable amenities ~0.75 mi
Loading nearby amenities…
Taxation est. · year 1
- Rental income
- $10,253
- − Mortgage interest
- −$2,661
- − Property taxes
- −$255
- − Insurance
- −$238
- − Repairs & maintenance
- −$820
- − Management
- −$820
- − Depreciation
- −$1,382
- Taxable income
- $4,077
- Est. tax owed @ 24.0%
- −$979
- After-tax cash flow
- $3,640/yr
For passive investors: Depreciation is non-cash, so a rental often shows a tax loss while cash-flowing — sheltering income. Rental losses are passive: they offset passive income freely, and up to $25,000/yr can offset ordinary (W-2) income if you actively participate and your MAGI is under $100k (phasing out to $0 by $150k); unused losses carry forward. On sale, claimed depreciation is recaptured at up to 25%, and gains may owe capital-gains tax (a 1031 exchange can defer both). Figures are a year-1 estimate at your 24.0% rate — not tax advice; consult a CPA.
Schools (NCES district)
- District
- Farwell Area Schools
- NCES district ID
- 2614100
- Math proficiency
- 24% ▼ -8.00%
- Reading proficiency
- 34% ▼ -8.00%
- Median HH income
- $36,696
- Composite
- 24.07/100
- National rank
- #7760
- State rank
- #388 of 540 in MI
Livability — Garfield
No livability data for this city. (Only ~50 U.S. cities are tracked.)
Census & demographics
- Population (ZIP)
- 4,995
Population outlook (Clare County) Hauer SSP2
- Today (2025)
- 29,283 people
- By 2030
- 28,199 · -3.7%
- By 2040
- 25,722 · -12.2%
- By 2050
- 23,372 · -20.2%
- By 2075
- 18,569 · -36.6%
- By 2100
- 14,320 · -51.1%
Race, ethnicity, and origin ACS 2023
- Neighborhood character
- Predominantly White (91%)
- Race & ethnicity
- White 91% Two or more races 4% Hispanic / Latino 4%
- Common ancestry
- Romanian 7% Lithuanian 3% Slovak 2%
- Foreign-born
- 2% · Canada, China, South Korea
- Languages at home
- 95% English-only · German/W. Germanic 2% Spanish 1% Chinese 1%
Political lean MEDSL · Clare
- 2024 margin
- Solid R (+37.6) · D 30.5% · R 68.1% · Other 1.4%
- 2008→2024 swing
- -42.4pp toward R · 2008: 4.8pp · 2024: -37.6pp
- All cycles
- 2024: R+37.6 2020: R+34.8 2016: R+31.8 2012: R+4.8 2008: D+4.8
Not yet ingested
- Civics
- —
Market trends
- HPI YoY
- ▼ -90.83%
- Current HPI
- 234.5118
- Rent YoY
- —
- Metro
- —
- State GDP YoY
- ▲ 1.37%
- F500 in state
- 28
Industry mix (Fortune 500 HQ in MI)
| Industry | F500 HQs | Revenue |
|---|---|---|
| Automotive Parts | 3 | $48B |
|
||
| Automotive | 2 | $372B |
|
||
| Chemicals | 1 | $45B |
|
||
| Automotive Retail | 1 | $29B |
|
||
| Healthcare / Medical Devices | 1 | $23B |
|
||
| Automotive Technology | 1 | $20B |
|
||
Price history
-4.8% since first listed6 events — show timeline
- 2026-04-29 Price Changed $47,500 MiRealSource-MiMLS
- 2026-04-29 Price Changed $47,500 REALCOMP
- 2026-04-29 Price Changed $47,500 SW Michigan MLS
- 2026-03-30 Listed $49,900 SW Michigan MLS
- 2026-03-30 Listed $49,900 REALCOMP
- 2026-03-30 Listed $49,900 MiRealSource-MiMLS
Property tax history
-6.4%/yrLatest (2025): $255 · -76.7% YoY. Source: county tax records.
Cash-flow waterfall
monthlySold comps — $/sqft
last 12 mo · ≤1 miLoading sold comps…