 🔨 Auction
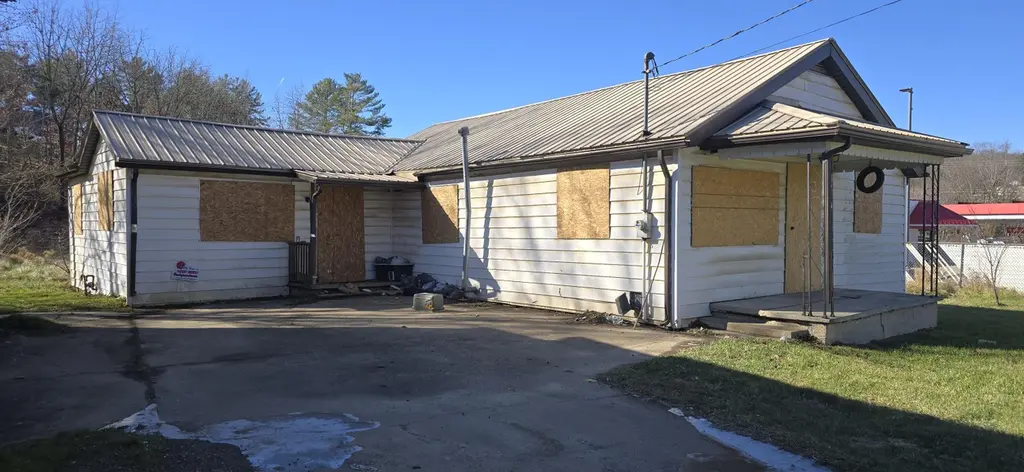
110 Dominion Dr · Crab Orchard, WV
Flood risk 7/10 · Major
- FEMA flood zone
- X (unshaded)
- Chance of flooding over 30 yrs
- 0.76%
- Est. flood insurance / yr
- $507 – $1,088
Fire risk 4/10 · Minor
- Est. fire insurance / yr
- $787 – $1,461
Heat risk 3/10 · Minor
- Hot days now (above 91°F)
- 7 days/yr
- Hot days in 30 yrs
- 22 days/yr
Wind risk 1/10 · Minimal
- Chance of severe wind over 30 yrs
- —
Air-quality risk 1/10 · Minimal
- Unhealthy air days now
- 0 days/yr
- Unhealthy air days in 30 yrs
- 0 days/yr
Risk factors via First Street. Map © Google.
Why this score? — see what drove the D- grade
The composite is a weighted blend of 9 inputs, each scored 0–100. Each bar is that input's sub-score; the figure is the points it added to the 100-point composite (weight × sub-score).
- Cash flow +10.4/30.0
- ARV discount +7.5/15.0
- Appreciation +5.6/10.0
- DSCR +3.0/10.0
- Schools +3.0/10.0
- Livability +2.9/5.0
- Rent growth +2.5/5.0
- Condition / age +2.5/5.0
- 1% rule +1.8/10.0
$24,000
🖨 Deal sheet (PDF) 📄 Offer letter ✓ Due diligence
Listing remarks
Looking for investment property, well here you go, ,, it's 2 for 1.. .there is a single story home AND a detached garage with an apartment over top. .. the possibilities here are endless. https://www. hubzu.com/property/9450018661017-110-DOMINION-DRIVE-Crab-Orchard-WV-25827
Key facts
- Apartment over top
- Single story home
- Detached garage
Tags
Property features AI
Finance
- Other: Lot size approximately 0.37 acres; Zoning listed as Unknown
- Financial info: No investor or income/expense details listed
- HOA & community: No HOA information listed
Exterior
- Parking: Attached garage with 1 garage space; Additional parking with apartment
- Security: No security features listed
- Utilities: No specific utilities listed
- Home design: Residential property; One-story layout
- Construction: Aluminum siding exterior; Block foundation; Built year not specified
- Exterior features: Metal roof
Interior
- Kitchen: No appliances listed
- Bedrooms: Total of 7 rooms (bedroom count not specified)
- Flooring: Carpet; Hardwood; Vinyl; Laminate
- Bathrooms: 1 full bathroom
- Heating & cooling: Forced air heating; No cooling
- Interior features: Laminate counters; Carpet, hardwood, vinyl, and laminate flooring
- Laundry & utility: No laundry or utility appliances listed
Neighborhood map
What this means for you Summary
Snapshot
- This is a 3-bed/1.0-bath single-family listed at $24k.
Deal economics
- At list price, monthly cash flow is $-162 ($-2k/yr) — negative.
- The deal already cash-flows at list — no discount required.
- Meets the 1% rule at list price ($1k rent vs $24k).
- Recommended offer: $23k (3.0% below list) — sets the bar for market timing.
Location & tenants
- Location reads 58/100 on livability (#241 in WV) — a working-class tenant base; expect higher turnover. Strengths: crime A+, cost of living A+, housing A+; Watch: amenities F, commute F, employment F.
- Raleigh County Schools (rural): math 29% / reading 42% proficiency, ranked #14 of 55 in WV (top 26%) — families likely to look elsewhere, expect single-tenant / working-renter base with shorter leases.
- Zoned schools: Independence Middle School (math 33% / reading 52%, grade D-, #13 of 109 statewide, top 13%, 477 students, 0% FRL); Independence High School (math 12% / reading 37%, grade F, #91 of 110 statewide, top 85%, 572 students, 0% FRL) — zoned schools average 0% FRL vs 46% district-wide (46 pts lower); this property's tenant base skews higher-income than the district average.
- Market conditions: 6 active listings in the ZIP; 41 units permitted in Raleigh County in 2024 (0 in 5+ unit buildings).
Forward outlook
- In year one you build about $3k of equity ($1k loan paydown + $2k appreciation (1.2% local appreciation)).
- Raleigh County population projected at -16% by 2050 — secular population decline; favor cash flow + early exit over multi-decade hold.
- By year 9, paydown + projected appreciation supports a ~$31k cash-out refi (75% LTV) — recoverable capital for the next deal without selling this one.
Negotiation context
- It's been on market 50 days — a 3% lower offer ($23k) is reasonable based on typical stale-listing flexibility.
Risks & watch-outs
- Watch-outs: flood insurance adds $66/mo; built in 1945 — expect roof / HVAC / electrical / plumbing capex.
- Climate carrying-cost: major flood risk — expect insurance premiums to compound above CPI over the hold.
Questions for the listing agent
- What do current leases actually rent for vs. the listed asking? Can we see a recent rent roll and the last 12 months of T-12 income?
- It's been on market 50 days. Have you received any prior offers? Is the seller open to a 3% concession, seller financing, or rate buy-down credit?
- Built in 1945 — when were the roof, HVAC, electrical panel, plumbing, and water heater last replaced?
- What's the actual annual flood-insurance premium (NFIP or private), and is the property in a SFHA with mandatory coverage?
- Is there a deadline driving the sale (1031 exchange, divorce, estate, relocation)? That informs how much negotiation room exists.
- Schools are F-rated, which usually means shorter tenancies and higher turnover. Who's the typical renter profile here, and what's been the actual vacancy rate?
- The area grade is low — what's the realistic commute time and amenity access for the typical tenant pool here? Any planned neighborhood developments (good or bad) we should know about?
- What's the average days-on-market for RENTAL listings here right now (not sales)? A rising rental-DOM trend means longer vacancies and softer asking-rent achievability than the comps imply.
- What's the recent tenant-quality profile in this submarket — average credit score on applications, eviction rate, late-payment / NSF rate, and stable-employment percentage? A property-management company in the area should have these aggregated.
- How much new for-sale + rental construction is in the pipeline within 1–3 miles? Heavy new supply typically softens prices + rents 12–24 months out; constrained supply supports both.
Investment metrics
- 1% rule
- 0.68% ✗
- Cap rate
- 5.65%
- Cash-on-cash
- -2.28%
- DSCR
- 0.90
- GRM
- 12.2
CMA / ARV
- ARV (on-the-fly)
- $179,360
- Comps found
- 10
Show comp detail 10 sales within ~0.75 mi
| Address | Dist | Beds/Ba | Sqft | Sold | Price | $/sf | Match |
|---|---|---|---|---|---|---|---|
| 105 Stoney Ave | 0.48mi | 3/1.5 | 1,404 (-8%) | 4mo | $212,000 | $151 | 60 |
| 212 Willis Ave | 0.41mi | 3/2.0 | 1,608 (+6%) | 19mo | $189,900 | $118 | 51 |
| 141 Apple St | 0.56mi | 3/2.0 | 1,467 (-4%) | 20mo | $99,900 | $68 | 47 |
| 150 Oak Ln | 0.51mi | 4/2.0 (+1) | 1,512 (-0%) | 23mo | $196,000 | $130 | 47 |
| 458 Cedar Rd | 0.60mi | 3/2.0 | 1,650 (+9%) | 10mo | $60,000 | $36 | 45 |
| 141 Walter St | 0.55mi | 3/1.0 | 1,403 (-8%) | 20mo | $165,000 | $118 | 44 |
| 166 Wilcox Valley Ave | 0.29mi | 4/2.0 (+1) | 1,336 (-12%) | 19mo | $55,000 | $41 | 42 |
| 1680 Robert C Byrd Dr | 0.56mi | 3/1.0 | 1,394 (-8%) | 22mo | $25,000 | $18 | 41 |
| 422 Lincoln St | 0.70mi | 3/2.0 | 1,455 (-4%) | 18mo | $199,900 | $137 | 41 |
| 233 Crab Orchard Ave | 0.68mi | 4/2.0 (+1) | 1,450 (-5%) | 22mo | $159,000 | $110 | 33 |
Match score weights: distance 35% · size 25% · config 20% · recency 20%. Top-matched comps best support the ARV.
Projected returns pro-forma
1.2% appreciation · 3.0% rent growth · sell at horizon
- IRR
- -2.1%
- Equity multiple
- 0.89×
- Total profit
- $-5,279
- Equity at exit
- $63,063
- IRR
- 2.8%
- Equity multiple
- 1.35×
- Total profit
- $17,752
- Equity at exit
- $85,241
Cash invested: $50,221 (down + closing). Projections, not guarantees.
Landlord ↔ Tenant lean methodology
- Overall (STATE)
- 83 Strongly Landlord-Friendly
- State West Virginia
- 83 Strongly Landlord-Friendly · R+22
- County
- — inherits STATE
- City
- — inherits STATE
ZIP-level market 25827
- Home prices YoY
- 0.6%
- Active inventory
- 6
- Price-to-rent
- 1.6×
Monthly cashflow live
- Estimated rent
- $1,225 medium interval (Pro) →
- Mortgage (P&I)
- −$941
- Tax from tax record
- −$48 /mo · $576/yr
- Insurance
- −$75
- Flood insurance flood zone
- −$66 /mo · $798/yr
- HOA
- −$0
- Vacancy / Maint / Mgmt
- −$257
- Net cashflow
- $-162
Break-even live
Sensitivity live
| Price | -10% $-60 | -5% $-111 | +0% $-162 | +5% $-213 | +10% $-263 |
|---|---|---|---|---|---|
| Rent | -10% $-259 | -5% $-210 | +0% $-162 | +5% $-113 | +10% $-65 |
| Rate | -1.0pp $-72 | -0.5pp $-116 | base $-162 | +0.5pp $-208 | +1.0pp $-256 |
UW: 25.0% down · 7.5% · 30yr · 1.5% tax · 5.0% vac · 8.0% maint · 8.0% mgmt
Financing live
Cash to close
- Down payment
- $44,840
- Closing costs
- $5,381
- Reserves months
- —
- Total cash needed
- —
Loan-product check · same deal, 3 products live
Conventional
25% down · 7.5% · 30yr
- Down + closing
- —
- Monthly P&I
- —
- Monthly cashflow
- —
- DSCR
- —
- Eligible?
- —
Personal DTI + credit; lowest rate.
DSCR
20% down · 8.5% · 30yr
- Down + closing
- —
- Monthly P&I
- —
- Monthly cashflow
- —
- DSCR
- —
- Eligible?
- —
No personal income docs; deal must DSCR.
Hard money
10% down · 12.0% · 12mo
- Down + closing
- —
- Monthly P&I
- —
- Monthly cashflow
- —
- DSCR
- —
- Eligible?
- —
Short-term bridge; refi at stabilization.
Listing history 4 events
-
2026-06-12statusdays on market $24,000 Pending 50 DOM
-
2026-04-22price $24,000
-
2026-04-08$26,000 Active
-
1998-04-16soldstatus $40,775
ⓘ Source: listings_history table (triggers on properties + properties_extension) + one-shot
backfill from property_details.listing_events for pre-trigger history.
Tax reassessment forecast WV · Resets to sale price
- Current annual tax
- $576 · $48/mo
- Projected year-2 tax
- $576 · $48/mo
- Expected delta
- $0/yr ($0/mo · 0.0%)
ⓘ Screening estimate from a state-policy table — verify with the county assessor before closing.
Climate risk First Street
- Flood 7/10 Severe FEMA zone X (unshaded) · 76% chance over 30 yrs
- Wildfire 4/10 Moderate
- Heat 3/10 Moderate 7 d/yr ≥91°F today · 22 d/yr by 30 yrs out
- Wind 1/10 Low
- Air quality 1/10 Low 0 unhealthy d/yr today · 0 by 30 yrs out
Nearby sold comps map
Loading sold comps map…
Walkable amenities ~0.75 mi
Loading nearby amenities…
Taxation est. · year 1
- Rental income
- $14,702
- − Mortgage interest
- −$10,047
- − Property taxes
- −$576
- − Insurance
- −$1,694
- − Repairs & maintenance
- −$1,176
- − Management
- −$1,176
- − Depreciation
- −$5,218
- Taxable loss
- −$5,185
- Est. tax savings @ 24.0%
- +$1,244
- After-tax cash flow
- $-698/yr
For passive investors: Depreciation is non-cash, so a rental often shows a tax loss while cash-flowing — sheltering income. Rental losses are passive: they offset passive income freely, and up to $25,000/yr can offset ordinary (W-2) income if you actively participate and your MAGI is under $100k (phasing out to $0 by $150k); unused losses carry forward. On sale, claimed depreciation is recaptured at up to 25%, and gains may owe capital-gains tax (a 1031 exchange can defer both). Figures are a year-1 estimate at your 24.0% rate — not tax advice; consult a CPA.
Schools (NCES district)
- District
- Raleigh County Schools
- NCES district ID
- 5401230
- Math proficiency
- 29% ▼ -8.00%
- Reading proficiency
- 42% ▼ -3.00%
- Median HH income
- $39,828
- Composite
- 29.74/100
- National rank
- #6445
- State rank
- #14 of 55 in WV
Livability — Crab Orchard
- Score
- 58/100
- State rank
- #241
- US rank
- #20846
Category grades
Schools grade is shown separately in the Schools card above.
Census & demographics
- Census place
- Crab Orchard, WV
- Population (ZIP)
- 1,851
Population outlook (Raleigh County) Hauer SSP2
- Today (2025)
- 73,505 people
- By 2030
- 70,954 · -3.5%
- By 2040
- 66,038 · -10.2%
- By 2050
- 61,919 · -15.8%
- By 2075
- 51,954 · -29.3%
- By 2100
- 39,724 · -46.0%
Race, ethnicity, and origin ACS 2023
- Neighborhood character
- Predominantly White (100%)
- Race & ethnicity
- White 100%
- Common ancestry
- Iranian 1% Slovak 1% Romanian 1%
- Languages at home
- 98% English-only · Spanish 2%
Political lean MEDSL · Raleigh
- 2024 margin
- Solid R (+54.3) · D 22.0% · R 76.3% · Other 1.6%
- 2008→2024 swing
- -28.5pp toward R · 2008: -25.9pp · 2024: -54.3pp
- All cycles
- 2024: R+54.3 2020: R+50.4 2016: R+52.8 2012: R+44.6 2008: R+25.9
Not yet ingested
- Civics
- —
Market trends
- HPI YoY
- ▲ 1.20%
- Current HPI
- 212.1421
- Rent YoY
- —
- Metro
- —
- State GDP YoY
- —
- F500 in state
- 0
Price history
-41.1% since first listed3 events — show timeline
- 2026-04-22 Price Changed $24,000 GVBOR
- 2026-04-08 Listed $26,000 GVBOR
- 1998-04-16 Sold (Public Records) $40,775 Public Records
Property tax history
+29.7%/yrLatest (2025): $576 · +1029.8% YoY. Source: county tax records.
Cash-flow waterfall
monthlySold comps — $/sqft
last 12 mo · ≤1 miLoading sold comps…