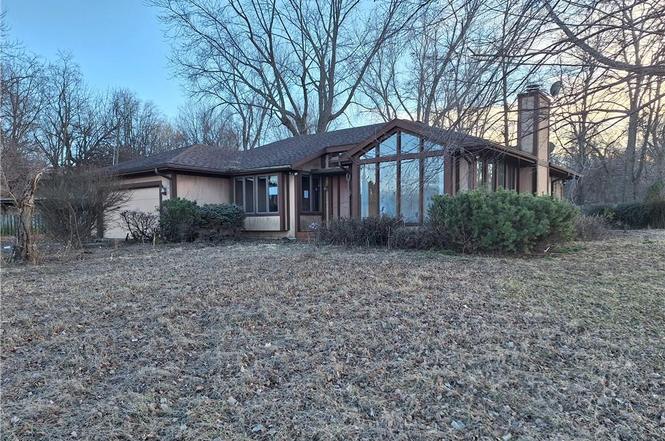
202 Broad St · Waverly, MO
Flood risk 1/10 · Minimal
- FEMA flood zone
- X (unshaded)
- Chance of flooding over 30 yrs
- 0.0%
- Est. flood insurance / yr
- $473 – $860
Fire risk 2/10 · Minimal
- Est. fire insurance / yr
- $1,054 – $1,958
Heat risk 4/10 · Minor
- Hot days now (above 108°F)
- 7 days/yr
- Hot days in 30 yrs
- 16 days/yr
Wind risk 2/10 · Minimal
- Chance of severe wind over 30 yrs
- —
Air-quality risk 1/10 · Minimal
- Unhealthy air days now
- 0 days/yr
- Unhealthy air days in 30 yrs
- 0 days/yr
Risk factors via First Street. Map © Google.
Why this score? — see what drove the C grade
The composite is a weighted blend of 9 inputs, each scored 0–100. Each bar is that input's sub-score; the figure is the points it added to the 100-point composite (weight × sub-score).
- ARV discount +15.0/15.0
- Cash flow +13.2/30.0
- Appreciation +10.0/10.0
- DSCR +4.0/10.0
- 1% rule +3.8/10.0
- Schools +3.7/10.0
- Livability +3.1/5.0
- Rent growth +2.5/5.0
- Condition / age +2.5/5.0
$120,000
🖨 Deal sheet (PDF) 📄 Offer letter ✓ Due diligence
Listing remarks
1990s ranch situated on a . 75-acre corner lot with scenic river views. Main level has a large living room with fireplace and large windows, laundry room, 2-car attached garage, and patio for outdoor enjoyment. Full finished basement includes a second kitchen, family room, and additional non conforming bedroom with a full bathroom. HUD homes are sold as-is; this property needs some updates and repairs but offers great potential for a buyer ready to make it their own. Buyer to verify all information.
Key facts
- Large windows
- Laundry room
- Large living room
Tags
Neighborhood map
What this means for you Summary
Snapshot
- This is a 2-bed/2.0-bath single-family listed at $120k.
Deal economics
- At list price, monthly cash flow is $-2 ($-18/yr) — negative.
- To cash-flow at today's rent, offer at most $120k (0.2% below list).
- To meet the 1% rule (rent ≥ 1% of price), the offer needs to be $105k (12.3% below list).
- Recommended offer: $105k (12.3% below list) — sets the bar for 1% rule.
Location & tenants
- Location reads 62/100 on livability (#367 in MO) — a middle-class / working-renter tenant base. Strengths: crime A+, cost of living A+, housing A-; Watch: amenities F, commute F, employment F.
- Santa Fe R-X (rural): math 30% / reading 50% proficiency, ranked #302 of 535 in MO (top 56%) — families likely to look elsewhere, expect single-tenant / working-renter base with shorter leases.
- Zoned schools: Santa Fe Elem. (math 37% / reading 47%, grade F, #481 of 1,115 statewide, top 46%, 162 students, 54% FRL); Santa Fe High (math 42% / reading 42%, grade F, #218 of 521 statewide, top 45%, 172 students, 43% FRL).
- Market conditions: 9 active listings in the ZIP; 112 units permitted in Lafayette County in 2024 (0 in 5+ unit buildings).
Forward outlook
- In year one you build about $13k of equity ($830 loan paydown + $12k appreciation (10.0% local appreciation)).
- Lafayette County population projected at -21% by 2050 — secular population decline; favor cash flow + early exit over multi-decade hold.
- At projected returns (10.0% appreciation + 3.0% rent growth), your $34k cash investment doubles in ~3 years — after that, you're playing with house money.
- By year 3, paydown + projected appreciation supports a ~$32k cash-out refi (75% LTV) — recoverable capital for the next deal without selling this one.
Negotiation context
- Only 9 days on market — expect competitive offers; lowballing is unlikely to land.
Questions for the listing agent
- What do current leases actually rent for vs. the listed asking? Can we see a recent rent roll and the last 12 months of T-12 income?
- Is there a deadline driving the sale (1031 exchange, divorce, estate, relocation)? That informs how much negotiation room exists.
- Schools are D-rated, which usually means shorter tenancies and higher turnover. Who's the typical renter profile here, and what's been the actual vacancy rate?
- What's the average days-on-market for RENTAL listings here right now (not sales)? A rising rental-DOM trend means longer vacancies and softer asking-rent achievability than the comps imply.
- What's the recent tenant-quality profile in this submarket — average credit score on applications, eviction rate, late-payment / NSF rate, and stable-employment percentage? A property-management company in the area should have these aggregated.
- How much new for-sale + rental construction is in the pipeline within 1–3 miles? Heavy new supply typically softens prices + rents 12–24 months out; constrained supply supports both.
Investment metrics
- 1% rule
- 0.88% ✗
- Cap rate
- 6.28%
- Cash-on-cash
- -0.05%
- DSCR
- 1.00
- GRM
- 9.5
CMA / ARV
- ARV (on-the-fly)
- $229,408
- Comps found
- 4
Show comp detail 4 sales within ~0.75 mi
| Address | Dist | Beds/Ba | Sqft | Sold | Price | $/sf | Match |
|---|---|---|---|---|---|---|---|
| 301 Jefferson St | 0.23mi | 3/1.0 (+1) | 1,686 (-2%) | 18mo | $169,000 | $100 | 63 |
| 402 Jefferson St | 0.27mi | 3/2.0 (+1) | 1,904 (+11%) | 5mo | $130,000 | $68 | 60 |
| 1211 Broad St | 0.74mi | 3/3.0 (+1) | 1,758 (+3%) | 2mo | $235,000 | $134 | 50 |
| 706 W Washington St | 0.62mi | 3/2.0 (+1) | 1,622 (-5%) | 10mo | $244,800 | $151 | 49 |
Match score weights: distance 35% · size 25% · config 20% · recency 20%. Top-matched comps best support the ARV.
Projected returns pro-forma
10.0% appreciation · 3.0% rent growth · sell at horizon
- IRR
- 24.2%
- Equity multiple
- 2.94×
- Total profit
- $65,276
- Equity at exit
- $108,106
- IRR
- 21.5%
- Equity multiple
- 6.72×
- Total profit
- $192,338
- Equity at exit
- $233,134
Cash invested: $33,600 (down + closing). Projections, not guarantees.
Landlord ↔ Tenant lean methodology
- Overall (STATE)
- 81 Strongly Landlord-Friendly
- State Missouri
- 81 Strongly Landlord-Friendly · R+10
- County
- — inherits STATE
- City
- — inherits STATE
ZIP-level market 64096
- Home prices YoY
- 4.0%
- Active inventory
- 9
- Price-to-rent
- 9.5×
Monthly cashflow live
- Estimated rent
- $1,052 medium interval (Pro) →
- Mortgage (P&I)
- −$629
- Tax from tax record
- −$153 /mo · $1,840/yr
- Insurance
- −$50
- HOA
- −$0
- Vacancy / Maint / Mgmt
- −$221
- Net cashflow
- $-2
Break-even live
Sensitivity live
| Price | -10% $66 | -5% $32 | +0% $-2 | +5% $-35 | +10% $-69 |
|---|---|---|---|---|---|
| Rent | -10% $-85 | -5% $-43 | +0% $-2 | +5% $40 | +10% $82 |
| Rate | -1.0pp $59 | -0.5pp $29 | base $-2 | +0.5pp $-33 | +1.0pp $-64 |
UW: 25.0% down · 7.5% · 30yr · 1.5% tax · 5.0% vac · 8.0% maint · 8.0% mgmt
Financing live
Cash to close
- Down payment
- $30,000
- Closing costs
- $3,600
- Reserves months
- —
- Total cash needed
- —
Loan-product check · same deal, 3 products live
Conventional
25% down · 7.5% · 30yr
- Down + closing
- —
- Monthly P&I
- —
- Monthly cashflow
- —
- DSCR
- —
- Eligible?
- —
Personal DTI + credit; lowest rate.
DSCR
20% down · 8.5% · 30yr
- Down + closing
- —
- Monthly P&I
- —
- Monthly cashflow
- —
- DSCR
- —
- Eligible?
- —
No personal income docs; deal must DSCR.
Hard money
10% down · 12.0% · 12mo
- Down + closing
- —
- Monthly P&I
- —
- Monthly cashflow
- —
- DSCR
- —
- Eligible?
- —
Short-term bridge; refi at stabilization.
Listing history 2 events
-
2026-02-12status Pending
-
2026-02-03$120,000 Active
ⓘ Source: listings_history table (triggers on properties + properties_extension) + one-shot
backfill from property_details.listing_events for pre-trigger history.
Tax reassessment forecast MO · Resets to sale price
- Current annual tax
- $1,840 · $153/mo
- Projected year-2 tax
- $1,840 · $153/mo
- Expected delta
- $0/yr ($0/mo · 0.0%)
ⓘ Screening estimate from a state-policy table — verify with the county assessor before closing.
Climate risk First Street
- Flood 1/10 Low FEMA zone X (unshaded) · 0% chance over 30 yrs
- Wildfire 2/10 Low
- Heat 4/10 Moderate 7 d/yr ≥108°F today · 16 d/yr by 30 yrs out
- Wind 2/10 Low
- Air quality 1/10 Low 0 unhealthy d/yr today · 0 by 30 yrs out
Nearby sold comps map
Loading sold comps map…
Walkable amenities ~0.75 mi
Loading nearby amenities…
Taxation est. · year 1
- Rental income
- $12,624
- − Mortgage interest
- −$6,722
- − Property taxes
- −$1,840
- − Insurance
- −$600
- − Repairs & maintenance
- −$1,010
- − Management
- −$1,010
- − Depreciation
- −$3,491
- Taxable loss
- −$2,048
- Est. tax savings @ 24.0%
- +$492
- After-tax cash flow
- $473/yr
For passive investors: Depreciation is non-cash, so a rental often shows a tax loss while cash-flowing — sheltering income. Rental losses are passive: they offset passive income freely, and up to $25,000/yr can offset ordinary (W-2) income if you actively participate and your MAGI is under $100k (phasing out to $0 by $150k); unused losses carry forward. On sale, claimed depreciation is recaptured at up to 25%, and gains may owe capital-gains tax (a 1031 exchange can defer both). Figures are a year-1 estimate at your 24.0% rate — not tax advice; consult a CPA.
Schools (NCES district)
- District
- Santa Fe R-X
- NCES district ID
- 2903000
- Math proficiency
- 30% ▬ 0.00%
- Reading proficiency
- 50% ▲ 10.00%
- Median HH income
- $46,204
- Composite
- 36.52/100
- National rank
- #9304
- State rank
- #302 of 535 in MO
Livability — Waverly
- Score
- 62/100
- State rank
- #367
- US rank
- #16168
Category grades
Schools grade is shown separately in the Schools card above.
Census & demographics
- Census place
- Waverly, MO
- Population (ZIP)
- 1,197
Population outlook (Lafayette County) Hauer SSP2
- Today (2025)
- 31,118 people
- By 2030
- 29,993 · -3.6%
- By 2040
- 27,436 · -11.8%
- By 2050
- 24,585 · -21.0%
- By 2075
- 18,426 · -40.8%
- By 2100
- 12,897 · -58.6%
Race, ethnicity, and origin ACS 2023
- Neighborhood character
- Predominantly White (82%)
- Race & ethnicity
- White 82% Hispanic / Latino 9% Two or more races 6% Black 3%
- Hispanic origin (detail)
- Mexican 9%
- Common ancestry
- Iranian 2% Slovak 1% Italian 1%
- Foreign-born
- 2% · Canada
- Languages at home
- 95% English-only · Spanish 5%
Political lean MEDSL · Lafayette
- 2024 margin
- Solid R (+48.9) · D 24.9% · R 73.8% · Other 1.3%
- 2008→2024 swing
- -33.6pp toward R · 2008: -15.3pp · 2024: -48.9pp
- All cycles
- 2024: R+48.9 2020: R+45.7 2016: R+43.8 2012: R+26.3 2008: R+15.3
Not yet ingested
- Civics
- —
Market trends
- HPI YoY
- ▲ 10.78%
- Current HPI
- 277.9244
- Rent YoY
- —
- Metro
- —
- State GDP YoY
- ▲ 1.84%
- F500 in state
- 20
Industry mix (Fortune 500 HQ in MO)
| Industry | F500 HQs | Revenue |
|---|---|---|
| Healthcare | 1 | $163B |
|
||
| Insurance | 1 | $21B |
|
||
| Industrial Technology | 1 | $17B |
|
||
| Retail | 1 | $16B |
|
||
| Industrial Distribution | 1 | $10B |
|
||
| Utilities | 1 | $9B |
|
||
Price history
2 events — show timeline
- 2026-02-12 Pending — Heartland MLS as Distributed by MLS Grid
- 2026-02-03 Listed $120,000 Heartland MLS as Distributed by MLS Grid
Property tax history
+5.1%/yrLatest (2025): $1,840 · +13.9% YoY. Source: county tax records.
Cash-flow waterfall
monthlySold comps — $/sqft
last 12 mo · ≤1 miLoading sold comps…