 Multi-family
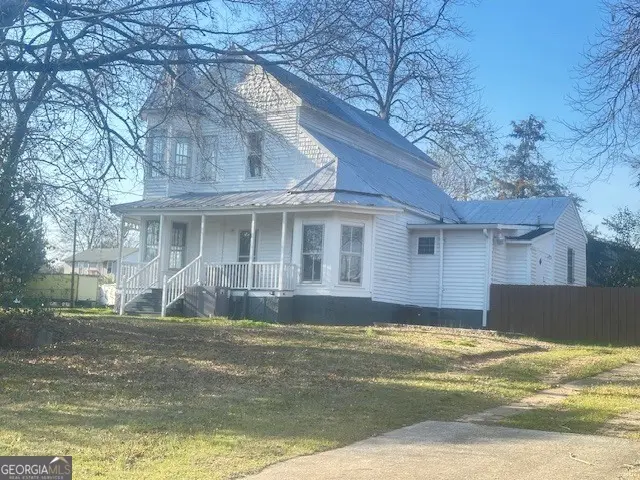
601 N Wayne St · Milledgeville, GA
Flood risk 1/10 · Minimal
- FEMA flood zone
- X (shaded)
- Chance of flooding over 30 yrs
- 0.0%
- Est. flood insurance / yr
- $507 – $1,088
Fire risk 3/10 · Minor
- Est. fire insurance / yr
- $963 – $1,789
Heat risk 7/10 · Major
- Hot days now (above 109°F)
- 7 days/yr
- Hot days in 30 yrs
- 18 days/yr
Wind risk 6/10 · Moderate
- Chance of severe wind over 30 yrs
- 57.0%
Air-quality risk 3/10 · Minor
- Unhealthy air days now
- 3 days/yr
- Unhealthy air days in 30 yrs
- 4 days/yr
Risk factors via First Street. Map © Google.
Why this score? — see what drove the C- grade
The composite is a weighted blend of 9 inputs, each scored 0–100. Each bar is that input's sub-score; the figure is the points it added to the 100-point composite (weight × sub-score).
- Cash flow +24.5/30.0
- DSCR +7.9/10.0
- 1% rule +5.6/10.0
- Rent growth +3.5/5.0
- Livability +3.4/5.0
- ARV discount +3.1/15.0
- Condition / age +2.5/5.0
- Schools +1.4/10.0
- Appreciation +0.0/10.0
$299,000
🖨 Deal sheet 📄 Offer letter ✓ Due diligence
Multi-family units
County records classify this as Multi-Family (2-4 Unit). Listing-text estimate: 1 unit. estimate disagrees with records
Listing remarks MLS
Fantastic Location! 3 blocks to GC campus & downtown Milledgeville. 5 BR 2BA featuring beautiful architectural 1900's design with new flooring, new appliances, and HVAC system. The backyard is fenced for privacy. Wrap around porches for relaxing.
Key facts
- Architectural design
- Wrap around porches
- Fenced backyard
Tags
Neighborhood map
What this means for you Summary
Snapshot
- This is a 3-bed/4.0-bath multifamily listed at $299k.
Deal economics
- At list price, monthly cash flow is $612 ($7k/yr) — positive.
- The deal already cash-flows at list — no discount required.
- Meets the 1% rule at list price ($3k rent vs $299k).
- Recommended offer: $272k (9.0% below list) — sets the bar for market timing.
- Cap rate 8.7% vs local median 2.9% in Milledgeville — top-decile yield for the area; either an underpriced asset or a hidden risk that comps aren't pricing in. Stress-test before assuming the spread holds.
Location & tenants
- Location reads 68/100 on livability (#134 in GA) — a middle-class / working-renter tenant base. Strengths: cost of living A+, health & safety A+, housing A-; Watch: amenities D+, schools F, crime F.
- Baldwin County (town): math 13% / reading 20% proficiency, ranked #152 of 174 in GA (top 87%) — low school quality limits family demand, transient renter base, plan for 1-2y turnover; 72% free/reduced lunch — lower-income household profile, screen leases tightly.
- Market conditions: Rents rising fast (+4.0%/yr); 375 active listings in the ZIP; 1 comparable units currently listed for rent nearby; 202 units permitted in Baldwin County in 2024 (12 in 5+ unit buildings).
- At $3,176/mo this rent would consume 70% of the median local household income ($54k/yr) (locally 1630% of renters already pay >50% of income on rent) — very limited rent-growth headroom before tenants either downsize or default.
Forward outlook
- Local home prices are declining (-3.0%/yr); year-one equity from $2k of loan paydown is wiped out by about $9k of value loss. Plan a longer hold.
- Baldwin County population projected to shrink 8% by 2050 — rents likely to lag national; underwrite the cash flow, not the appreciation.
Negotiation context
- It's been on market 107 days — a 9% lower offer ($272k) is reasonable based on typical stale-listing flexibility.
- 3 sale attempts with the ask held roughly flat each time — persistent listings suggest the price (not the market) is what's stuck; bring a comps-based counter.
- Current owner paid $210k; 42% above their basis — modest negotiation headroom, anchor on the comps not their cost.
Risks & watch-outs
- Watch-outs: built in 1930 — expect roof / HVAC / electrical / plumbing capex.
- Climate carrying-cost: major wind risk, 57% chance of damaging wind over 30y; extreme-heat days projected 7→18/yr by 2055 (HVAC capex compounding) — expect insurance premiums to compound above CPI over the hold.
Questions for the listing agent
- It's been on market 107 days. Have you received any prior offers? Is the seller open to a 9% concession, seller financing, or rate buy-down credit?
- Built in 1930 — when were the roof, HVAC, electrical panel, plumbing, and water heater last replaced?
- Why hasn't it sold? Are there any deal-killer items the seller is aware of (foundation, flood, title, zoning, code violations)?
- Is there a deadline driving the sale (1031 exchange, divorce, estate, relocation)? That informs how much negotiation room exists.
- Schools are F-rated, which usually means shorter tenancies and higher turnover. Who's the typical renter profile here, and what's been the actual vacancy rate?
- Crime grade is F in this area — have there been break-ins, vandalism, or insurance claims at this property in the last 3 years? What carrier currently insures it and at what premium?
- What's the average days-on-market for RENTAL listings here right now (not sales)? A rising rental-DOM trend means longer vacancies and softer asking-rent achievability than the comps imply.
- What's the recent tenant-quality profile in this submarket — average credit score on applications, eviction rate, late-payment / NSF rate, and stable-employment percentage? A property-management company in the area should have these aggregated.
- How much new apartment / multifamily construction is in the pipeline within 1–3 miles? Heavy new supply (>2% of stock underway) typically softens rents 12–24 months out; light construction supports rent growth.
Investment metrics
- 1% rule
- 1.06% ✓
- Cap rate
- 8.75%
- Cash-on-cash
- 8.77%
- DSCR
- 1.39
- GRM
- 7.8
CMA / ARV
- ARV (median comp)
- $272,445
- List price
- $299,000
- Delta
- 9.75%
- Verdict
- FAIR
- Comps
- 18 within 1.0 mi
Projected returns pro-forma
-3.0% appreciation · 4.05% rent growth · sell at horizon
- IRR
- -1.9%
- Equity multiple
- 0.93×
- Total profit
- $-6,129
- Equity at exit
- $44,582
- IRR
- 8.8%
- Equity multiple
- 1.70×
- Total profit
- $58,850
- Equity at exit
- $25,852
Cash invested: $83,720 (down + closing). Projections, not guarantees.
Landlord ↔ Tenant lean methodology
- Overall (STATE)
- 90 Strongly Landlord-Friendly
- State Georgia
- 90 Strongly Landlord-Friendly · R+3
- County
- — inherits STATE
- City
- — inherits STATE
ZIP-level market 31061
- Home prices YoY
- -29.9%
- Rents YoY
- 4.0%
- Active inventory
- 375
- Price-to-rent
- 23.5×
Monthly cashflow live
- Estimated rent
- $3,176 high interval (Pro) →
- Mortgage (P&I)
- −$1,568
- Tax from tax record
- −$204 /mo · $2,452/yr
- Insurance
- −$125
- HOA
- −$0
- Vacancy / Maint / Mgmt
- −$667
- Net cashflow
- $612
Break-even live
3-unit breakdown (identical units grouped — click to expand)
| Units | Beds | Baths | Est. rent |
|---|---|---|---|
| 3× units | 2 | 1 | $3,177 |
| #1 | 2 | 1 | $1,059 |
| #2 | 2 | 1 | $1,059 |
| #3 | 2 | 1 | $1,059 |
| Total (3 units) | $3,176 | ||
UW: 25.0% down · 7.5% · 30yr · 1.5% tax · 5.0% vac · 8.0% maint · 8.0% mgmt
Financing live
Cash to close
- Down payment
- $74,750
- Closing costs
- $8,970
- Reserves months
- —
- Total cash needed
- —
Loan-product check · same deal, 3 products live
Conventional
25% down · 7.5% · 30yr
- Down + closing
- —
- Monthly P&I
- —
- Monthly cashflow
- —
- DSCR
- —
- Eligible?
- —
Personal DTI + credit; lowest rate.
DSCR
20% down · 8.5% · 30yr
- Down + closing
- —
- Monthly P&I
- —
- Monthly cashflow
- —
- DSCR
- —
- Eligible?
- —
No personal income docs; deal must DSCR.
Hard money
10% down · 12.0% · 12mo
- Down + closing
- —
- Monthly P&I
- —
- Monthly cashflow
- —
- DSCR
- —
- Eligible?
- —
Short-term bridge; refi at stabilization.
Rent comps 1 comps
| Address | Beds | Baths | Sqft | Rent | $/sqft | DOM | Units | Dist |
|---|---|---|---|---|---|---|---|---|
| 1753 Cedarwood Rd Milledgeville, GA | 3.0 | 2.0 | 1740 | $1,800 | $1.03 | 44d | 1 | 1.45mi |
Listing history 22 events
-
2026-06-19days on market $299,000 Active 107 DOM
-
2026-06-18days on market $299,000 Active 106 DOM
-
2026-06-17days on market $299,000 Active 105 DOM
-
2026-06-16days on market $299,000 Active 104 DOM
-
2026-06-15days on market $299,000 Active 103 DOM
-
2026-06-14days on market $299,000 Active 101 DOM
-
2026-06-12days on market $299,000 Active 100 DOM
-
2026-06-09days on market $299,000 Active 97 DOM
-
2026-06-08days on market $299,000 Active 96 DOM
-
2026-06-07days on market $299,000 Active 95 DOM
-
2026-06-05days on market $299,000 Active 92 DOM
-
2026-06-03days on market $299,000 Active 91 DOM
-
2026-06-02days on market $299,000 Active 90 DOM
-
2026-06-01days on market $299,000 Active 89 DOM
-
2026-05-31days on market $299,000 Active 88 DOM
-
2026-05-30days on market $299,000 Active 87 DOM
-
2026-03-03$299,000 New 250-char remark
Show marketing remark (250 chars)
Fantastic Location! 3 blocks to GC campus & downtown Milledgeville. 5 BR 2BA featuring beautiful architectural 1900's design with new flooring, new appliances, and HVAC system. The backyard is fenced for privacy. Wrap around porches for relaxing.
-
2026-02-20historical
-
2026-02-02status Back On Market
-
2026-01-31historical
-
2025-09-19$375,000 New
-
2020-12-30soldstatus $210,000
ⓘ Source: listings_history table (triggers on properties + properties_extension) + one-shot
backfill from property_details.listing_events for pre-trigger history.
Tax reassessment forecast GA · Resets to sale price
- Current annual tax
- $2,452 · $204/mo
- Projected year-2 tax
- $2,751 · $229/mo
- Expected delta
- +$299/yr (+$25/mo · 12.2%)
ⓘ Screening estimate from a state-policy table — verify with the county assessor before closing.
Climate risk First Street
- Flood 1/10 Low FEMA zone X (shaded) · 0% chance over 30 yrs
- Wildfire 3/10 Moderate
- Heat 7/10 Severe 7 d/yr ≥109°F today · 18 d/yr by 30 yrs out
- Wind 6/10 Major 57% chance of damaging wind over 30 yrs
- Air quality 3/10 Moderate 3 unhealthy d/yr today · 4 by 30 yrs out
Nearby sold comps map
Loading sold comps map…
Walkable amenities ~0.75 mi
Loading nearby amenities…
Taxation est. · year 1
- Rental income
- $38,112
- − Mortgage interest
- −$16,749
- − Property taxes
- −$2,452
- − Insurance
- −$1,495
- − Repairs & maintenance
- −$3,049
- − Management
- −$3,049
- − Depreciation
- −$8,698
- Taxable income
- $2,620
- Est. tax owed @ 24.0%
- −$629
- After-tax cash flow
- $6,717/yr
For passive investors: Depreciation is non-cash, so a rental often shows a tax loss while cash-flowing — sheltering income. Rental losses are passive: they offset passive income freely, and up to $25,000/yr can offset ordinary (W-2) income if you actively participate and your MAGI is under $100k (phasing out to $0 by $150k); unused losses carry forward. On sale, claimed depreciation is recaptured at up to 25%, and gains may owe capital-gains tax (a 1031 exchange can defer both). Figures are a year-1 estimate at your 24.0% rate — not tax advice; consult a CPA.
Schools (NCES district)
- District
- Baldwin County
- NCES district ID
- 1300210
- Math proficiency
- 13% ▼ -8.00%
- Reading proficiency
- 20% ▼ -5.00%
- Median HH income
- $35,615
- Composite
- 13.61/100
- National rank
- #9508
- State rank
- #152 of 174 in GA
Livability — Milledgeville
- Score
- 68/100
- State rank
- #134
- US rank
- #9206
Category grades
Schools grade is shown separately in the Schools card above.
Census & demographics
- Census place
- Milledgeville, GA
- County
- Baldwin County · 41,764 people
- City population
- 41,764
- Metro
- Milledgeville, GA
- Population (ZIP)
- 41,764
- Household income
- $54,263
- Rent vs Own
- Severe rent burden
- 1630.0
Population outlook (Baldwin County) Hauer SSP2
- Today (2025)
- 45,602 people
- By 2030
- 45,481 · -0.3%
- By 2040
- 44,310 · -2.8%
- By 2050
- 42,129 · -7.6%
- By 2075
- 36,819 · -19.3%
- By 2100
- 29,320 · -35.7%
Race, ethnicity, and origin ACS 2023
- Neighborhood character
- Diverse neighborhood (Simpson 0.56)
- Race & ethnicity
- White 51% Black 43% Hispanic / Latino 3% Two or more races 3% Asian 2%
- Common ancestry
- Slovak 1% Serbian 1% Italian 1%
- Foreign-born
- 3% · Canada, South Korea
- Languages at home
- 96% English-only · Spanish 2% Korean 1%
Political lean MEDSL · Baldwin
- 2024 margin
- Toss-up / Even · D 48.6% · R 50.9%
- 2008→2024 swing
- -6.8pp toward R · 2008: 4.6pp · 2024: -2.2pp
- All cycles
- 2024: R+2.2 2020: D+1.3 2016: D+1.7 2012: D+5.5 2008: D+4.6
Not yet ingested
- Civics
- —
Market trends
- HPI YoY
- ▼ -103.16%
- Current HPI
- 241.3758
- Rent YoY
- ▲ 4.05%
- Metro
- Milledgeville, GA
- State GDP YoY
- ▲ 2.66%
- F500 in state
- 28
Industry mix (Fortune 500 HQ in GA)
| Industry | F500 HQs | Revenue |
|---|---|---|
| Paper / Packaging | 2 | $29B |
|
||
| Retail | 1 | $160B |
|
||
| Transportation / Logistics | 1 | $91B |
|
||
| Airlines | 1 | $62B |
|
||
| Consumer Goods | 1 | $47B |
|
||
| Utilities | 1 | $25B |
|
||
Price history
+42.4% since first listed6 events — show timeline
- 2026-03-03 Listed $299,000 GAMLS
- 2026-02-20 Listing Removed — GAMLS
- 2026-02-02 Relisted — GAMLS
- 2026-01-31 Listing Removed — GAMLS
- 2025-09-19 Listed $375,000 GAMLS
- 2020-12-30 Sold (Public Records) $210,000 Public Records
Property tax history
+8.3%/yrLatest (2025): $2,452 · -2.6% YoY. Source: county tax records.
Cash-flow waterfall
monthlySold comps — $/sqft
last 12 mo · ≤1 miLoading sold comps…