 Triplex
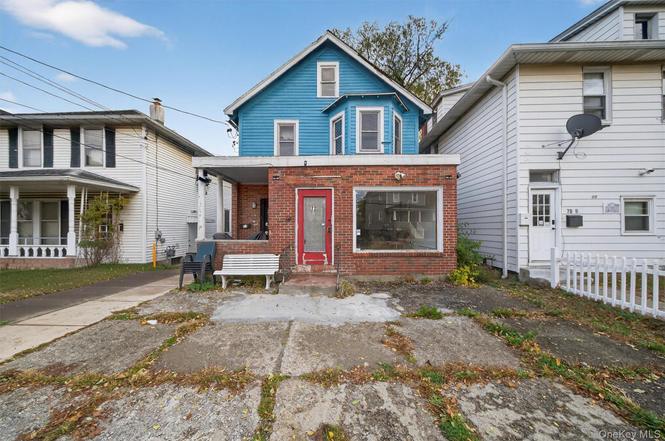
72 Wisner Ave · Newburgh, NY
Flood risk No data
- FEMA flood zone
- —
- Chance of flooding over 30 yrs
- —
- Est. flood insurance / yr
- —
Fire risk No data
- Est. fire insurance / yr
- —
Heat risk No data
- Hot days now (above threshold)
- —
- Hot days in 30 yrs
- —
Wind risk No data
- Chance of severe wind over 30 yrs
- —
Air-quality risk No data
- Unhealthy air days now
- —
- Unhealthy air days in 30 yrs
- —
Risk factors via First Street. Map © Google.
Why this score? — see what drove the B- grade
The composite is a weighted blend of 9 inputs, each scored 0–100. Each bar is that input's sub-score; the figure is the points it added to the 100-point composite (weight × sub-score).
- Cash flow +30.0/30.0
- 1% rule +10.0/10.0
- DSCR +10.0/10.0
- ARV discount +7.5/15.0
- Schools +3.5/10.0
- Livability +3.1/5.0
- Rent growth +2.7/5.0
- Condition / age +2.5/5.0
- Appreciation +0.0/10.0
$339,000
🖨 Deal sheet 📄 Offer letter ✓ Due diligence
Multi-family units
County records classify this as Multi-Family (2-4 Unit). Listing-text estimate: 3 units. confirmed
Listing remarks
Discover a fantastic investment opportunity in the vibrant city of Newburgh with this charming 3-unit property that promises both comfort and profitability. All units are currently rented, generating income at an impressive 11% cap rate, making it an ideal choice for investors and homeowners alike. The first floor features a well-appointed 2-bedroom, 1-bath apartment with a cozy atmosphere and spacious living areas appreciated by current tenants. The first floor also features a studio room and bathroom which can be used for commercial/retail. The second-floor unit is a spacious 3-bedroom, 1-bath apartment with access to a beautifully finished attic, offering versatility for use as a home of
Key facts
- Currently rented
- 11 cap rate
- Commercial retail
Tags
Property features AI
Exterior
- Parking: On-street parking
- Utilities: Public sewer; Electricity connected (Orange & Rockland); Natural gas connected; Water connected; Cable connected; Phone connected
- Home design: Duplex; Actual property condition
- Construction: Frame construction; Finished attic; Unfinished basement
- Exterior features: Cleared lot
Interior
- Kitchen: Eat-in kitchen; Open kitchen; Pantry
- Bedrooms: One 2-bedroom unit; One 3-bedroom unit
- Bathrooms: Three full bathrooms
- Heating & cooling: Baseboard heating; Central air conditioning
- Interior features: Eat-in kitchen; Entrance foyer; Formal dining room; High ceilings; Natural woodwork; Open floorplan; Open kitchen; Original details; Pantry; Washer/dryer hookup
- Laundry & utility: Washer/dryer hookup
Neighborhood map
What this means for you Summary
Snapshot
- This is a 3 × 5-bed/3.0-bath units multifamily listed at $339k.
Deal economics
- At list price, monthly cash flow is $4k ($43k/yr) — positive. Per door: $1k/mo.
- The deal already cash-flows at list — no discount required.
- Meets the 1% rule at list price ($8k rent vs $339k).
- Recommended offer: $298k (12.0% below list) — sets the bar for market timing.
- Cap rate 19.0% vs local median 4.4% in Newburgh — top-decile yield for the area; either an underpriced asset or a hidden risk that comps aren't pricing in. Stress-test before assuming the spread holds.
Location & tenants
- Location reads 62/100 on livability (#878 in NY) — a middle-class / working-renter tenant base. Strengths: health & safety A+, housing B+, cost of living B; Watch: employment D+, crime F, amenities F.
- Newburgh City School District (suburban): math 33% / reading 48% proficiency, ranked #500 of 590 in NY (top 85%) — families likely to look elsewhere, expect single-tenant / working-renter base with shorter leases; 61% free/reduced lunch — lower-income household profile, screen leases tightly.
- Zoned schools: Meadow Hill Global Explorations Magnet School (math 24% / reading 47%, grade F, #1,566 of 2,108 statewide, top 74%, 1,013 students, 58% FRL); Newburgh Free Academy (math 76% / reading 85%, grade A, #506 of 1,100 statewide, top 46%, 3,433 students, 56% FRL) — zoned schools at 57% FRL track the district average.
- Zoned-school proficiency averages 58% at this address vs 40% district-wide (+18 pts) — the actual schools serving this property are materially stronger than the Newburgh City School District average implies; a family-tenant draw the district grade alone would hide.
- Market conditions: Rents flat; 383 active listings in the ZIP; solid renter incomes; 1,746 units permitted in Orange County in 2024 (1,265 in 5+ unit buildings).
- At $7,552/mo this rent would consume 106% of the median local household income ($86k/yr) (locally 2412% of renters already pay >50% of income on rent) — very limited rent-growth headroom before tenants either downsize or default.
Forward outlook
- Local home prices are declining (-3.0%/yr); year-one equity from $2k of loan paydown is wiped out by about $10k of value loss. Plan a longer hold.
- At projected returns (-3.0% appreciation + 0.6% rent growth), your $95k cash investment doubles in ~3 years — after that, you're playing with house money.
Negotiation context
- It's been on market 185 days — a 12% lower offer ($298k) is reasonable based on typical stale-listing flexibility.
- 3 sale attempts; this cycle's ask is 15309% above the opening price — seller raised mid-cycle; expect resistance to lowballs.
- Current owner paid $280k; 21% above their basis — modest negotiation headroom, anchor on the comps not their cost.
Questions for the listing agent
- It's been on market 185 days. Have you received any prior offers? Is the seller open to a 12% concession, seller financing, or rate buy-down credit?
- Can we see the unit-by-unit rent roll, current vacancy, and any below-market leases? What's the average tenancy length?
- What capital expenditures (roof, boiler, parking lot, exteriors) have been made in the last 5 years, and what's planned in the next 2?
- Built in 1968 — when were the roof, HVAC, electrical panel, plumbing, and water heater last replaced?
- Why hasn't it sold? Are there any deal-killer items the seller is aware of (foundation, flood, title, zoning, code violations)?
- Is there a deadline driving the sale (1031 exchange, divorce, estate, relocation)? That informs how much negotiation room exists.
- Schools are D-rated, which usually means shorter tenancies and higher turnover. Who's the typical renter profile here, and what's been the actual vacancy rate?
- Crime grade is F in this area — have there been break-ins, vandalism, or insurance claims at this property in the last 3 years? What carrier currently insures it and at what premium?
- What's the average days-on-market for RENTAL listings here right now (not sales)? A rising rental-DOM trend means longer vacancies and softer asking-rent achievability than the comps imply.
- What's the recent tenant-quality profile in this submarket — average credit score on applications, eviction rate, late-payment / NSF rate, and stable-employment percentage? A property-management company in the area should have these aggregated.
- How much new apartment / multifamily construction is in the pipeline within 1–3 miles? Heavy new supply (>2% of stock underway) typically softens rents 12–24 months out; light construction supports rent growth.
Investment metrics
- 1% rule
- 2.23% ✓
- Cap rate
- 18.95%
- Cash-on-cash
- 45.21%
- DSCR
- 3.01
- GRM
- 3.7
CMA / ARV
No comps found within radius.
Projected returns pro-forma
-3.0% appreciation · 0.63% rent growth · sell at horizon
- IRR
- 39.6%
- Equity multiple
- 2.64×
- Total profit
- $155,394
- Equity at exit
- $50,546
- IRR
- 44.8%
- Equity multiple
- 4.80×
- Total profit
- $360,351
- Equity at exit
- $29,311
Cash invested: $94,920 (down + closing). Projections, not guarantees.
Landlord ↔ Tenant lean methodology
- Overall (STATE)
- 15 Strongly Tenant-Friendly
- State New York
- 15 Strongly Tenant-Friendly · D+10
- County
- — inherits STATE
- City
- — inherits STATE
ZIP-level market 12550
- Home prices YoY
- -33.3%
- Rents YoY
- 0.6%
- Active inventory
- 383
- Price-to-rent
- 11.2×
Monthly cashflow live
- Estimated rent
- $7,552 medium interval (Pro) →
- Mortgage (P&I)
- −$1,778
- Tax from tax record
- −$471 /mo · $5,649/yr
- Insurance
- −$141
- HOA
- −$0
- Vacancy / Maint / Mgmt
- −$1,586
- Net cashflow
- $3,576
Break-even live
3-unit breakdown (identical units grouped — click to expand)
| Units | Beds | Baths | Est. rent |
|---|---|---|---|
| 3× units | 5 | 3 | $7,551 |
| #1 | 5 | 3 | $2,517 |
| #2 | 5 | 3 | $2,517 |
| #3 | 5 | 3 | $2,517 |
| Total (3 units) | $7,552 | ||
UW: 25.0% down · 7.5% · 30yr · 1.5% tax · 5.0% vac · 8.0% maint · 8.0% mgmt
Financing live
Cash to close
- Down payment
- $84,750
- Closing costs
- $10,170
- Reserves months
- —
- Total cash needed
- —
Loan-product check · same deal, 3 products live
Conventional
25% down · 7.5% · 30yr
- Down + closing
- —
- Monthly P&I
- —
- Monthly cashflow
- —
- DSCR
- —
- Eligible?
- —
Personal DTI + credit; lowest rate.
DSCR
20% down · 8.5% · 30yr
- Down + closing
- —
- Monthly P&I
- —
- Monthly cashflow
- —
- DSCR
- —
- Eligible?
- —
No personal income docs; deal must DSCR.
Hard money
10% down · 12.0% · 12mo
- Down + closing
- —
- Monthly P&I
- —
- Monthly cashflow
- —
- DSCR
- —
- Eligible?
- —
Short-term bridge; refi at stabilization.
Listing history 20 events
-
2026-06-18days on market $339,000 Active 185 DOM
-
2026-06-17days on market $339,000 Active 184 DOM
-
2026-06-16days on market $339,000 Active 183 DOM
-
2026-06-15days on market $339,000 Active 182 DOM
-
2026-06-14days on market $339,000 Active 180 DOM
-
2026-06-13days on market $339,000 Active 179 DOM
-
2026-06-10statusdays on market $339,000 Active 177 DOM
-
2026-05-23historical $2,200
-
2026-04-26$2,200
-
2026-04-22status Pending
-
2026-03-18price $339,000
-
2026-03-11price $350,000
-
2026-02-17price $359,000
-
2026-01-30price $369,000
-
2025-11-12price $399,000
-
2025-10-27$419,000 Active
-
2025-03-08historical $2,400
-
2025-02-28$2,400
-
2022-04-28soldstatus $280,000
-
1985-10-02soldstatus $35,000
ⓘ Source: listings_history table (triggers on properties + properties_extension) + one-shot
backfill from property_details.listing_events for pre-trigger history.
Tax reassessment forecast NY · Partial reset (capped growth)
- Current annual tax
- $5,649 · $471/mo
- Projected year-2 tax
- $5,689 · $474/mo
- Expected delta
- +$40/yr (+$3/mo · 0.7%)
ⓘ Screening estimate from a state-policy table — verify with the county assessor before closing.
Nearby sold comps map
Loading sold comps map…
Walkable amenities ~0.75 mi
Loading nearby amenities…
Taxation est. · year 1
- Rental income
- $90,624
- − Mortgage interest
- −$18,989
- − Property taxes
- −$5,649
- − Insurance
- −$1,695
- − Repairs & maintenance
- −$7,250
- − Management
- −$7,250
- − Depreciation
- −$9,862
- Taxable income
- $39,929
- Est. tax owed @ 24.0%
- −$9,583
- After-tax cash flow
- $33,333/yr
For passive investors: Depreciation is non-cash, so a rental often shows a tax loss while cash-flowing — sheltering income. Rental losses are passive: they offset passive income freely, and up to $25,000/yr can offset ordinary (W-2) income if you actively participate and your MAGI is under $100k (phasing out to $0 by $150k); unused losses carry forward. On sale, claimed depreciation is recaptured at up to 25%, and gains may owe capital-gains tax (a 1031 exchange can defer both). Figures are a year-1 estimate at your 24.0% rate — not tax advice; consult a CPA.
Schools (NCES district)
- District
- Newburgh City School District
- NCES district ID
- 3620700
- Math proficiency
- 33% ▼ -8.00%
- Reading proficiency
- 48% ▲ 10.00%
- Median HH income
- $56,387
- Composite
- 35.46/100
- National rank
- #4927
- State rank
- #500 of 590 in NY
Livability — Newburgh
- Score
- 62/100
- State rank
- #878
- US rank
- #17021
Category grades
Schools grade is shown separately in the Schools card above.
Census & demographics
- Census place
- Newburgh, NY
- County
- Orange County · 267,004 people
- City population
- 55,152
- Metro
- Poughkeepsie-Newburgh-Middletown, NY
- Population (ZIP)
- 55,152
- Household income
- $85,697
- Rent vs Own
- Severe rent burden
- 2412.0
Population outlook (Orange County) Hauer SSP2
- Today (2025)
- 379,830 people
- By 2030
- 378,955 · -0.2%
- By 2040
- 375,444 · -1.2%
- By 2050
- 369,311 · -2.8%
- By 2075
- 354,233 · -6.7%
- By 2100
- 318,150 · -16.2%
Race, ethnicity, and origin ACS 2023
- Neighborhood character
- Diverse neighborhood (Simpson 0.68)
- Race & ethnicity
- Hispanic / Latino 39% White 36% Black 20% Two or more races 12% Asian 2%
- Hispanic origin (detail)
- Mexican 14% Puerto Rican 10% Dominican 2%
- Common ancestry
- Romanian 2% Hispanic 1% Lithuanian 1%
- Foreign-born
- 18% · Canada, Dominican Republic
- Languages at home
- 64% English-only · Spanish 30% French/Haitian/Cajun 1% Other Indo-European 1%
Political lean MEDSL · Orange
- 2024 margin
- Lean R (+8.4) · D 45.8% · R 54.2%
- 2008→2024 swing
- -12.5pp toward R · 2008: 4.1pp · 2024: -8.4pp
- All cycles
- 2024: R+8.4 2020: R+0.2 2016: R+6.5 2012: D+5.2 2008: D+4.1
Not yet ingested
- Civics
- —
Market trends
- HPI YoY
- ▼ -151.93%
- Current HPI
- 304.1046
- Rent YoY
- ▲ 0.63%
- Metro
- Poughkeepsie-Newburgh-Middletown, NY
- State GDP YoY
- ▲ 2.60%
- F500 in state
- 92
Industry mix (Fortune 500 HQ in NY)
| Industry | F500 HQs | Revenue |
|---|---|---|
| Financial Services | 10 | $950B |
|
||
| Consumer Goods | 9 | $162B |
|
||
| Insurance | 4 | $225B |
|
||
| Telecommunications | 2 | $144B |
|
||
| Pharmaceuticals | 2 | $112B |
|
||
| Media / Entertainment | 2 | $69B |
|
||
Price history
-93.7% since first listed13 events — show timeline
- 2026-05-23 Rental Removed $2,200 LISTANZA
- 2026-04-26 Listed for Rent $2,200 LISTANZA
- 2026-04-22 Pending — OneKey® MLS as Distributed by MLS Grid
- 2026-03-18 Price Changed $339,000 OneKey® MLS as Distributed by MLS Grid
- 2026-03-11 Price Changed $350,000 OneKey® MLS as Distributed by MLS Grid
- 2026-02-17 Price Changed $359,000 OneKey® MLS as Distributed by MLS Grid
- 2026-01-30 Price Changed $369,000 OneKey® MLS as Distributed by MLS Grid
- 2025-11-12 Price Changed $399,000 OneKey® MLS as Distributed by MLS Grid
- 2025-10-27 Listed $419,000 OneKey® MLS as Distributed by MLS Grid
- 2025-03-08 Rental Removed $2,400 ONEKEY
- 2025-02-28 Listed for Rent $2,400 ONEKEY
- 2022-04-28 Sold (Public Records) $280,000 Public Records
- 1985-10-02 Sold (Public Records) $35,000 Public Records
Property tax history
-1.9%/yrLatest (2025): $5,649 · +20.6% YoY. Source: county tax records.
Cash-flow waterfall
monthlySold comps — $/sqft
last 12 mo · ≤1 miLoading sold comps…