4728 Winding Trl · Greensboro, NC
Flood risk 1/10 · Minimal
- FEMA flood zone
- X (unshaded)
- Chance of flooding over 30 yrs
- 0.0%
- Est. flood insurance / yr
- $507 – $1,088
Fire risk 2/10 · Minimal
- Est. fire insurance / yr
- $906 – $1,684
Heat risk 5/10 · Moderate
- Hot days now (above 102°F)
- 7 days/yr
- Hot days in 30 yrs
- 18 days/yr
Wind risk 4/10 · Minor
- Chance of severe wind over 30 yrs
- 12.0%
Air-quality risk 2/10 · Minimal
- Unhealthy air days now
- 1 days/yr
- Unhealthy air days in 30 yrs
- 2 days/yr
Risk factors via First Street. Map © Google.
Why this score? — see what drove the D grade
The composite is a weighted blend of 9 inputs, each scored 0–100. Each bar is that input's sub-score; the figure is the points it added to the 100-point composite (weight × sub-score).
- Cash flow +12.0/30.0
- ARV discount +7.5/15.0
- Condition / age +4.8/5.0
- Livability +4.0/5.0
- Rent growth +3.9/5.0
- Schools +3.6/10.0
- DSCR +3.5/10.0
- 1% rule +3.4/10.0
- Appreciation +0.0/10.0
$369,770
🖨 Deal sheet (PDF) 📄 Offer letter ✓ Due diligence
Listing remarks
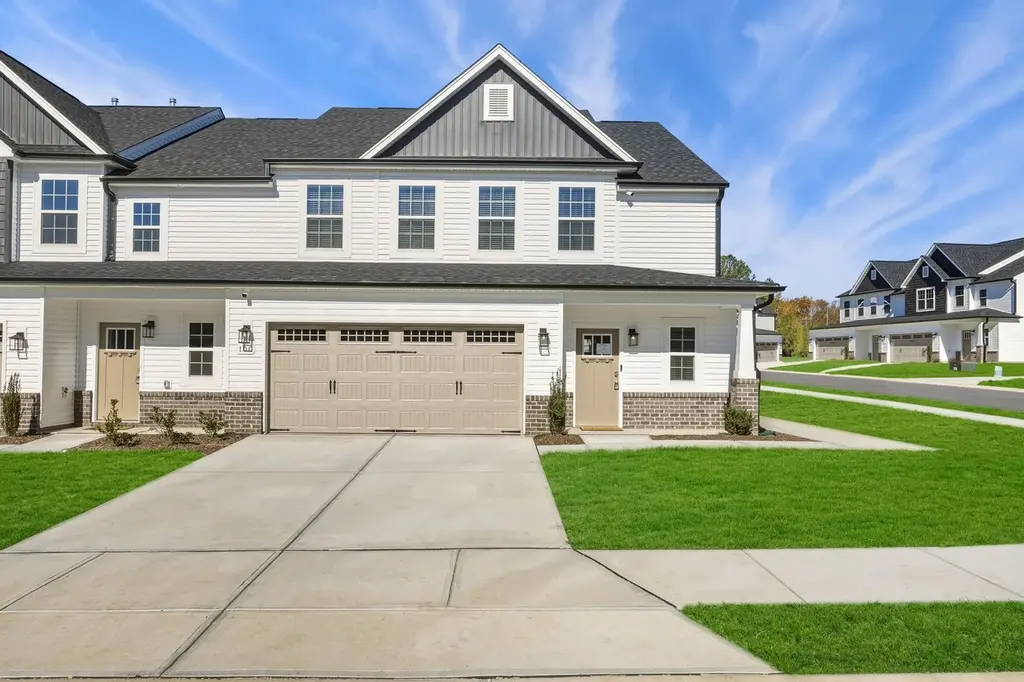
Introducing the Columbus at Townes at Spangler Oaks, a townhome community with easy access to commuter routes, shopping, and dining. This Columbus spans two levels with a main-level primary suite that sits apart from the rest of the home, giving the space a sense of separation that carries through the whole layout. The open-concept main floor connects the kitchen and dining area to the great room, with direct access to the covered porch extending the living space outward. Upstairs, two additional bedrooms share a secondary bath, rounding out roughly 2,550 square feet with three bedrooms, two full baths, a powder room, and a two-car garage. The primary suite on the main level means the upper
Key facts
- Primary suite
- Private patio
- Walk in closets
Tags
Property features AI
Finance
- Other: Address: 4728 Winding Trl, Greensboro NC 27410; Listing status: Active; Listing modified May 29, 2026
- Financial info: List price $378,550
Exterior
- Parking: 2 total parking spaces; 2-car garage
- Home design: Single-family property; Built as The Columbus plan
- Exterior features: Living area approximately 2,504
Interior
- Bedrooms: 4 bedrooms
- Bathrooms: 2 full bathrooms; 1 half bathroom (2.5 total)
- Interior features: Spec home (The Columbus plan); Active listing
Neighborhood map
What this means for you Summary
Snapshot
- This is a 4-bed/2.5-bath townhouse listed at $370k. Condition is rated excellent.
Deal economics
- At list price, monthly cash flow is $-90 ($-1k/yr) — negative.
- To cash-flow at today's rent, offer at most $357k (3.5% below list).
- To meet the 1% rule (rent ≥ 1% of price), the offer needs to be $312k (15.6% below list).
- Recommended offer: $312k (15.6% below list) — sets the bar for 1% rule.
- Cap rate 6.0% vs local median 3.7% in Greensboro — top-decile yield for the area; either an underpriced asset or a hidden risk that comps aren't pricing in. Stress-test before assuming the spread holds.
Location & tenants
- Location reads 81/100 on livability (#12 in NC, #1,335 nationally) — a professional / high-income tenant draw. Strengths: amenities A+, commute A+, cost of living A+; Watch: employment D, crime F.
- Guilford County Schools (urban): math 39% / reading 45% proficiency, ranked #99 of 178 in NC (top 56%) — families likely to look elsewhere, expect single-tenant / working-renter base with shorter leases.
- Zoned schools: Ep Pearce Elementary (math 80% / reading 79%, grade A, #24 of 1,410 statewide, top 2%, 667 students, 26% FRL); Kernodle Middle (math 62% / reading 60%, grade B+, #40 of 475 statewide, top 9%, 745 students, 40% FRL); Northwest Guilford High (math 72% / reading 64%, grade B, #137 of 535 statewide, top 26%, 1,991 students, 18% FRL) — zoned schools average 28% FRL vs 52% district-wide (24 pts lower); this property's tenant base skews higher-income than the district average.
- Zoned-school proficiency averages 70% at this address vs 42% district-wide (+28 pts) — the actual schools serving this property are materially stronger than the Guilford County Schools average implies; a family-tenant draw the district grade alone would hide.
- Market conditions: Rents rising fast (+5.6%/yr); 336 active listings in the ZIP; 4 comparable units currently listed for rent nearby; rentals at typical pace (median 25d on market — plan ~3-4 weeks tenant-placement turnaround); solid renter incomes; 3,843 units permitted in Guilford County in 2024 (2,397 in 5+ unit buildings).
- This rent runs 44% of the median local income ($85k/yr) — at the standard rent-burdened threshold; future hikes will face affordability resistance.
Forward outlook
- Local home prices are declining (-3.0%/yr); year-one equity from $3k of loan paydown is wiped out by about $11k of value loss. Plan a longer hold.
- Guilford County population projected at +26% by 2050 — long-run rental-demand tailwind backs the buy-and-hold thesis.
Negotiation context
- It's been on market 23 days — a 2% lower offer ($364k) is reasonable based on typical stale-listing flexibility.
Risks & watch-outs
- Climate carrying-cost: extreme-heat days projected 7→18/yr by 2055 (HVAC capex compounding) — expect insurance premiums to compound above CPI over the hold.
Questions for the listing agent
- What do current leases actually rent for vs. the listed asking? Can we see a recent rent roll and the last 12 months of T-12 income?
- Is there a deadline driving the sale (1031 exchange, divorce, estate, relocation)? That informs how much negotiation room exists.
- Crime grade is F in this area — have there been break-ins, vandalism, or insurance claims at this property in the last 3 years? What carrier currently insures it and at what premium?
- The area grade is low — what's the realistic commute time and amenity access for the typical tenant pool here? Any planned neighborhood developments (good or bad) we should know about?
- What's the average days-on-market for RENTAL listings here right now (not sales)? A rising rental-DOM trend means longer vacancies and softer asking-rent achievability than the comps imply.
- What's the recent tenant-quality profile in this submarket — average credit score on applications, eviction rate, late-payment / NSF rate, and stable-employment percentage? A property-management company in the area should have these aggregated.
- How much new for-sale + rental construction is in the pipeline within 1–3 miles? Heavy new supply typically softens prices + rents 12–24 months out; constrained supply supports both.
Investment metrics
- 1% rule
- 0.84% ✗
- Cap rate
- 6.00%
- Cash-on-cash
- -1.05%
- DSCR
- 0.95
- GRM
- 9.9
CMA / ARV
No comps found within radius.
Projected returns pro-forma
-3.0% appreciation · 5.57% rent growth · sell at horizon
- IRR
- -15.2%
- Equity multiple
- 0.45×
- Total profit
- $-57,352
- Equity at exit
- $55,134
- IRR
- -2.8%
- Equity multiple
- 0.79×
- Total profit
- $-21,364
- Equity at exit
- $31,971
Cash invested: $103,536 (down + closing). Projections, not guarantees.
Landlord ↔ Tenant lean methodology
- Overall (STATE)
- 85 Strongly Landlord-Friendly
- State North Carolina
- 85 Strongly Landlord-Friendly · R+3
- County
- — inherits STATE
- City
- — inherits STATE
ZIP-level market 27410
- Rents YoY
- 5.6%
- Active inventory
- 336
- Price-to-rent
- 9.9×
Monthly cashflow live
- Estimated rent
- $3,120 medium interval (Pro) →
- Mortgage (P&I)
- −$1,939
- Tax est. 1.5%
- −$462 /mo · $5,547/yr
- Insurance
- −$154
- HOA
- −$0
- Vacancy / Maint / Mgmt
- −$655
- Net cashflow
- $-90
Break-even live
Sensitivity live
| Price | -10% $165 | -5% $37 | +0% $-90 | +5% $-218 | +10% $-346 |
|---|---|---|---|---|---|
| Rent | -10% $-337 | -5% $-214 | +0% $-90 | +5% $33 | +10% $156 |
| Rate | -1.0pp $96 | -0.5pp $4 | base $-90 | +0.5pp $-186 | +1.0pp $-284 |
UW: 25.0% down · 7.5% · 30yr · 1.5% tax · 5.0% vac · 8.0% maint · 8.0% mgmt
Financing live
Cash to close
- Down payment
- $92,442
- Closing costs
- $11,093
- Reserves months
- —
- Total cash needed
- —
Loan-product check · same deal, 3 products live
Conventional
25% down · 7.5% · 30yr
- Down + closing
- —
- Monthly P&I
- —
- Monthly cashflow
- —
- DSCR
- —
- Eligible?
- —
Personal DTI + credit; lowest rate.
DSCR
20% down · 8.5% · 30yr
- Down + closing
- —
- Monthly P&I
- —
- Monthly cashflow
- —
- DSCR
- —
- Eligible?
- —
No personal income docs; deal must DSCR.
Hard money
10% down · 12.0% · 12mo
- Down + closing
- —
- Monthly P&I
- —
- Monthly cashflow
- —
- DSCR
- —
- Eligible?
- —
Short-term bridge; refi at stabilization.
Rent comps 4 comps
| Address | Beds | Baths | Sqft | Rent | $/sqft | DOM | Units | Dist |
|---|---|---|---|---|---|---|---|---|
| 5510 Faye Dr Greensboro, NC | 4.0 | 3.5 | 2674 | $4,500 | $1.68 | 16d | 1 | 0.45mi |
| 4808 Pine Glen Ct Greensboro, NC | 4.0 | 2.5 | 2319 | $2,450 | $1.06 | 23d | 1 | 0.79mi |
| 4807 Jessup Grove Rd Greensboro, NC | 4.0 | 3.0 | 1860 | $2,065 | $1.11 | 25d | 1 | 1.33mi |
| 4210 Shoal Creek Dr Greensboro, NC | 5.0 | 2.5 | 2695 | $3,300 | $1.22 | 25d | 1 | 1.42mi |
Listing history 16 events
-
2026-06-22days on market $369,770 Active 23 DOM
-
2026-06-18days on market $369,770 Active 20 DOM
-
2026-06-17days on market $369,770 Active 19 DOM
-
2026-06-16days on market $369,770 Active 18 DOM
-
2026-06-15days on market $369,770 Active 17 DOM
-
2026-06-14days on market $369,770 Active 15 DOM
-
2026-06-10pricedays on market $369,770 Active 12 DOM
-
2026-06-09days on market $381,550 Active 11 DOM
-
2026-06-08days on market $381,550 Active 10 DOM
-
2026-06-07pricedays on market $381,550 Active 9 DOM
-
2026-06-03days on market $378,550 Active 5 DOM
-
2026-06-02days on market $378,550 Active 4 DOM
-
2026-06-01days on market $378,550 Active 3 DOM
-
2026-05-31days on market $378,550 Active 2 DOM
-
2026-05-31remarks 699-char remark
-
2026-05-31$378,550 Active 1 DOM
ⓘ Source: listings_history table (triggers on properties + properties_extension) + one-shot
backfill from property_details.listing_events for pre-trigger history.
Climate risk First Street
- Flood 1/10 Low FEMA zone X (unshaded) · 0% chance over 30 yrs
- Wildfire 2/10 Low
- Heat 5/10 Major 7 d/yr ≥102°F today · 18 d/yr by 30 yrs out
- Wind 4/10 Moderate 12% chance of damaging wind over 30 yrs
- Air quality 2/10 Low 1 unhealthy d/yr today · 2 by 30 yrs out
Nearby sold comps map
Loading sold comps map…
Walkable amenities ~0.75 mi
Loading nearby amenities…
Taxation est. · year 1
- Rental income
- $37,443
- − Mortgage interest
- −$20,713
- − Property taxes
- −$5,547
- − Insurance
- −$1,849
- − Repairs & maintenance
- −$2,995
- − Management
- −$2,995
- − Depreciation
- −$10,757
- Taxable loss
- −$7,413
- Est. tax savings @ 24.0%
- +$1,779
- After-tax cash flow
- $695/yr
For passive investors: Depreciation is non-cash, so a rental often shows a tax loss while cash-flowing — sheltering income. Rental losses are passive: they offset passive income freely, and up to $25,000/yr can offset ordinary (W-2) income if you actively participate and your MAGI is under $100k (phasing out to $0 by $150k); unused losses carry forward. On sale, claimed depreciation is recaptured at up to 25%, and gains may owe capital-gains tax (a 1031 exchange can defer both). Figures are a year-1 estimate at your 24.0% rate — not tax advice; consult a CPA.
Condition & rehab AI · 13 photos
This move-in-ready townhouse in a desirable neighborhood offers a pristine condition with no visible repairs needed. Key updates to enhance its value include fresh painting and landscaping.
Value-add opportunities
- Both Painting exterior and interior walls — Fresh paint enhances curb appeal and interior aesthetics
- Both Landscaping and curb appeal improvements — Well-maintained landscaping increases curb appeal and property value
- Both HVAC maintenance — Regular maintenance ensures efficient operation and extends system life
Renovation cost estimate screening
Value-add ROI direction
- Both Painting exterior and interior walls — Fresh paint enhances curb appeal and interior aesthetics ↑
- Both Landscaping and curb appeal improvements — Well-maintained landscaping increases curb appeal and property value ↑
- Both HVAC maintenance — Regular maintenance ensures efficient operation and extends system life ↑
ⓘ Cost ranges are severity-bucket heuristics (US national rule-of-thumb). Get contractor quotes + a written scope before underwriting a rehab budget.
Schools (NCES district)
- District
- Guilford County Schools
- NCES district ID
- 3701920
- Math proficiency
- 39% ▲ 1.00%
- Reading proficiency
- 45% ▲ 1.00%
- Median HH income
- $46,315
- Composite
- 35.78/100
- National rank
- #4842
- State rank
- #99 of 178 in NC
Livability — Greensboro
- Score
- 81/100
- State rank
- #12
- US rank
- #1335
Category grades
Schools grade is shown separately in the Schools card above.
Census & demographics
- Census place
- Greensboro, NC
- County
- Guilford County · 487,190 people
- City population
- 329,421
- Metro
- Greensboro-High Point, NC
- Population (ZIP)
- 54,921
- Household income
- $85,291
- Rent vs Own
- Severe rent burden
- 2696.0
Population outlook (Guilford County) Hauer SSP2
- Today (2025)
- 584,596 people
- By 2030
- 616,851 · +5.5%
- By 2040
- 678,451 · +16.1%
- By 2050
- 734,788 · +25.7%
- By 2075
- 862,985 · +47.6%
- By 2100
- 948,704 · +62.3%
Race, ethnicity, and origin ACS 2023
- Neighborhood character
- Predominantly White (68%)
- Race & ethnicity
- White 68% Black 15% Two or more races 8% Hispanic / Latino 7% Asian 5%
- Hispanic origin (detail)
- Mexican 2% Puerto Rican 2%
- Common ancestry
- Italian 3% Serbian 3% Slovak 3%
- Foreign-born
- 11% · Canada, South Korea, China
- Languages at home
- 86% English-only · Spanish 4% Other Indo-European 3% Other Asian/Pacific 1%
Political lean MEDSL · Guilford
- 2024 margin
- Strong D (+21.8) · D 60.2% · R 38.4% · Other 1.4%
- 2008→2024 swing
- +3.5pp toward D · 2008: 18.4pp · 2024: 21.8pp
- All cycles
- 2024: D+21.8 2020: D+23.1 2016: D+20.0 2012: D+16.5 2008: D+18.4
Not yet ingested
- Civics
- —
Market trends
- HPI YoY
- ▼ -245.81%
- Current HPI
- 222.1685
- Rent YoY
- ▲ 5.57%
- Metro
- Greensboro-High Point, NC
- State GDP YoY
- ▲ 3.28%
- F500 in state
- 26
Industry mix (Fortune 500 HQ in NC)
| Industry | F500 HQs | Revenue |
|---|---|---|
| Financial Services | 2 | $213B |
|
||
| Retail | 2 | $95B |
|
||
| Industrial Conglomerate | 1 | $38B |
|
||
| Metals / Steel | 1 | $35B |
|
||
| Utilities | 1 | $30B |
|
||
| Industrial Machinery | 1 | $19B |
|
||
Cash-flow waterfall
monthlySold comps — $/sqft
last 12 mo · ≤1 miLoading sold comps…