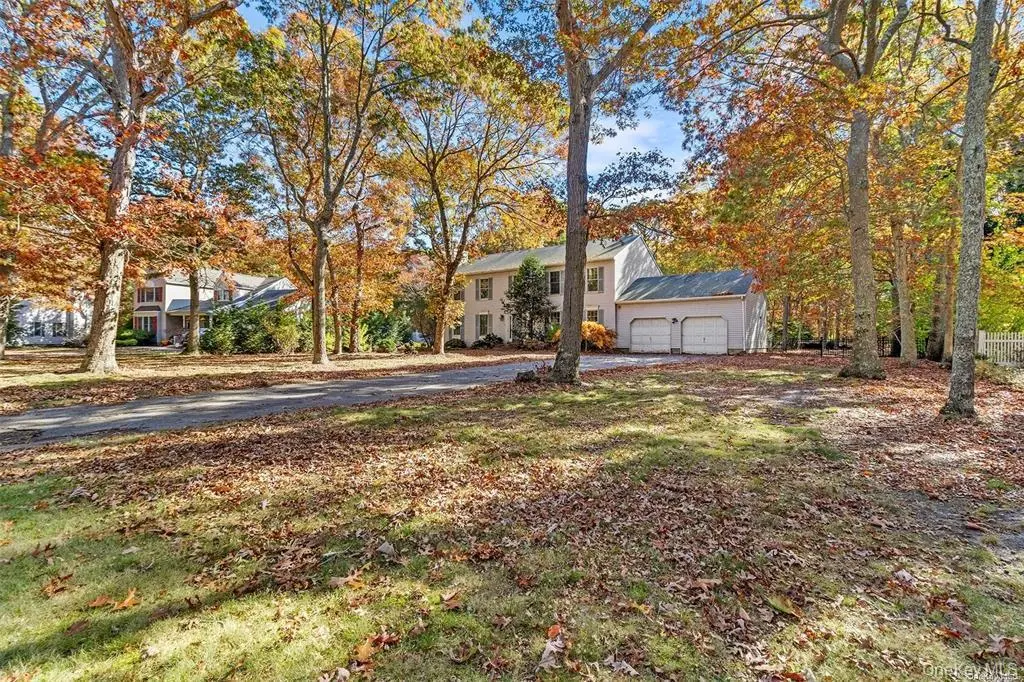
34 Andys Ln · Remsenburg-Speonk, NY
Flood risk 1/10 · Minimal
- FEMA flood zone
- X (unshaded)
- Chance of flooding over 30 yrs
- 0.0%
- Est. flood insurance / yr
- $473 – $860
Fire risk 1/10 · Minimal
- Est. fire insurance / yr
- $691 – $1,283
Heat risk 4/10 · Minor
- Hot days now (above 91°F)
- 7 days/yr
- Hot days in 30 yrs
- 18 days/yr
Wind risk 8/10 · Major
- Chance of severe wind over 30 yrs
- 80.0%
Air-quality risk 4/10 · Minor
- Unhealthy air days now
- 4 days/yr
- Unhealthy air days in 30 yrs
- 5 days/yr
Risk factors via First Street. Map © Google.
Why this score? — see what drove the A- grade
The composite is a weighted blend of 9 inputs, each scored 0–100. Each bar is that input's sub-score; the figure is the points it added to the 100-point composite (weight × sub-score).
- Cash flow +30.0/30.0
- ARV discount +12.8/15.0
- 1% rule +10.0/10.0
- DSCR +10.0/10.0
- Appreciation +8.0/10.0
- Schools +6.0/10.0
- Rent growth +2.5/5.0
- Livability +2.5/5.0
- Condition / age +2.5/5.0
$799,000
🖨 Deal sheet 📄 Offer letter ✓ Due diligence
Listing remarks
Colonial situated on a three-quarter acre in the Longtree Pond community. This residence offers 4 bedrooms and 2.5 bathrooms, including a primary suite with a full bath. The home features an eat-in kitchen, formal living and dining rooms, and a family room ideal for everyday living and entertaining. Additional features include a full basement with bilco doors, an attached two-car garage and a backyard with an in-ground pool.
Key facts
- Formal dining room
- Family room
- Three-quarter acre
Tags
Property features AI
Exterior
- Parking: Attached garage; Driveway; 2-car garage
- Utilities: Cesspool sewer; Utilities: See remarks
- Home design: Single family residence
- Construction: Vinyl siding construction
- Exterior features: Vinyl siding; Back yard fencing; Private in-ground pool; Not waterfront
Interior
- Kitchen: Electric range; Dishwasher
- Bathrooms: Two full bathrooms; One half bathroom
- Heating & cooling: Forced air heating (oil); Central air conditioning
- Interior features: Eat-in kitchen; Entrance foyer; Formal dining room; Primary bathroom; Washer/dryer hookup; Basement access with Bilco doors; Full basement; 8 total rooms; One fireplace
- Laundry & utility: Washer hookup; Dryer
Neighborhood map
What this means for you Summary
Snapshot
- This is a 4-bed/2.0-bath single-family listed at $799k.
Deal economics
- At list price, monthly cash flow is $6k ($74k/yr) — positive.
- The deal already cash-flows at list — no discount required.
- Meets the 1% rule at list price ($15k rent vs $799k).
- Recommended offer: $751k (6.0% below list) — sets the bar for market timing.
- Cap rate 15.6% vs local median 7.2% in Remsenburg-Speonk — top-decile yield for the area; either an underpriced asset or a hidden risk that comps aren't pricing in. Stress-test before assuming the spread holds.
Location & tenants
- Location reads: area grade A — affects rentability + tenant quality, not the cash-flow math above.
- Eastport-South Manor CSD (suburban): math 62% / reading 69% proficiency, ranked #147 of 590 in NY (top 25%) — acceptable for families but not a draw, mixed tenant base, ~2y average lease; only 11% free/reduced lunch — higher-income household profile.
- Zoned schools: Tuttle Avenue School (215 students, 0% FRL); Eastport-South Manor Junior Senior High School (math 68% / reading 61%, grade B-, #776 of 1,100 statewide, top 73%, 1,530 students, 20% FRL) — zoned schools at 10% FRL track the district average.
- Market conditions: 23 active listings in the ZIP; 1 comparable units currently listed for rent nearby; 1,366 units permitted in Suffolk County in 2024 (216 in 5+ unit buildings).
Forward outlook
- In year one you build about $53k of equity ($6k loan paydown + $48k appreciation (6.0% local appreciation)).
- Suffolk County population projected to shrink 5% by 2050 — rents likely to lag national; underwrite the cash flow, not the appreciation.
- At projected returns (6.0% appreciation + 3.0% rent growth), your $224k cash investment doubles in ~2 years — after that, you're playing with house money.
- By year 2, paydown + projected appreciation supports a ~$85k cash-out refi (75% LTV) — recoverable capital for the next deal without selling this one.
Negotiation context
- It's been on market 72 days — a 6% lower offer ($751k) is reasonable based on typical stale-listing flexibility.
- 3 sale attempts since 2y ago with the ask held roughly flat each time — persistent listings suggest the price (not the market) is what's stuck; bring a comps-based counter.
- Current owner paid $650k; 23% above their basis — modest negotiation headroom, anchor on the comps not their cost.
Risks & watch-outs
- Climate carrying-cost: severe wind risk, 80% chance of damaging wind over 30y — expect insurance premiums to compound above CPI over the hold.
Questions for the listing agent
- It's been on market 72 days. Have you received any prior offers? Is the seller open to a 6% concession, seller financing, or rate buy-down credit?
- Why hasn't it sold? Are there any deal-killer items the seller is aware of (foundation, flood, title, zoning, code violations)?
- Is there a deadline driving the sale (1031 exchange, divorce, estate, relocation)? That informs how much negotiation room exists.
- What's the average days-on-market for RENTAL listings here right now (not sales)? A rising rental-DOM trend means longer vacancies and softer asking-rent achievability than the comps imply.
- What's the recent tenant-quality profile in this submarket — average credit score on applications, eviction rate, late-payment / NSF rate, and stable-employment percentage? A property-management company in the area should have these aggregated.
- How much new for-sale + rental construction is in the pipeline within 1–3 miles? Heavy new supply typically softens prices + rents 12–24 months out; constrained supply supports both.
Investment metrics
- 1% rule
- 1.88% ✓
- Cap rate
- 15.61%
- Cash-on-cash
- 33.28%
- DSCR
- 2.48
- GRM
- 4.4
CMA / ARV
- ARV (on-the-fly)
- $906,048
- Comps found
- 7
Show comp detail 7 sales within ~0.75 mi
| Address | Dist | Beds/Ba | Sqft | Sold | Price | $/sf | Match |
|---|---|---|---|---|---|---|---|
| 45 Drew Dr | 0.11mi | 4/2.5 | 2,747 (+10%) | 3mo | $780,000 | $284 | 74 |
| 91 Drew Dr | 0.16mi | 4/2.5 | 2,678 (+7%) | 6mo | $870,000 | $325 | 73 |
| 8 Drew Dr | 0.38mi | 4/2.5 | 2,600 (+4%) | 17mo | $950,000 | $365 | 59 |
| 22 Howell Pl | 0.42mi | 4/3.0 | 2,300 (-8%) | 6mo | $835,000 | $363 | 58 |
| 16 Clay Pit Rd | 0.36mi | 3/2.5 (-1) | 2,300 (-8%) | 11mo | $1,158,000 | $503 | 54 |
| 11 Sherri Ct | 0.20mi | 5/3.5 (+1) | 2,800 (+12%) | 10mo | $825,000 | $295 | 51 |
| 186 S Country Rd | 0.43mi | 3/4.0 (-1) | 2,404 (-4%) | 15mo | $1,815,000 | $755 | 48 |
Match score weights: distance 35% · size 25% · config 20% · recency 20%. Top-matched comps best support the ARV.
Projected returns pro-forma
5.98% appreciation · 3.0% rent growth · sell at horizon
- IRR
- 43.7%
- Equity multiple
- 3.80×
- Total profit
- $625,352
- Equity at exit
- $501,385
- IRR
- 40.8%
- Equity multiple
- 7.84×
- Total profit
- $1,530,792
- Equity at exit
- $908,462
Cash invested: $223,720 (down + closing). Projections, not guarantees.
Landlord ↔ Tenant lean methodology
- Overall (STATE)
- 15 Strongly Tenant-Friendly
- State New York
- 15 Strongly Tenant-Friendly · D+10
- County
- — inherits STATE
- City
- — inherits STATE
ZIP-level market 11941
- Home prices YoY
- 1.9%
- Active inventory
- 23
- Price-to-rent
- 4.4×
Monthly cashflow live
- Estimated rent
- $15,000 medium interval (Pro) →
- Mortgage (P&I)
- −$4,190
- Tax from tax record
- −$1,122 /mo · $13,463/yr
- Insurance
- −$333
- HOA
- −$0
- Vacancy / Maint / Mgmt
- −$3,150
- Net cashflow
- $6,205
Break-even live
UW: 25.0% down · 7.5% · 30yr · 1.5% tax · 5.0% vac · 8.0% maint · 8.0% mgmt
Financing live
Cash to close
- Down payment
- $199,750
- Closing costs
- $23,970
- Reserves months
- —
- Total cash needed
- —
Loan-product check · same deal, 3 products live
Conventional
25% down · 7.5% · 30yr
- Down + closing
- —
- Monthly P&I
- —
- Monthly cashflow
- —
- DSCR
- —
- Eligible?
- —
Personal DTI + credit; lowest rate.
DSCR
20% down · 8.5% · 30yr
- Down + closing
- —
- Monthly P&I
- —
- Monthly cashflow
- —
- DSCR
- —
- Eligible?
- —
No personal income docs; deal must DSCR.
Hard money
10% down · 12.0% · 12mo
- Down + closing
- —
- Monthly P&I
- —
- Monthly cashflow
- —
- DSCR
- —
- Eligible?
- —
Short-term bridge; refi at stabilization.
Rent comps 1 comps
| Address | Beds | Baths | Sqft | Rent | $/sqft | DOM | Units | Dist |
|---|---|---|---|---|---|---|---|---|
| 134A Montauk Hwy Westhampton, NY | 4.0 | 3.5 | 2478 | $15,000 | $6.05 | 1d | 1 | 1.42mi |
Listing history 7 events
-
2026-04-30status Pending
-
2026-04-10status Active
-
2026-02-27status Pending
-
2026-01-07$799,000 Active
-
2025-02-04historical
-
2024-10-25$799,000 Active
-
2006-09-22soldstatus $650,000
ⓘ Source: listings_history table (triggers on properties + properties_extension) + one-shot
backfill from property_details.listing_events for pre-trigger history.
Tax reassessment forecast NY · Partial reset (capped growth)
- Current annual tax
- $13,463 · $1,122/mo
- Projected year-2 tax
- $13,483 · $1,124/mo
- Expected delta
- +$20/yr (+$2/mo · 0.1%)
ⓘ Screening estimate from a state-policy table — verify with the county assessor before closing.
Climate risk First Street
- Flood 1/10 Low FEMA zone X (unshaded) · 0% chance over 30 yrs
- Wildfire 1/10 Low
- Heat 4/10 Moderate 7 d/yr ≥91°F today · 18 d/yr by 30 yrs out
- Wind 8/10 Severe 80% chance of damaging wind over 30 yrs
- Air quality 4/10 Moderate 4 unhealthy d/yr today · 5 by 30 yrs out
Nearby sold comps map
Loading sold comps map…
Walkable amenities ~0.75 mi
Loading nearby amenities…
Taxation est. · year 1
- Rental income
- $180,000
- − Mortgage interest
- −$44,756
- − Property taxes
- −$13,463
- − Insurance
- −$3,995
- − Repairs & maintenance
- −$14,400
- − Management
- −$14,400
- − Depreciation
- −$23,244
- Taxable income
- $65,742
- Est. tax owed @ 24.0%
- −$15,778
- After-tax cash flow
- $58,683/yr
For passive investors: Depreciation is non-cash, so a rental often shows a tax loss while cash-flowing — sheltering income. Rental losses are passive: they offset passive income freely, and up to $25,000/yr can offset ordinary (W-2) income if you actively participate and your MAGI is under $100k (phasing out to $0 by $150k); unused losses carry forward. On sale, claimed depreciation is recaptured at up to 25%, and gains may owe capital-gains tax (a 1031 exchange can defer both). Figures are a year-1 estimate at your 24.0% rate — not tax advice; consult a CPA.
Schools (NCES district)
- District
- Eastport-South Manor CSD
- NCES district ID
- 3600125
- Math proficiency
- 62% ▼ -1.00%
- Reading proficiency
- 69% ▲ 3.00%
- Median HH income
- $91,204
- Composite
- 59.55/100
- National rank
- #918
- State rank
- #147 of 590 in NY
Livability — Remsenburg-Speonk
No livability data for this city. (Only ~50 U.S. cities are tracked.)
Census & demographics
- Census place
- Remsenburg-Speonk, NY
- City population
- 1,346
- Population (ZIP)
- 2,472
Population outlook (Suffolk County) Hauer SSP2
- Today (2025)
- 1,505,262 people
- By 2030
- 1,498,318 · -0.5%
- By 2040
- 1,471,101 · -2.3%
- By 2050
- 1,424,848 · -5.3%
- By 2075
- 1,337,157 · -11.2%
- By 2100
- 1,217,720 · -19.1%
Race, ethnicity, and origin ACS 2023
- Neighborhood character
- Predominantly White (68%)
- Race & ethnicity
- White 68% Hispanic / Latino 23% Two or more races 22% Black 3% Asian 1%
- Hispanic origin (detail)
- Mexican 7% Dominican 1%
- Common ancestry
- Romanian 6% Danish 3% Lithuanian 3%
- Foreign-born
- 15% · Canada, Jamaica
- Languages at home
- 81% English-only · Spanish 17% Other Indo-European 1% French/Haitian/Cajun 1%
Political lean MEDSL · Suffolk
- 2024 margin
- Lean R (+10.0) · D 45.0% · R 55.0%
- 2008→2024 swing
- -16.0pp toward R · 2008: 6.0pp · 2024: -10.0pp
- All cycles
- 2024: R+10.0 2020: R+0.0 2016: R+8.2 2012: D+2.9 2008: D+6.0
Not yet ingested
- Civics
- —
Market trends
- HPI YoY
- ▲ 5.98%
- Current HPI
- 327.173
- Rent YoY
- —
- Metro
- —
- State GDP YoY
- ▲ 2.60%
- F500 in state
- 92
Industry mix (Fortune 500 HQ in NY)
| Industry | F500 HQs | Revenue |
|---|---|---|
| Financial Services | 10 | $950B |
|
||
| Consumer Goods | 9 | $162B |
|
||
| Insurance | 4 | $225B |
|
||
| Telecommunications | 2 | $144B |
|
||
| Pharmaceuticals | 2 | $112B |
|
||
| Media / Entertainment | 2 | $69B |
|
||
Price history
+22.9% since first listed7 events — show timeline
- 2026-04-30 Pending — OneKey® MLS as Distributed by MLS Grid
- 2026-04-10 Relisted — OneKey® MLS as Distributed by MLS Grid
- 2026-02-27 Pending — OneKey® MLS as Distributed by MLS Grid
- 2026-01-07 Listed $799,000 OneKey® MLS as Distributed by MLS Grid
- 2025-02-04 Listing Removed — OneKey® MLS as Distributed by MLS Grid
- 2024-10-25 Listed $799,000 OneKey® MLS as Distributed by MLS Grid
- 2006-09-22 Sold (Public Records) $650,000 Public Records
Property tax history
+2.3%/yrLatest (2022): $13,463 · +0.0% YoY. Source: county tax records.
Cash-flow waterfall
monthlySold comps — $/sqft
last 12 mo · ≤1 miLoading sold comps…