1112 Vincent St · Vinton, LA
Flood risk 3/10 · Minor
- FEMA flood zone
- X (unshaded)
- Chance of flooding over 30 yrs
- 0.2%
- Est. flood insurance / yr
- $507 – $1,088
Fire risk 3/10 · Minor
- Est. fire insurance / yr
- $1,269 – $2,357
Heat risk 9/10 · Severe
- Hot days now (above 109°F)
- 7 days/yr
- Hot days in 30 yrs
- 23 days/yr
Wind risk 9/10 · Severe
- Chance of severe wind over 30 yrs
- 99.0%
Air-quality risk 2/10 · Minimal
- Unhealthy air days now
- 1 days/yr
- Unhealthy air days in 30 yrs
- 1 days/yr
Risk factors via First Street. Map © Google.
Why this score? — see what drove the D+ grade
The composite is a weighted blend of 9 inputs, each scored 0–100. Each bar is that input's sub-score; the figure is the points it added to the 100-point composite (weight × sub-score).
- Cash flow +14.9/30.0
- ARV discount +7.5/15.0
- Appreciation +6.1/10.0
- DSCR +4.5/10.0
- 1% rule +3.5/10.0
- Livability +3.2/5.0
- Schools +3.1/10.0
- Rent growth +2.5/5.0
- Condition / age +2.5/5.0
$137,500
🖨 Deal sheet 📄 Offer letter ✓ Due diligence
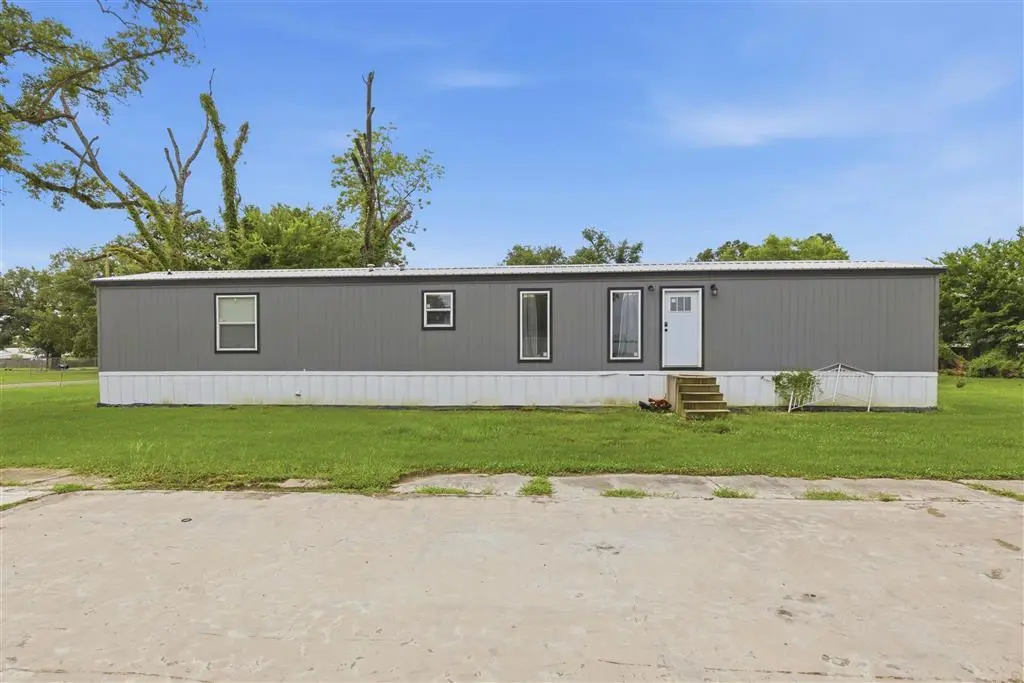
Listing remarks
WELCOME HOME to this delightful 2024 manufactured home situated on a 0.23-acre lot! This well maintained 3 bedroom, 2 bath home offers an inviting open concept living and dining area, perfect for everyday living and entertaining. Matching laminate flooring flows throughout the home for a clean, modern look. The kitchen features ample cabinet space, an island, electric appliances, microwave, and breakfast bar. The spacious primary suite (10.5x14.5) offers a walk-in closet, dual sinks, a relaxing garden tub, and separate shower. Conveniently located off the hallway are a full bathroom and utility room. The additional bedrooms include a generously sized second bedroom (11x8.6) with closet and
Key facts
- Dual sinks
- Open concept living
- Walk-in closet
Tags
Property features AI
Exterior
- Utilities: Public water; Public sewer; Sewer connected; Water connected; Cable available
- Home design: Manufactured home on land; Single-story
- Construction: Manufactured house construction
- Exterior features: Metal roof; City lot; Level lot
Interior
- Bathrooms: 2 full bathrooms
- Heating & cooling: Central heating; Central air conditioning; Ceiling fans for cooling
- Interior features: Ceiling fans throughout; Kitchen island
Neighborhood map
What this means for you Summary
Snapshot
- This is a 3-bed/2.0-bath manufactured listed at $138k.
Deal economics
- At list price, monthly cash flow is $39 ($470/yr) — positive.
- The deal already cash-flows at list — no discount required.
- To meet the 1% rule (rent ≥ 1% of price), the offer needs to be $116k (15.3% below list).
- Recommended offer: $116k (15.3% below list) — sets the bar for 1% rule.
Location & tenants
- Location reads 64/100 on livability (#173 in LA) — a middle-class / working-renter tenant base. Strengths: cost of living A+, housing A+, health & safety A+; Watch: employment C-, crime F, amenities F.
- Calcasieu Parish (other): math 30% / reading 44% proficiency, ranked #29 of 98 in LA (top 30%) — families likely to look elsewhere, expect single-tenant / working-renter base with shorter leases.
- Zoned schools: Vinton Elementary School (math 27% / reading 42%, grade F, #284 of 646 statewide, top 46%, 458 students, 72% FRL); Vinton Middle School (math 20% / reading 32%, grade F, #137 of 218 statewide, top 63%, 214 students, 68% FRL); Vinton High School (math 32% / reading 37%, grade F, #106 of 265 statewide, top 43%, 301 students, 62% FRL) — zoned schools average 68% FRL vs 52% district-wide (15 pts higher); higher-poverty schools than district average — tighter screening recommended.
- Market conditions: 49 active listings in the ZIP; 3 comparable units currently listed for rent nearby; rentals lingering (median 44d on market — plan ~5-8 weeks vacancy on turnover, expect pricing pressure); 100% of comp listings sitting > 30 days — soft ceiling on asking rent; 1,298 units permitted in Calcasieu Parish in 2024 (526 in 5+ unit buildings).
Forward outlook
- In year one you build about $4k of equity ($951 loan paydown + $3k appreciation (2.3% local appreciation)).
- Calcasieu County population projected at +11% by 2050 — modest demand growth; plan on rents tracking national, not racing it.
- At projected returns (2.3% appreciation + 3.0% rent growth), your $38k cash investment doubles in ~7 years — after that, you're playing with house money.
- By year 8, paydown + projected appreciation supports a ~$30k cash-out refi (75% LTV) — recoverable capital for the next deal without selling this one.
Negotiation context
- Only 6 days on market — expect competitive offers; lowballing is unlikely to land.
- 2 sale attempts since 2y ago with the ask held roughly flat each time — persistent listings suggest the price (not the market) is what's stuck; bring a comps-based counter.
Risks & watch-outs
- Climate carrying-cost: severe wind risk, 99% chance of damaging wind over 30y; extreme-heat days projected 7→23/yr by 2055 (HVAC capex compounding) — expect insurance premiums to compound above CPI over the hold.
Questions for the listing agent
- Is there a deadline driving the sale (1031 exchange, divorce, estate, relocation)? That informs how much negotiation room exists.
- Schools are B-rated — typically a magnet for longer-tenancy family renters. What's the average tenant stay here, and is there a school-zone premium baked into asking?
- Crime grade is F in this area — have there been break-ins, vandalism, or insurance claims at this property in the last 3 years? What carrier currently insures it and at what premium?
- The area grade is low — what's the realistic commute time and amenity access for the typical tenant pool here? Any planned neighborhood developments (good or bad) we should know about?
- What's the average days-on-market for RENTAL listings here right now (not sales)? A rising rental-DOM trend means longer vacancies and softer asking-rent achievability than the comps imply.
- What's the recent tenant-quality profile in this submarket — average credit score on applications, eviction rate, late-payment / NSF rate, and stable-employment percentage? A property-management company in the area should have these aggregated.
- How much new for-sale + rental construction is in the pipeline within 1–3 miles? Heavy new supply typically softens prices + rents 12–24 months out; constrained supply supports both.
Investment metrics
- 1% rule
- 0.85% ✗
- Cap rate
- 6.63%
- Cash-on-cash
- 1.22%
- DSCR
- 1.05
- GRM
- 9.8
CMA / ARV
No comps found within radius.
Projected returns pro-forma
2.26% appreciation · 3.0% rent growth · sell at horizon
- IRR
- 6.5%
- Equity multiple
- 1.36×
- Total profit
- $13,707
- Equity at exit
- $56,162
- IRR
- 9.7%
- Equity multiple
- 2.35×
- Total profit
- $52,117
- Equity at exit
- $82,382
Cash invested: $38,500 (down + closing). Projections, not guarantees.
Landlord ↔ Tenant lean methodology
- Overall (STATE)
- 90 Strongly Landlord-Friendly
- State Louisiana
- 90 Strongly Landlord-Friendly · R+12
- County
- — inherits STATE
- City
- — inherits STATE
ZIP-level market 70668
- Home prices YoY
- 3.1%
- Active inventory
- 49
- Price-to-rent
- 9.8×
Monthly cashflow live
- Estimated rent
- $1,164 medium interval (Pro) →
- Mortgage (P&I)
- −$721
- Tax from tax record
- −$102 /mo · $1,225/yr
- Insurance
- −$57
- HOA
- −$0
- Vacancy / Maint / Mgmt
- −$244
- Net cashflow
- $39
Break-even live
UW: 25.0% down · 7.5% · 30yr · 1.5% tax · 5.0% vac · 8.0% maint · 8.0% mgmt
Financing live
Cash to close
- Down payment
- $34,375
- Closing costs
- $4,125
- Reserves months
- —
- Total cash needed
- —
Loan-product check · same deal, 3 products live
Conventional
25% down · 7.5% · 30yr
- Down + closing
- —
- Monthly P&I
- —
- Monthly cashflow
- —
- DSCR
- —
- Eligible?
- —
Personal DTI + credit; lowest rate.
DSCR
20% down · 8.5% · 30yr
- Down + closing
- —
- Monthly P&I
- —
- Monthly cashflow
- —
- DSCR
- —
- Eligible?
- —
No personal income docs; deal must DSCR.
Hard money
10% down · 12.0% · 12mo
- Down + closing
- —
- Monthly P&I
- —
- Monthly cashflow
- —
- DSCR
- —
- Eligible?
- —
Short-term bridge; refi at stabilization.
Rent comps 3 comps
| Address | Beds | Baths | Sqft | Rent | $/sqft | DOM | Units | Dist |
|---|---|---|---|---|---|---|---|---|
| 1908 Center St Vinton, LA | 3.0 | 2.0 | 1280 | $1,200 | $0.94 | 43d | 1 | 0.24mi |
| 1914 Center St Vinton, LA | 3.0 | 2.0 | 1280 | $1,200 | $0.94 | 43d | 1 | 0.26mi |
| 708 East St Vinton, LA | 2.0 | 1.0 | 800 | $900 | $1.12 | 43d | 1 | 0.63mi |
Listing history 7 events
-
2026-06-19days on market $137,500 Active 6 DOM
-
2026-06-18days on market $137,500 Active 5 DOM
-
2026-06-17days on market $137,500 Active 4 DOM
-
2026-06-16days on market $137,500 Active 3 DOM
-
2026-06-15days on market $137,500 Active 2 DOM
-
2026-06-14remarks 699-char remark
-
2026-06-14$137,500 Active 1 DOM
ⓘ Source: listings_history table (triggers on properties + properties_extension) + one-shot
backfill from property_details.listing_events for pre-trigger history.
Tax reassessment forecast LA · Resets to sale price
- Current annual tax
- $1,225 · $102/mo
- Projected year-2 tax
- $1,225 · $102/mo
- Expected delta
- $0/yr ($0/mo · 0.0%)
ⓘ Screening estimate from a state-policy table — verify with the county assessor before closing.
Climate risk First Street
- Flood 3/10 Moderate FEMA zone X (unshaded) · 20% chance over 30 yrs
- Wildfire 3/10 Moderate
- Heat 9/10 Extreme 7 d/yr ≥109°F today · 23 d/yr by 30 yrs out
- Wind 9/10 Extreme 99% chance of damaging wind over 30 yrs
- Air quality 2/10 Low 1 unhealthy d/yr today · 1 by 30 yrs out
Nearby sold comps map
Loading sold comps map…
Walkable amenities ~0.75 mi
Loading nearby amenities…
Taxation est. · year 1
- Rental income
- $13,968
- − Mortgage interest
- −$7,702
- − Property taxes
- −$1,225
- − Insurance
- −$688
- − Repairs & maintenance
- −$1,117
- − Management
- −$1,117
- − Depreciation
- −$4,000
- Taxable loss
- −$1,881
- Est. tax savings @ 24.0%
- +$452
- After-tax cash flow
- $921/yr
For passive investors: Depreciation is non-cash, so a rental often shows a tax loss while cash-flowing — sheltering income. Rental losses are passive: they offset passive income freely, and up to $25,000/yr can offset ordinary (W-2) income if you actively participate and your MAGI is under $100k (phasing out to $0 by $150k); unused losses carry forward. On sale, claimed depreciation is recaptured at up to 25%, and gains may owe capital-gains tax (a 1031 exchange can defer both). Figures are a year-1 estimate at your 24.0% rate — not tax advice; consult a CPA.
Schools (NCES district)
- District
- Calcasieu Parish
- NCES district ID
- 2200330
- Math proficiency
- 30% ▼ -39.00%
- Reading proficiency
- 44% ▼ -33.00%
- Median HH income
- $44,700
- Composite
- 31.45/100
- National rank
- #5979
- State rank
- #29 of 98 in LA
Livability — Vinton
- Score
- 64/100
- State rank
- #173
- US rank
- #14337
Category grades
Schools grade is shown separately in the Schools card above.
Census & demographics
- Census place
- Vinton, LA
- Population (ZIP)
- 6,347
Population outlook (Calcasieu County) Hauer SSP2
- Today (2025)
- 212,179 people
- By 2030
- 218,199 · +2.8%
- By 2040
- 228,486 · +7.7%
- By 2050
- 236,208 · +11.3%
- By 2075
- 251,696 · +18.6%
- By 2100
- 247,848 · +16.8%
Race, ethnicity, and origin ACS 2023
- Neighborhood character
- Predominantly White (79%)
- Race & ethnicity
- White 79% Hispanic / Latino 13% Black 6% Two or more races 2%
- Hispanic origin (detail)
- Mexican 10%
- Common ancestry
- Lithuanian 7% Portuguese 2% Iranian 2%
- Foreign-born
- 1% · Canada
- Languages at home
- 92% English-only · Spanish 8%
Political lean MEDSL · Calcasieu
- 2024 margin
- Solid R (+39.6) · D 29.5% · R 69.0% · Other 1.5%
- 2008→2024 swing
- -15.0pp toward R · 2008: -24.6pp · 2024: -39.6pp
- All cycles
- 2024: R+39.6 2020: R+35.2 2016: R+33.3 2012: R+28.7 2008: R+24.6
Not yet ingested
- Civics
- —
Market trends
- HPI YoY
- ▲ 2.26%
- Current HPI
- 74.8296
- Rent YoY
- —
- Metro
- —
- State GDP YoY
- ▲ 3.29%
- F500 in state
- 10
Industry mix (Fortune 500 HQ in LA)
| Industry | F500 HQs | Revenue |
|---|---|---|
| Telecommunications | 2 | $23B |
|
||
| Utilities | 1 | $12B |
|
||
| Wholesale / Distribution | 1 | $5B |
|
||
| Advertising | 1 | $2B |
|
||
Price history
+5.8% since first listed2 events — show timeline
- 2026-06-14 Listed $137,500 SWLAR
- 2024-10-16 Listed $130,000 GFPAR
Property tax history
-3.2%/yrLatest (2025): $1,225 · -2.1% YoY. Source: county tax records.
Cash-flow waterfall
monthlySold comps — $/sqft
last 12 mo · ≤1 miLoading sold comps…