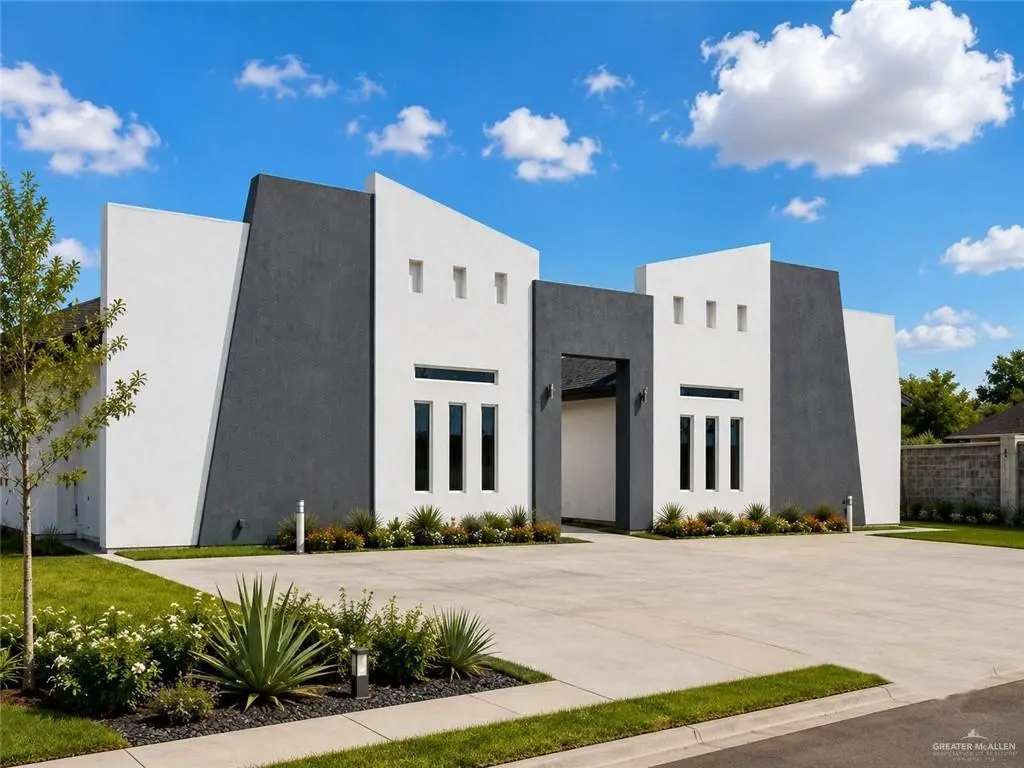
 Fourplex
1208 Woodland Ave · Pharr, TX
Flood risk 5/10 · Moderate
- FEMA flood zone
- X (shaded)
- Chance of flooding over 30 yrs
- 0.47%
- Est. flood insurance / yr
- $507 – $1,088
Fire risk 1/10 · Minimal
- Est. fire insurance / yr
- $1,222 – $2,270
Heat risk 8/10 · Major
- Hot days now (above 111°F)
- 7 days/yr
- Hot days in 30 yrs
- 21 days/yr
Wind risk 8/10 · Major
- Chance of severe wind over 30 yrs
- 99.0%
Air-quality risk 3/10 · Minor
- Unhealthy air days now
- 1 days/yr
- Unhealthy air days in 30 yrs
- 4 days/yr
Risk factors via First Street. Map © Google.
Why this score? — see what drove the D- grade
The composite is a weighted blend of 9 inputs, each scored 0–100. Each bar is that input's sub-score; the figure is the points it added to the 100-point composite (weight × sub-score).
- Cash flow +12.4/30.0
- Condition / age +5.0/5.0
- ARV discount +4.0/15.0
- 1% rule +3.7/10.0
- DSCR +3.7/10.0
- Livability +3.6/5.0
- Rent growth +2.4/5.0
- Schools +2.0/10.0
- Appreciation +0.0/10.0
$545,000
🖨 Deal sheet (PDF) 📄 Offer letter ✓ Due diligence
Multi-family units
County records classify this as Multi-Family (2-4 Unit). Listing-text estimate: 4 units. confirmed
Listing remarks
Exceptional investment opportunity in one of Pharr most desirable rental corridors adjacent to North McAllen! This brand-new fourplex is currently under construction with an anticipated completion and closing date of August 2026. Strategically located near DHR Health, Walmart, Expressway 281, and major thoroughfares including Sugar Road, Pecan Boulevard, and Nolana Avenue. Residents enjoy quick access to the Medical District, shopping, dining, parks, schools, and employment centers throughout the Rio Grande Valley. This central location consistently attracts quality tenants and maintains strong occupancy levels compared to many outlying submarkets. Investors will appreciate the potential be
Key facts
- Fourplex
- Medical district
- Central location
Tags
Property features AI
Finance
- Other: Corner lot location (corner of Sugar and Eldora, south of Nolana, north of Pecan); Lot dimensions about 76 x 131 (approximately 0.2286 acres); Community includes sidewalks; Number of units in community: 2
- Financial info: Escrow amount recorded
- HOA & community: Association: Rich Heritage Construction Inc; Annual association fee of $750; POA is mandatory with a transfer fee; POA transfer fee applies
Exterior
- Parking: No carport; No garage or covered parking
- Security: Firewall(s)
- Utilities: City sewer; Cable available; Multiple water meters (5)
- Home design: Property has living area per blueprints
- Construction: Stucco construction; Shingle roof; Slab foundation; Building area approximately 4,082 (units recorded)
- Exterior features: Wood fencing; Patio with patio slab; Professional landscaping; Sidewalks; Sprinkler system; Paved road access; Outbuilding (none)
Interior
- Kitchen: Microwave; Refrigerator; Stove/Range; Electric water heater
- Flooring: Tile
- Heating & cooling: Central heating; Central air conditioning
- Interior features: Ceiling fans; Decorative/high ceilings; Microwave; Walk-in closet(s)
- Laundry & utility: Laundry area with washer/dryer connection
Neighborhood map
What this means for you Summary
Snapshot
- This is a 4 × 2-bed/2.0-bath units multifamily listed at $545k. Condition is rated excellent.
Deal economics
- At list price, monthly cash flow is $-89 ($-1k/yr) — negative. Per door: $-22/mo.
- To cash-flow at today's rent, offer at most $532k (2.4% below list).
- To meet the 1% rule (rent ≥ 1% of price), the offer needs to be $474k (13.1% below list).
- Recommended offer: $474k (13.1% below list) — sets the bar for 1% rule.
- Cap rate 6.1% vs local median 3.4% in Pharr — top-decile yield for the area; either an underpriced asset or a hidden risk that comps aren't pricing in. Stress-test before assuming the spread holds.
Location & tenants
- Location reads 72/100 on livability (#245 in TX) — a middle-class / working-renter tenant base. Strengths: cost of living A+, housing A+, health & safety A+; Watch: amenities F, commute F, employment F.
- Pharr-San Juan-Alamo ISD (suburban): math 18% / reading 30% proficiency, ranked #740 of 826 in TX (top 90%) — low school quality limits family demand, transient renter base, plan for 1-2y turnover; 72% free/reduced lunch — lower-income household profile, screen leases tightly.
- Zoned schools: Daniel Ramirez El (math 12% / reading 27%, grade F, #3,583 of 4,322 statewide, top 86%, 483 students, 96% FRL); Psja North Early College H S (math 32% / reading 46%, grade F, #859 of 1,632 statewide, top 53%, 2,176 students, 88% FRL) — zoned schools average 92% FRL vs 72% district-wide (20 pts higher); higher-poverty schools than district average — tighter screening recommended.
- Market conditions: Rents soft (-0.2%/yr); 451 active listings in the ZIP; 9 comparable units currently listed for rent nearby; rentals lingering (median 45d on market — plan ~5-8 weeks vacancy on turnover, expect pricing pressure); 89% of comp listings sitting > 30 days — soft ceiling on asking rent; 7,378 units permitted in Hidalgo County in 2024 (641 in 5+ unit buildings).
- At $4,735/mo this rent would consume 108% of the median local household income ($53k/yr) (locally 2161% of renters already pay >50% of income on rent) — very limited rent-growth headroom before tenants either downsize or default.
Forward outlook
- Local home prices are declining (-3.0%/yr); year-one equity from $4k of loan paydown is wiped out by about $16k of value loss. Plan a longer hold.
- Hidalgo County population projected at +28% by 2050 — long-run rental-demand tailwind backs the buy-and-hold thesis.
Negotiation context
- Only 10 days on market — expect competitive offers; lowballing is unlikely to land.
Risks & watch-outs
- Climate carrying-cost: moderate flood risk; severe wind risk, 99% chance of damaging wind over 30y; extreme-heat days projected 7→21/yr by 2055 (HVAC capex compounding) — expect insurance premiums to compound above CPI over the hold.
Questions for the listing agent
- What do current leases actually rent for vs. the listed asking? Can we see a recent rent roll and the last 12 months of T-12 income?
- Can we see the unit-by-unit rent roll, current vacancy, and any below-market leases? What's the average tenancy length?
- What capital expenditures (roof, boiler, parking lot, exteriors) have been made in the last 5 years, and what's planned in the next 2?
- What does the HOA fee cover, when was the last increase, and are there any pending special assessments or reserve-fund shortfalls?
- Is there a deadline driving the sale (1031 exchange, divorce, estate, relocation)? That informs how much negotiation room exists.
- Schools are D-rated, which usually means shorter tenancies and higher turnover. Who's the typical renter profile here, and what's been the actual vacancy rate?
- The area grade is low — what's the realistic commute time and amenity access for the typical tenant pool here? Any planned neighborhood developments (good or bad) we should know about?
- What's the average days-on-market for RENTAL listings here right now (not sales)? A rising rental-DOM trend means longer vacancies and softer asking-rent achievability than the comps imply.
- What's the recent tenant-quality profile in this submarket — average credit score on applications, eviction rate, late-payment / NSF rate, and stable-employment percentage? A property-management company in the area should have these aggregated.
- How much new apartment / multifamily construction is in the pipeline within 1–3 miles? Heavy new supply (>2% of stock underway) typically softens rents 12–24 months out; light construction supports rent growth.
Investment metrics
- 1% rule
- 0.87% ✗
- Cap rate
- 6.10%
- Cash-on-cash
- -0.70%
- DSCR
- 0.97
- GRM
- 9.6
CMA / ARV
- ARV (on-the-fly)
- $506,168
- Comps found
- 10
Show comp detail 10 sales within ~0.75 mi
| Address | Dist | Beds/Ba | Sqft | Sold | Price | $/sf | Match |
|---|---|---|---|---|---|---|---|
| 708 W Bronze Dr | 0.25mi | —/— | 3,984 (-2%) | 2mo | $345,000 | $87 | 83 |
| 1607 W Bronze Dr | 0.28mi | —/— | 3,976 (-3%) | 3mo | $399,000 | $100 | 80 |
| 1807 W Douglas Ave | 0.42mi | —/— | 4,088 (+0%) | 6mo | $410,000 | $100 | 75 |
| 1313 E Hibiscus Ave | 0.68mi | —/— | 4,200 (+3%) | 1mo | $560,000 | $133 | 63 |
| 1707 W Bronze Dr | 0.35mi | —/— | 4,402 (+8%) | 11mo | $364,900 | $83 | 62 |
| 1316 E Hibiscus Ave | 0.67mi | —/— | 4,216 (+3%) | 6mo | $547,500 | $130 | 58 |
| 1320 E Hibiscus Ave | 0.65mi | —/— | 4,216 (+3%) | 9mo | $545,000 | $129 | 57 |
| 704 W Sioux Rd | 0.59mi | —/— | 4,236 (+4%) | 15mo | $459,999 | $109 | 53 |
| 1416 E Iris Ave | 0.58mi | —/— | 4,500 (+10%) | 3mo | $560,000 | $124 | 53 |
| 1412 E Iris Ave | 0.59mi | —/— | 4,500 (+10%) | 3mo | $560,000 | $124 | 53 |
Match score weights: distance 35% · size 25% · config 20% · recency 20%. Top-matched comps best support the ARV.
Projected returns pro-forma
-3.0% appreciation · 0.0% rent growth · sell at horizon
- IRR
- -20.9%
- Equity multiple
- 0.29×
- Total profit
- $-107,730
- Equity at exit
- $81,261
- IRR
- -23.4%
- Equity multiple
- -0.01×
- Total profit
- $-154,265
- Equity at exit
- $47,122
Cash invested: $152,600 (down + closing). Projections, not guarantees.
Landlord ↔ Tenant lean methodology
- Overall (STATE)
- 87 Strongly Landlord-Friendly
- State Texas
- 87 Strongly Landlord-Friendly · R+5
- County
- — inherits STATE
- City
- — inherits STATE
ZIP-level market 78577
- Home prices YoY
- -8.1%
- Rents YoY
- -0.2%
- Active inventory
- 451
- Price-to-rent
- 38.4×
Monthly cashflow live
- Estimated rent
- $4,735 high interval (Pro) →
- Mortgage (P&I)
- −$2,858
- Tax est. 1.5%
- −$681 /mo · $8,175/yr
- Insurance
- −$227
- HOA
- −$63
- Vacancy / Maint / Mgmt
- −$994
- Net cashflow
- $-89
Break-even live
Sensitivity live
| Price | -10% $288 | -5% $100 | +0% $-89 | +5% $-277 | +10% $-465 |
|---|---|---|---|---|---|
| Rent | -10% $-463 | -5% $-276 | +0% $-89 | +5% $98 | +10% $285 |
| Rate | -1.0pp $186 | -0.5pp $50 | base $-89 | +0.5pp $-230 | +1.0pp $-374 |
4-unit breakdown (identical units grouped — click to expand)
| Units | Beds | Baths | Est. rent |
|---|---|---|---|
| 4× units | 2 | 2 | $4,736 |
| #1 | 2 | 2 | $1,184 |
| #2 | 2 | 2 | $1,184 |
| #3 | 2 | 2 | $1,184 |
| #4 | 2 | 2 | $1,184 |
| Total (4 units) | $4,735 | ||
UW: 25.0% down · 7.5% · 30yr · 1.5% tax · 5.0% vac · 8.0% maint · 8.0% mgmt
Financing live
Cash to close
- Down payment
- $136,250
- Closing costs
- $16,350
- Reserves months
- —
- Total cash needed
- —
Loan-product check · same deal, 3 products live
Conventional
25% down · 7.5% · 30yr
- Down + closing
- —
- Monthly P&I
- —
- Monthly cashflow
- —
- DSCR
- —
- Eligible?
- —
Personal DTI + credit; lowest rate.
DSCR
20% down · 8.5% · 30yr
- Down + closing
- —
- Monthly P&I
- —
- Monthly cashflow
- —
- DSCR
- —
- Eligible?
- —
No personal income docs; deal must DSCR.
Hard money
10% down · 12.0% · 12mo
- Down + closing
- —
- Monthly P&I
- —
- Monthly cashflow
- —
- DSCR
- —
- Eligible?
- —
Short-term bridge; refi at stabilization.
Rent comps 9 comps
| Address | Beds | Baths | Sqft | Rent | $/sqft | DOM | Units | Dist |
|---|---|---|---|---|---|---|---|---|
| 705 W Bronze Dr Unit 2 Pharr, TX | 2.0 | 2.0 | 3640 | $950 | $0.26 | 44d | 1 | 0.25mi |
| 705 W Bronze Dr Unit 1 Pharr, TX | 2.0 | 2.0 | 3640 | $900 | $0.25 | 44d | 1 | 0.26mi |
| 1109 W Eisenhower St Unit 5 Pharr, TX | 2.0 | 2.0 | 4907 | $899 | $0.18 | 44d | 1 | 0.37mi |
| 1316 E Hibiscus Ave McAllen, TX | 3.0 | 2.0 | 4216 | $1,350 | $0.32 | 15d | 1 | 0.66mi |
| 4904 N Crown Pt Unit 1 Pharr, TX | 2.0 | 2.0 | 3944 | $1,150 | $0.29 | 44d | 1 | 0.77mi |
| 913 E Daffodil Ave Unit B McAllen, TX | 2.0 | 2.0 | 3552 | $800 | $0.23 | 44d | 1 | 0.90mi |
| 805 W Los Tesoros Dr Unit 4 Pharr, TX | 3.0 | 2.0 | 4860 | $1,100 | $0.23 | 44d | 1 | 0.96mi |
| 901 E Redbud Ave Unit 706 McAllen, TX | 2.0 | 2.0 | 3860 | $925 | $0.24 | 44d | 1 | 1.16mi |
| 4710 N Ebony St Pharr, TX | 3.0 | 2.0 | 4160 | $2,800 | $0.67 | 44d | 1 | 1.38mi |
HOA detail
- Monthly dues
- $63 · $756/yr
Listing history 9 events
-
2026-06-18days on market $545,000 Active 10 DOM
-
2026-06-17days on market $545,000 Active 9 DOM
-
2026-06-16days on market $545,000 Active 8 DOM
-
2026-06-15days on market $545,000 Active 7 DOM
-
2026-06-14days on market $545,000 Active 5 DOM
-
2026-06-13days on market $545,000 Active 4 DOM
-
2026-06-10days on market $545,000 Active 2 DOM
-
2026-06-09remarks 699-char remark
-
2026-06-09$545,000 Active 1 DOM
ⓘ Source: listings_history table (triggers on properties + properties_extension) + one-shot
backfill from property_details.listing_events for pre-trigger history.
Climate risk First Street
- Flood 5/10 Major FEMA zone X (shaded) · 47% chance over 30 yrs
- Wildfire 1/10 Low
- Heat 8/10 Severe 7 d/yr ≥111°F today · 21 d/yr by 30 yrs out
- Wind 8/10 Severe 99% chance of damaging wind over 30 yrs
- Air quality 3/10 Moderate 1 unhealthy d/yr today · 4 by 30 yrs out
Nearby sold comps map
Loading sold comps map…
Walkable amenities ~0.75 mi
Loading nearby amenities…
Taxation est. · year 1
- Rental income
- $56,820
- − Mortgage interest
- −$30,528
- − Property taxes
- −$8,175
- − Insurance
- −$2,725
- − Repairs & maintenance
- −$4,546
- − Management
- −$4,546
- − HOA
- −$756
- − Depreciation
- −$15,855
- Taxable loss
- −$10,310
- Est. tax savings @ 24.0%
- +$2,474
- After-tax cash flow
- $1,410/yr
For passive investors: Depreciation is non-cash, so a rental often shows a tax loss while cash-flowing — sheltering income. Rental losses are passive: they offset passive income freely, and up to $25,000/yr can offset ordinary (W-2) income if you actively participate and your MAGI is under $100k (phasing out to $0 by $150k); unused losses carry forward. On sale, claimed depreciation is recaptured at up to 25%, and gains may owe capital-gains tax (a 1031 exchange can defer both). Figures are a year-1 estimate at your 24.0% rate — not tax advice; consult a CPA.
Condition & rehab AI · 12 photos
This modern fourplex is in excellent condition with no visible repairs needed. It offers a great investment opportunity with a prime location and high potential for both resale and rental value.
Value-add opportunities
- Both Landscaping improvements — Enhances curb appeal and adds value for both resale and rental.
- Both Painting exterior walls — Fresh paint can make the home more appealing and increase its value.
- Both Landscaping improvements — Enhances curb appeal and adds value for both resale and rental.
Renovation cost estimate screening
Value-add ROI direction
- Both Landscaping improvements — Enhances curb appeal and adds value for both resale and rental. ↑
- Both Painting exterior walls — Fresh paint can make the home more appealing and increase its value. ↑
- Both Landscaping improvements — Enhances curb appeal and adds value for both resale and rental. ↑
ⓘ Cost ranges are severity-bucket heuristics (US national rule-of-thumb). Get contractor quotes + a written scope before underwriting a rehab budget.
Schools (NCES district)
- District
- Pharr-San Juan-Alamo ISD
- NCES district ID
- 4834860
- Math proficiency
- 18% ▼ -34.00%
- Reading proficiency
- 30% ▼ -11.00%
- Median HH income
- $33,757
- Composite
- 19.63/100
- National rank
- #8744
- State rank
- #740 of 826 in TX
Livability — Pharr
- Score
- 72/100
- State rank
- #245
- US rank
- #5852
Category grades
Schools grade is shown separately in the Schools card above.
Census & demographics
- Census place
- Pharr, TX
- County
- Hidalgo County · 623,128 people
- City population
- 80,540
- Metro
- McAllen-Edinburg-Mission, TX
- Population (ZIP)
- 80,540
- Household income
- $52,770
- Rent vs Own
- Severe rent burden
- 2161.0
Population outlook (Hidalgo County) Hauer SSP2
- Today (2025)
- 955,232 people
- By 2030
- 1,009,774 · +5.7%
- By 2040
- 1,120,332 · +17.3%
- By 2050
- 1,225,036 · +28.2%
- By 2075
- 1,439,189 · +50.7%
- By 2100
- 1,533,429 · +60.5%
Race, ethnicity, and origin ACS 2023
- Neighborhood character
- Predominantly Hispanic (95%)
- Race & ethnicity
- Hispanic / Latino 95% Two or more races 45% White 5%
- Hispanic origin (detail)
- Mexican 92%
- Foreign-born
- 29% · Canada
- Languages at home
- 18% English-only · Spanish 81%
Political lean MEDSL · Hidalgo
- 2024 margin
- Toss-up / Even · D 48.1% · R 51.0%
- 2008→2024 swing
- -41.6pp toward R · 2008: 38.7pp · 2024: -2.9pp
- All cycles
- 2024: R+2.9 2020: D+17.1 2016: D+40.5 2012: D+41.8 2008: D+38.7
Not yet ingested
- Civics
- —
Market trends
- HPI YoY
- ▼ -23.00%
- Current HPI
- 261.1606
- Rent YoY
- ▼ -0.24%
- Metro
- McAllen-Edinburg-Mission, TX
- State GDP YoY
- ▲ 3.95%
- F500 in state
- 110
Industry mix (Fortune 500 HQ in TX)
| Industry | F500 HQs | Revenue |
|---|---|---|
| Energy | 16 | $1,198B |
|
||
| Technology | 5 | $198B |
|
||
| Engineering / Construction | 4 | $72B |
|
||
| Energy Services | 3 | $60B |
|
||
| Utilities | 3 | $41B |
|
||
| Healthcare | 2 | $330B |
|
||
Price history
1 event — show timeline
- 2026-06-08 Listed $545,000 MCALLENMLS
Cash-flow waterfall
monthlySold comps — $/sqft
last 12 mo · ≤1 miLoading sold comps…