 Multi-family
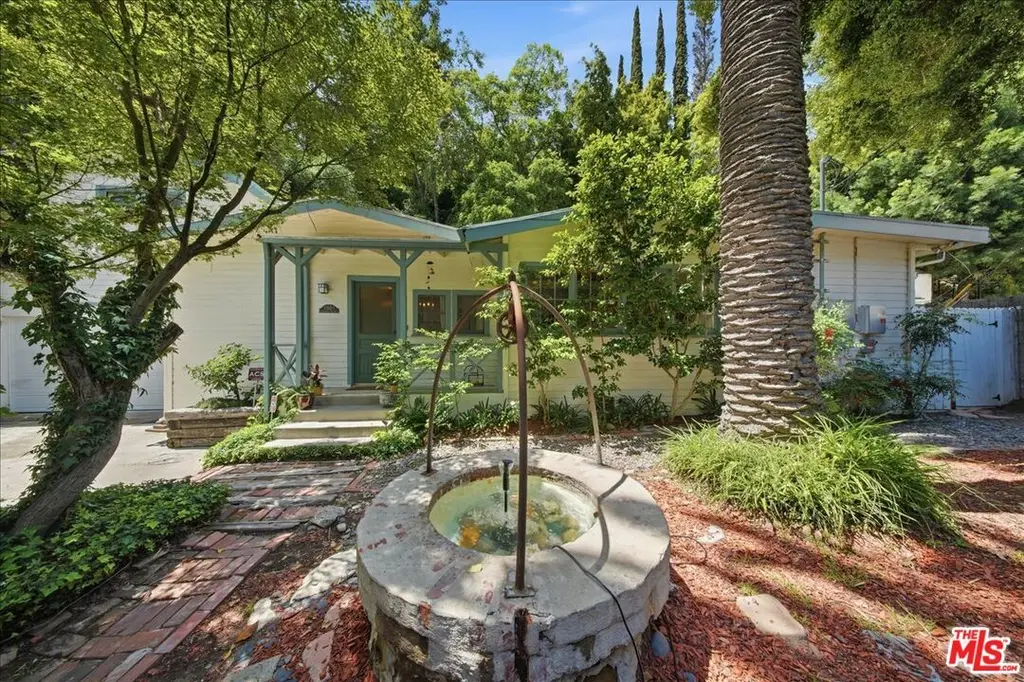
1551 N Beverly Glen Blvd · Los Angeles, CA
Flood risk 9/10 · Severe
- FEMA flood zone
- X (unshaded)
- Chance of flooding over 30 yrs
- 0.79%
- Est. flood insurance / yr
- $507 – $1,088
Fire risk 6/10 · Moderate
- Est. fire insurance / yr
- $659 – $1,223
Heat risk 5/10 · Moderate
- Hot days now (above 86°F)
- 7 days/yr
- Hot days in 30 yrs
- 20 days/yr
Wind risk 1/10 · Minimal
- Chance of severe wind over 30 yrs
- —
Air-quality risk 5/10 · Moderate
- Unhealthy air days now
- 7 days/yr
- Unhealthy air days in 30 yrs
- 7 days/yr
Risk factors via First Street. Map © Google.
Why this score? — see what drove the D+ grade
The composite is a weighted blend of 9 inputs, each scored 0–100. Each bar is that input's sub-score; the figure is the points it added to the 100-point composite (weight × sub-score).
- Cash flow +12.8/30.0
- ARV discount +7.5/15.0
- Appreciation +7.3/10.0
- DSCR +3.8/10.0
- Schools +3.6/10.0
- Livability +3.4/5.0
- 1% rule +3.1/10.0
- Rent growth +2.5/5.0
- Condition / age +2.5/5.0
$1,445,000
🖨 Deal sheet (PDF) 📄 Offer letter ✓ Due diligence
Multi-family units
County records classify this as Multi-Family (2-4 Unit). Listing-text estimate: 1 unit. estimate disagrees with records
Listing remarks
Immersed in nature while living in the city, where privacy, comfort, and opportunity come together. Located in desirable Beverly Glen, this charming property invites you to create your own zen inspired retreat, walking distance to a local market and only two miles from The Glen Centre. Offering around 1,900 sq ft of living space, the home features a spacious and inviting layout seamlessly connected with a bespoke kitchen design. With three bedrooms and three bathrooms, including a primary suite with additional direct access to the backyard, another ensuite bedroom and an additional third bedroom with its own separate bathroom, the home provides both comfort and functionality. The front yard
Key facts
- 8,479 sq ft lot
- 6 parking spots
- Built 1918
Property features AI
Finance
- Financial info: Accepts cash and conventional financing
Exterior
- Parking: Attached covered parking; Driveway parking; Total of 6 parking spaces (2 covered, 4 open)
- Security: Alarm system
- Utilities: Solar panels (power); Public water and sewer likely (not explicitly stated)
- Home design: Detached single-family home; Split-level design; 2 total floors; Faces east
- Construction: Detached / no common walls
- Exterior features: Canyon lot location; Views of hills and trees/woods; No other structures
Interior
- Kitchen: Dishwasher; Range/oven; Refrigerator; Freezer; Garbage disposal
- Bedrooms: Split-level home with bedrooms on multiple levels
- Flooring: Wood floors; Stone tile floors; Ceramic tile floors
- Bathrooms: 2 full bathrooms; 1 three-quarter bathroom
- Heating & cooling: Solar-powered heating; No cooling
- Interior features: Family room; Living room; Office; Dining area; Walk-in closet; Decorative fireplace; Fireplace in living room; Fireplace in dining area; Has view of hills and trees/woods; Alarm system; Solar panels; Solar heat
- Laundry & utility: Laundry area; Washer
Neighborhood map
What this means for you Summary
Snapshot
- This is a 4-bed/2.0-bath multifamily listed at $1.45M.
Deal economics
- At list price, monthly cash flow is $-207 ($-2k/yr) — negative.
- To cash-flow at today's rent, offer at most $1.41M (2.5% below list).
- To meet the 1% rule (rent ≥ 1% of price), the offer needs to be $1.17M (19.1% below list).
- Recommended offer: $1.17M (19.1% below list) — sets the bar for 1% rule.
- Cap rate 6.2% vs local median 2.1% in Los Angeles — top-decile yield for the area; either an underpriced asset or a hidden risk that comps aren't pricing in. Stress-test before assuming the spread holds.
Location & tenants
- Location reads 68/100 on livability (#273 in CA) — a middle-class / working-renter tenant base. Strengths: amenities A+, commute A+, employment B; Watch: health & safety C-, crime F, cost of living F.
- Los Angeles Unified (urban): math 29% / reading 54% proficiency, ranked #223 of 517 in CA (top 43%) — families likely to look elsewhere, expect single-tenant / working-renter base with shorter leases; 67% free/reduced lunch — lower-income household profile, screen leases tightly.
- Zoned schools: Warner Avenue Elementary (569 students, 8% FRL); Emerson Community Charter (492 students, 51% FRL, charter); University High School Charter (math 40% / reading 66%, grade C-, #285 of 1,170 statewide, top 25%, 1,338 students, 72% FRL, charter) — zoned schools average 44% FRL vs 67% district-wide (24 pts lower); this property's tenant base skews higher-income than the district average.
- Market conditions: 182 active listings in the ZIP; 16 comparable units currently listed for rent nearby; rentals lingering (median 46d on market — plan ~5-8 weeks vacancy on turnover, expect pricing pressure); 50% of comp listings sitting > 30 days — soft ceiling on asking rent; high-income renter base; 19,697 units permitted in Los Angeles County in 2024 (9,426 in 5+ unit buildings).
Forward outlook
- In year one you build about $78k of equity ($10k loan paydown + $68k appreciation (4.7% local appreciation)).
- Los Angeles County population projected at +9% by 2050 — modest demand growth; plan on rents tracking national, not racing it.
- By year 2, paydown + projected appreciation supports a ~$125k cash-out refi (75% LTV) — recoverable capital for the next deal without selling this one.
Negotiation context
- It's been on market 54 days — a 3% lower offer ($1.40M) is reasonable based on typical stale-listing flexibility.
- 8 sale attempts since 7y ago with the ask held roughly flat each time — persistent listings suggest the price (not the market) is what's stuck; bring a comps-based counter.
- Current owner paid $1.08M; 34% above their basis — modest negotiation headroom, anchor on the comps not their cost.
Risks & watch-outs
- Watch-outs: flood insurance adds $66/mo; built in 1918 — expect roof / HVAC / electrical / plumbing capex.
- Climate carrying-cost: severe flood risk; major wildfire risk; extreme-heat days projected 7→20/yr by 2055 (HVAC capex compounding) — expect insurance premiums to compound above CPI over the hold.
Questions for the listing agent
- What do current leases actually rent for vs. the listed asking? Can we see a recent rent roll and the last 12 months of T-12 income?
- It's been on market 54 days. Have you received any prior offers? Is the seller open to a 19% concession, seller financing, or rate buy-down credit?
- Built in 1918 — when were the roof, HVAC, electrical panel, plumbing, and water heater last replaced?
- What's the actual annual flood-insurance premium (NFIP or private), and is the property in a SFHA with mandatory coverage?
- Is there a deadline driving the sale (1031 exchange, divorce, estate, relocation)? That informs how much negotiation room exists.
- Schools are D-rated, which usually means shorter tenancies and higher turnover. Who's the typical renter profile here, and what's been the actual vacancy rate?
- Crime grade is F in this area — have there been break-ins, vandalism, or insurance claims at this property in the last 3 years? What carrier currently insures it and at what premium?
- The area grade is low — what's the realistic commute time and amenity access for the typical tenant pool here? Any planned neighborhood developments (good or bad) we should know about?
- What's the average days-on-market for RENTAL listings here right now (not sales)? A rising rental-DOM trend means longer vacancies and softer asking-rent achievability than the comps imply.
- What's the recent tenant-quality profile in this submarket — average credit score on applications, eviction rate, late-payment / NSF rate, and stable-employment percentage? A property-management company in the area should have these aggregated.
- How much new apartment / multifamily construction is in the pipeline within 1–3 miles? Heavy new supply (>2% of stock underway) typically softens rents 12–24 months out; light construction supports rent growth.
Investment metrics
- 1% rule
- 0.81% ✗
- Cap rate
- 6.18%
- Cash-on-cash
- -0.42%
- DSCR
- 0.98
- GRM
- 10.3
CMA / ARV
No comps found within radius.
Projected returns pro-forma
4.68% appreciation · 3.0% rent growth · sell at horizon
- IRR
- 11.5%
- Equity multiple
- 1.73×
- Total profit
- $293,767
- Equity at exit
- $791,278
- IRR
- 12.8%
- Equity multiple
- 3.25×
- Total profit
- $912,166
- Equity at exit
- $1,343,358
Cash invested: $404,600 (down + closing). Projections, not guarantees.
Landlord ↔ Tenant lean methodology
- Overall (CITY)
- 0 Strongly Tenant-Friendly
- State California
- 18 Strongly Tenant-Friendly · D+13
- County
- — inherits STATE
- City Los Angeles
- 0 Strongly Tenant-Friendly · D+22
ZIP-level market 90077
- Home prices YoY
- 1.2%
- Active inventory
- 182
- Price-to-rent
- 10.3×
Monthly cashflow live
- Estimated rent
- $11,697 high interval (Pro) →
- Mortgage (P&I)
- −$7,578
- Tax from tax record
- −$1,202 /mo · $14,419/yr
- Insurance
- −$602
- Flood insurance flood zone
- −$66 /mo · $798/yr
- HOA
- −$0
- Vacancy / Maint / Mgmt
- −$2,456
- Net cashflow
- $-207
Break-even live
Sensitivity live
| Price | -10% $611 | -5% $202 | +0% $-207 | +5% $-616 | +10% $-1,025 |
|---|---|---|---|---|---|
| Rent | -10% $-1,131 | -5% $-669 | +0% $-207 | +5% $255 | +10% $717 |
| Rate | -1.0pp $520 | -0.5pp $160 | base $-207 | +0.5pp $-582 | +1.0pp $-963 |
UW: 25.0% down · 7.5% · 30yr · 1.5% tax · 5.0% vac · 8.0% maint · 8.0% mgmt
Financing live
Cash to close
- Down payment
- $361,250
- Closing costs
- $43,350
- Reserves months
- —
- Total cash needed
- —
Loan-product check · same deal, 3 products live
Conventional
25% down · 7.5% · 30yr
- Down + closing
- —
- Monthly P&I
- —
- Monthly cashflow
- —
- DSCR
- —
- Eligible?
- —
Personal DTI + credit; lowest rate.
DSCR
20% down · 8.5% · 30yr
- Down + closing
- —
- Monthly P&I
- —
- Monthly cashflow
- —
- DSCR
- —
- Eligible?
- —
No personal income docs; deal must DSCR.
Hard money
10% down · 12.0% · 12mo
- Down + closing
- —
- Monthly P&I
- —
- Monthly cashflow
- —
- DSCR
- —
- Eligible?
- —
Short-term bridge; refi at stabilization.
Rent comps 16 comps
| Address | Beds | Baths | Sqft | Rent | $/sqft | DOM | Units | Dist |
|---|---|---|---|---|---|---|---|---|
| 1750 N Beverly Glen Blvd Los Angeles, CA | 3.0 | 2.0 | 2497 | $19,950 | $7.99 | 9d | 1 | 0.26mi |
| 1712 Benedict Canyon Dr Beverly Hills, CA | 3.0 | 2.0 | 1425 | $4,999 | $3.51 | 45d | 1 | 0.44mi |
| 1800 Benedict Canyon Dr Beverly Hills, CA | 3.0 | 3.0 | 1786 | $12,000 | $6.72 | 45d | 1 | 0.44mi |
| 1438 Davies Dr Beverly Hills, CA | 3.0 | 3.0 | 1787 | $9,950 | $5.57 | 26d | 1 | 0.55mi |
| 10160 Cielo Dr Unit 1/2 Beverly Hills, CA | 3.0 | 3.5 | 2600 | $12,500 | $4.81 | 45d | 1 | 0.56mi |
| 10439 Seabury Ln Los Angeles, CA | 3.0 | 2.0 | 2222 | $6,950 | $3.13 | 26d | 1 | 0.78mi |
| 1005 Stradella Rd Los Angeles, CA | 3.0 | 2.0 | 2000 | $7,300 | $3.65 | 23d | 1 | 0.86mi |
| 1212 Roberto Ln Los Angeles, CA | 3.0 | 3.0 | 2447 | $8,600 | $3.51 | 45d | 1 | 0.94mi |
| 9842 Portola Dr Beverly Hills, CA | 3.0 | 3.5 | 2400 | $8,000 | $3.33 | 18d | 1 | 0.95mi |
| 9842 Portola Dr Beverly Hills, CA | 3.0 | 3.5 | 2400 | $8,000 | $3.33 | 4d | 1 | 0.95mi |
| 9820 Yoakum Dr Beverly Hills, CA | 3.0 | 2.5 | 1626 | $7,500 | $4.61 | 45d | 1 | 1.08mi |
| 1919 San Ysidro Dr Beverly Hills, CA | 3.0 | 2.0 | 1884 | $10,500 | $5.57 | 26d | 1 | 1.16mi |
| 2528 Angelo Dr Los Angeles, CA | 3.0 | 3.5 | 2536 | $12,950 | $5.11 | 15d | 1 | 1.22mi |
| 1318 San Ysidro Dr Beverly Hills, CA | 4.0 | 3.5 | 2539 | $11,500 | $4.53 | 45d | 1 | 1.25mi |
| 9834 Wanda Park Dr Beverly Hills, CA | 4.0 | 3.0 | 2135 | $10,500 | $4.92 | 45d | 1 | 1.28mi |
| 2050 Linda Flora Dr Los Angeles, CA | 3.0 | 3.0 | 2042 | $8,995 | $4.40 | 45d | 1 | 1.43mi |
Listing history 31 events
-
2026-06-21days on market $1,445,000 Active 54 DOM
-
2026-06-18days on market $1,445,000 Active 51 DOM
-
2026-06-17days on market $1,445,000 Active 50 DOM
-
2026-06-16days on market $1,445,000 Active 49 DOM
-
2026-06-15days on market $1,445,000 Active 48 DOM
-
2026-06-13days on market $1,445,000 Active 46 DOM
-
2026-06-09days on market $1,445,000 Active 42 DOM
-
2026-06-08days on market $1,445,000 Active 41 DOM
-
2026-06-07days on market $1,445,000 Active 40 DOM
-
2026-06-04days on market $1,445,000 Active 37 DOM
-
2026-06-03days on market $1,445,000 Active 36 DOM
-
2026-06-02days on market $1,445,000 Active 35 DOM
-
2026-06-01days on market $1,445,000 Active 34 DOM
-
2026-05-31days on market $1,445,000 Active 33 DOM
-
2026-04-25$1,445,000 Active 1094-char remark
-
2026-04-18status Active
-
2026-04-06historical Active Under Contract
-
2026-01-28$1,445,000 Active
-
2025-07-11$1,379,000 Active
-
2024-03-07status Active
-
2024-01-27historical Backup Offers Accepted
-
2024-01-27status Pending
-
2023-12-07status Active
-
2023-12-07price
-
2023-12-01status Pending
-
2023-10-24Active
-
2019-11-13soldstatus $1,077,500 Sold
-
2019-11-13soldstatus $1,077,500
-
2019-11-03status Pending
-
2019-10-16historical Backup Offers Accepted
-
2019-09-06$1,149,000 Active
ⓘ Source: listings_history table (triggers on properties + properties_extension) + one-shot
backfill from property_details.listing_events for pre-trigger history.
Tax reassessment forecast CA · Resets to sale price
- Current annual tax
- $14,419 · $1,202/mo
- Projected year-2 tax
- $14,419 · $1,202/mo
- Expected delta
- $0/yr ($0/mo · 0.0%)
ⓘ Screening estimate from a state-policy table — verify with the county assessor before closing.
Climate risk First Street
- Flood 9/10 Extreme FEMA zone X (unshaded) · 79% chance over 30 yrs
- Wildfire 6/10 Major
- Heat 5/10 Major 7 d/yr ≥86°F today · 20 d/yr by 30 yrs out
- Wind 1/10 Low
- Air quality 5/10 Major 7 unhealthy d/yr today · 7 by 30 yrs out
Nearby sold comps map
Loading sold comps map…
Walkable amenities ~0.75 mi
Loading nearby amenities…
Taxation est. · year 1
- Rental income
- $140,364
- − Mortgage interest
- −$80,942
- − Property taxes
- −$14,419
- − Insurance
- −$8,023
- − Repairs & maintenance
- −$11,229
- − Management
- −$11,229
- − Depreciation
- −$42,036
- Taxable loss
- −$27,515
- Est. tax savings @ 24.0%
- +$6,604
- After-tax cash flow
- $4,116/yr
For passive investors: Depreciation is non-cash, so a rental often shows a tax loss while cash-flowing — sheltering income. Rental losses are passive: they offset passive income freely, and up to $25,000/yr can offset ordinary (W-2) income if you actively participate and your MAGI is under $100k (phasing out to $0 by $150k); unused losses carry forward. On sale, claimed depreciation is recaptured at up to 25%, and gains may owe capital-gains tax (a 1031 exchange can defer both). Figures are a year-1 estimate at your 24.0% rate — not tax advice; consult a CPA.
Schools (NCES district)
- District
- Los Angeles Unified
- NCES district ID
- 0622710
- Math proficiency
- 29% ▼ -4.00%
- Reading proficiency
- 54% ▲ 10.00%
- Median HH income
- $50,403
- Composite
- 35.67/100
- National rank
- #4875
- State rank
- #223 of 517 in CA
Livability — Los Angeles
- Score
- 68/100
- State rank
- #273
- US rank
- #9237
Category grades
Schools grade is shown separately in the Schools card above.
Census & demographics
- Census place
- Los Angeles, CA
- County
- Los Angeles County · 9,444,647 people
- City population
- 3,838,149
- Metro
- Los Angeles-Long Beach-Anaheim, CA
- Population (ZIP)
- 8,386
- Household income
- $206,319
- Rent vs Own
- Severe rent burden
- 198.0
Population outlook (Los Angeles County) Hauer SSP2
- Today (2025)
- 10,940,515 people
- By 2030
- 11,256,481 · +2.9%
- By 2040
- 11,729,929 · +7.2%
- By 2050
- 11,948,407 · +9.2%
- By 2075
- 11,818,114 · +8.0%
- By 2100
- 10,842,928 · -0.9%
Race, ethnicity, and origin ACS 2023
- Neighborhood character
- Predominantly White (77%)
- Race & ethnicity
- White 77% Asian 10% Two or more races 9% Hispanic / Latino 7% Black 1%
- Hispanic origin (detail)
- Mexican 2% Cuban 1%
- Common ancestry
- Scotch-Irish 11% Romanian 4% Lithuanian 3%
- Foreign-born
- 28% · Canada, China, South Korea
- Languages at home
- 69% English-only · Other Indo-European 17% Spanish 4% Chinese 3%
Political lean MEDSL · Los Angeles
- 2024 margin
- Solid D (+32.9) · D 64.8% · R 31.9% · Other 3.3%
- 2008→2024 swing
- -7.4pp toward R · 2008: 40.4pp · 2024: 32.9pp
- All cycles
- 2024: D+32.9 2020: D+44.2 2016: D+48.0 2012: D+40.0 2008: D+40.4
Not yet ingested
- Civics
- —
Market trends
- HPI YoY
- ▲ 4.68%
- Current HPI
- 394.6594
- Rent YoY
- —
- Metro
- Los Angeles-Long Beach-Anaheim, CA
- State GDP YoY
- ▲ 3.21%
- F500 in state
- 116
Industry mix (Fortune 500 HQ in CA)
| Industry | F500 HQs | Revenue |
|---|---|---|
| Technology | 27 | $1,492B |
|
||
| Financial Services | 3 | $174B |
|
||
| Retail | 3 | $44B |
|
||
| Insurance | 3 | $26B |
|
||
| Media / Entertainment | 2 | $115B |
|
||
| Pharmaceuticals / Biotech | 2 | $62B |
|
||
Price history
+25.8% since first listed17 events — show timeline
- 2026-04-25 Listed $1,445,000 TheMLS
- 2026-04-18 Relisted — CRMLS
- 2026-04-06 Contingent — CRMLS
- 2026-01-28 Listed $1,445,000 CRMLS
- 2025-07-11 Listed $1,379,000 CRMLS
- 2024-03-07 Relisted — TheMLS
- 2024-01-27 Contingent — TheMLS
- 2024-01-27 Pending — TheMLS
- 2023-12-07 Relisted — TheMLS
- 2023-12-07 Price Changed — TheMLS
- 2023-12-01 Pending — TheMLS
- 2023-10-24 Listed — TheMLS
- 2019-11-13 Sold (Public Records) $1,077,500 Public Records
- 2019-11-13 Sold (MLS) $1,077,500 TheMLS
- 2019-11-03 Pending — TheMLS
- 2019-10-16 Contingent — TheMLS
- 2019-09-06 Listed $1,149,000 TheMLS
Property tax history
+8.2%/yrLatest (2025): $14,419 · +1.6% YoY. Source: county tax records.
Cash-flow waterfall
monthlySold comps — $/sqft
last 12 mo · ≤1 miLoading sold comps…