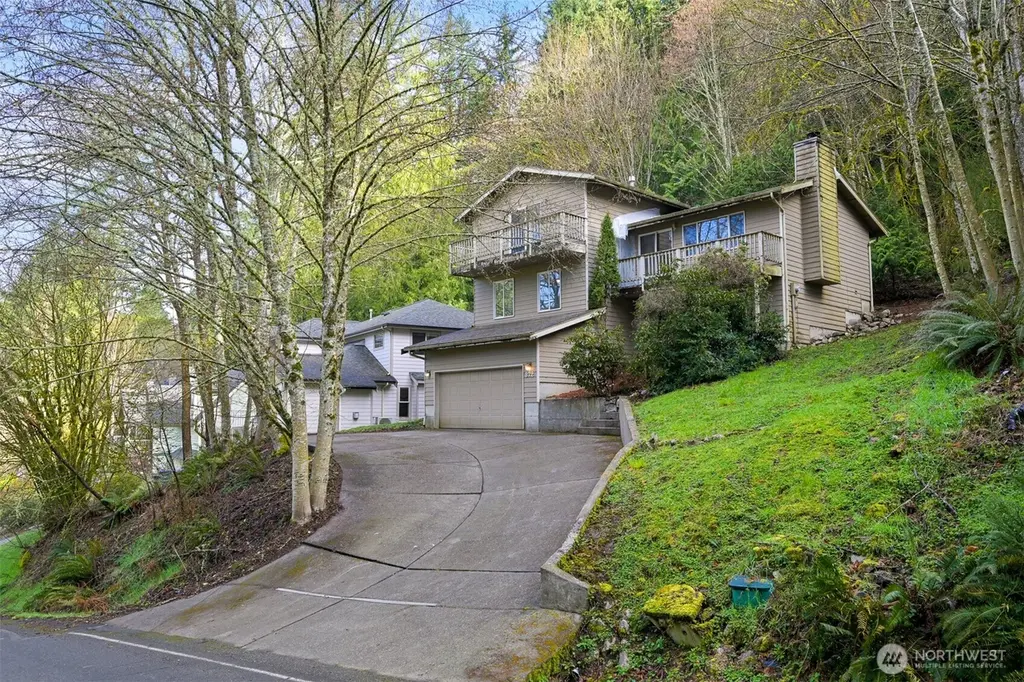
372 Sudden Valley Dr · Sudden Valley, WA
Flood risk 1/10 · Minimal
- FEMA flood zone
- X (unshaded)
- Chance of flooding over 30 yrs
- 0.0%
- Est. flood insurance / yr
- $473 – $860
Fire risk 3/10 · Minor
- Est. fire insurance / yr
- $604 – $1,122
Heat risk 1/10 · Minimal
- Hot days now (above 84°F)
- 8 days/yr
- Hot days in 30 yrs
- 18 days/yr
Wind risk 1/10 · Minimal
- Chance of severe wind over 30 yrs
- —
Air-quality risk 7/10 · Major
- Unhealthy air days now
- 11 days/yr
- Unhealthy air days in 30 yrs
- 11 days/yr
Risk factors via First Street. Map © Google.
Why this score? — see what drove the F grade
The composite is a weighted blend of 9 inputs, each scored 0–100. Each bar is that input's sub-score; the figure is the points it added to the 100-point composite (weight × sub-score).
- ARV discount +15.0/15.0
- Schools +4.8/10.0
- Cash flow +3.4/30.0
- Livability +3.4/5.0
- Rent growth +2.6/5.0
- Condition / age +2.5/5.0
- 1% rule +0.1/10.0
- DSCR +0.0/10.0
- Appreciation +0.0/10.0
$400,000
🖨 Deal sheet 📄 Offer letter ✓ Due diligence
Listing remarks
Genuine opportunity to customize a rare 5 bedroom home in the coveted Sudden Valley community of Bellingham! Flush with amenities, your life here has access to Lake Whatcom, parks, community events, a library, tennis courts, pool, and road maintenance (to name a few). Pre-inspected for your convenience, we've confirmed that aside from the obvious repairs needed, this is almost entirely just a cosmetic fixer. Main ticket items: roof, decks, and some siding along with some pinpointed associated damage. Beyond that, you get a relatively clean slate to build out how you like with your favorite finishes, paint, etc. 5 bedrooms span 3 different floors and it has tons of garage and mini-shop stora
Key facts
- Tennis courts
- 5,375 sq ft lot
- Garage
Tags
Property features AI
Finance
- Other: Directions: Use GPS but confirm property as GPS may point to neighboring house
- Financial info: Listing terms: Cash or Conventional
- HOA & community: Homeowners association with monthly fee of $168; Association covers common area maintenance, road maintenance, security, and snow removal; Community features: Clubhouse, golf, park, playground, trails, CCRs
Exterior
- Parking: Attached garage; Covered parking for 2; RV parking
- Security: Security service; Community security included in association
- Utilities: Electric and propane energy sources; Community water (Lake Whatcom Water & Sewer); Sewer connected (Lake Whatcom Water & Sewer); Power by PSE
- Home design: Single family residence; Tri-level style; Entry on lower level; Three or more levels; Residential property
- Construction: Built on lot; Wood construction; Composition roof; Poured concrete foundation; Effective year built 1993
- Exterior features: Wood products exterior; Deck; Cable TV available; RV parking; Boat launch access (community); Trails
Interior
- Kitchen: Dishwasher; Garbage disposal; Refrigerator; Stove/Range
- Bedrooms: 5 bedrooms (2 upper, 2 main, 1 lower)
- Bathrooms: 2 full bathrooms; 1 half bathroom; 2 bathtubs; 2 showers
- Heating & cooling: Forced air heating; Forced air cooling; Has heating and cooling
- Interior features: Dining room; Fireplace; Walk-in closet(s)
- Laundry & utility: Utility room (lower level)
Neighborhood map
What this means for you Summary
Snapshot
- This is a 2-bed/2.0-bath single-family listed at $400k.
Deal economics
- At list price, monthly cash flow is $-1k ($-15k/yr) — negative.
- To cash-flow at today's rent, offer at most $182k (54.5% below list).
- To meet the 1% rule (rent ≥ 1% of price), the offer needs to be $204k (49.1% below list).
- Recommended offer: $182k (54.5% below list) — sets the bar for cash-flow.
Location & tenants
- Location reads 68/100 on livability (#285 in WA) — a middle-class / working-renter tenant base. Strengths: employment A+, housing A+; Watch: health & safety D, amenities F, cost of living F.
- Bellingham School District (urban): math 47% / reading 63% proficiency, ranked #106 of 291 in WA (top 36%) — acceptable for families but not a draw, mixed tenant base, ~2y average lease.
- Zoned schools: Geneva Elementary School (432 students, 28% FRL); Bellingham High School (1,218 students, 34% FRL) — zoned schools at 31% FRL track the district average.
- Market conditions: Rents flat; 378 active listings in the ZIP; solid renter incomes; 1,190 units permitted in Whatcom County in 2024 (327 in 5+ unit buildings).
- This rent runs 31% of the median local income ($79k/yr) — at the standard rent-burdened threshold; future hikes will face affordability resistance.
Forward outlook
- Local home prices are declining (-3.0%/yr); year-one equity from $3k of loan paydown is wiped out by about $12k of value loss. Plan a longer hold.
- Whatcom County population projected at +28% by 2050 — long-run rental-demand tailwind backs the buy-and-hold thesis.
Negotiation context
- It's been on market 40 days — a 3% lower offer ($388k) is reasonable based on typical stale-listing flexibility.
- 3 sale attempts since 26y ago with the ask held roughly flat each time — persistent listings suggest the price (not the market) is what's stuck; bring a comps-based counter.
- Current owner paid $152k; list at $400k implies a 163% gain — meaningful room to come down on a strong offer.
Questions for the listing agent
- What do current leases actually rent for vs. the listed asking? Can we see a recent rent roll and the last 12 months of T-12 income?
- It's been on market 40 days. Have you received any prior offers? Is the seller open to a 55% concession, seller financing, or rate buy-down credit?
- What does the HOA fee cover, when was the last increase, and are there any pending special assessments or reserve-fund shortfalls?
- Is there a deadline driving the sale (1031 exchange, divorce, estate, relocation)? That informs how much negotiation room exists.
- The area grade is low — what's the realistic commute time and amenity access for the typical tenant pool here? Any planned neighborhood developments (good or bad) we should know about?
- What's the average days-on-market for RENTAL listings here right now (not sales)? A rising rental-DOM trend means longer vacancies and softer asking-rent achievability than the comps imply.
- What's the recent tenant-quality profile in this submarket — average credit score on applications, eviction rate, late-payment / NSF rate, and stable-employment percentage? A property-management company in the area should have these aggregated.
- How much new for-sale + rental construction is in the pipeline within 1–3 miles? Heavy new supply typically softens prices + rents 12–24 months out; constrained supply supports both.
Investment metrics
- 1% rule
- 0.51% ✗
- Cap rate
- 2.59%
- Cash-on-cash
- -13.23%
- DSCR
- 0.41
- GRM
- 16.4
CMA / ARV
- ARV (on-the-fly)
- $631,800
- Comps found
- 12
Show comp detail 12 sales within ~0.75 mi
| Address | Dist | Beds/Ba | Sqft | Sold | Price | $/sf | Match |
|---|---|---|---|---|---|---|---|
| 3 Spring Rd | 0.40mi | 3/2.5 (+1) | 1,938 (-0%) | 8mo | $610,000 | $315 | 67 |
| 323 Sudden Valley Dr | 0.33mi | 3/3.0 (+1) | 1,958 (+1%) | 9mo | $512,000 | $261 | 67 |
| 18 Inglewood Pl | 0.38mi | 2/2.0 | 1,736 (-11%) | 2mo | $565,000 | $325 | 62 |
| 54 A Honeycomb | 0.35mi | 3/2.5 (+1) | 1,749 (-10%) | 4mo | $718,000 | $411 | 57 |
| 311 Sudden Valley Dr | 0.38mi | 3/2.5 (+1) | 1,712 (-12%) | 4mo | $699,000 | $408 | 52 |
| 1 Valley Crest Way | 0.36mi | 3/2.5 (+1) | 1,716 (-12%) | 5mo | $490,000 | $286 | 52 |
| 52 Morning Glory Dr | 0.65mi | 3/2.0 (+1) | 2,086 (+7%) | 1mo | $589,000 | $282 | 52 |
| 325 Sudden Valley Dr | 0.31mi | 3/2.5 (+1) | 2,178 (+12%) | 8mo | $810,000 | $372 | 51 |
| 6 Sugarpine Pl | 0.33mi | 3/2.0 (+1) | 1,664 (-14%) | 8mo | $380,000 | $228 | 49 |
| 32 Fairway Ln | 0.67mi | 3/2.5 (+1) | 2,138 (+10%) | 8mo | $740,000 | $346 | 38 |
| 11 Fairway Ln | 0.71mi | 3/2.5 (+1) | 2,158 (+11%) | 7mo | $659,000 | $305 | 35 |
| 10 Birdie Ln | 0.61mi | 3/3.0 (+1) | 2,217 (+14%) | 8mo | $770,000 | $347 | 32 |
Match score weights: distance 35% · size 25% · config 20% · recency 20%. Top-matched comps best support the ARV.
Projected returns pro-forma
-3.0% appreciation · 0.42% rent growth · sell at horizon
- IRR
- -43.9%
- Equity multiple
- -0.33×
- Total profit
- $-148,523
- Equity at exit
- $59,641
- IRR
- -96.5%
- Equity multiple
- -1.24×
- Total profit
- $-250,342
- Equity at exit
- $34,585
Cash invested: $112,000 (down + closing). Projections, not guarantees.
Landlord ↔ Tenant lean methodology
- Overall (STATE)
- 28 Tenant-Leaning
- State Washington
- 28 Tenant-Leaning · D+8
- County
- — inherits STATE
- City
- — inherits STATE
ZIP-level market 98226
- Rents YoY
- 0.4%
- Active inventory
- 378
- Price-to-rent
- 16.4×
Monthly cashflow live
- Estimated rent
- $2,037 medium interval (Pro) →
- Mortgage (P&I)
- −$2,098
- Tax from tax record
- −$411 /mo · $4,934/yr
- Insurance
- −$167
- HOA
- −$168
- Vacancy / Maint / Mgmt
- −$428
- Net cashflow
- $-1,235
Break-even live
UW: 25.0% down · 7.5% · 30yr · 1.5% tax · 5.0% vac · 8.0% maint · 8.0% mgmt
Financing live
Cash to close
- Down payment
- $100,000
- Closing costs
- $12,000
- Reserves months
- —
- Total cash needed
- —
Loan-product check · same deal, 3 products live
Conventional
25% down · 7.5% · 30yr
- Down + closing
- —
- Monthly P&I
- —
- Monthly cashflow
- —
- DSCR
- —
- Eligible?
- —
Personal DTI + credit; lowest rate.
DSCR
20% down · 8.5% · 30yr
- Down + closing
- —
- Monthly P&I
- —
- Monthly cashflow
- —
- DSCR
- —
- Eligible?
- —
No personal income docs; deal must DSCR.
Hard money
10% down · 12.0% · 12mo
- Down + closing
- —
- Monthly P&I
- —
- Monthly cashflow
- —
- DSCR
- —
- Eligible?
- —
Short-term bridge; refi at stabilization.
HOA detail
- Monthly dues
- $168 · $2,016/yr
- Likely covers
- pool
Listing history 7 events
-
2026-05-17status Pending
-
2026-04-24status Active
-
2026-04-18status Pending
-
2026-03-31$400,000 Active
-
2001-06-27soldstatus $152,000
-
2001-06-27soldstatus $152,000
-
2000-09-17$160,000
ⓘ Source: listings_history table (triggers on properties + properties_extension) + one-shot
backfill from property_details.listing_events for pre-trigger history.
Tax reassessment forecast WA · Resets to sale price
- Current annual tax
- $4,934 · $411/mo
- Projected year-2 tax
- $4,934 · $411/mo
- Expected delta
- $0/yr ($0/mo · 0.0%)
ⓘ Screening estimate from a state-policy table — verify with the county assessor before closing.
Climate risk First Street
- Flood 1/10 Low FEMA zone X (unshaded) · 0% chance over 30 yrs
- Wildfire 3/10 Moderate
- Heat 1/10 Low 8 d/yr ≥84°F today · 18 d/yr by 30 yrs out
- Wind 1/10 Low
- Air quality 7/10 Severe 11 unhealthy d/yr today · 11 by 30 yrs out
Nearby sold comps map
Loading sold comps map…
Walkable amenities ~0.75 mi
Loading nearby amenities…
Taxation est. · year 1
- Rental income
- $24,439
- − Mortgage interest
- −$22,406
- − Property taxes
- −$4,934
- − Insurance
- −$2,000
- − Repairs & maintenance
- −$1,955
- − Management
- −$1,955
- − HOA
- −$2,016
- − Depreciation
- −$11,636
- Taxable loss
- −$22,464
- Est. tax savings @ 24.0%
- +$5,391
- After-tax cash flow
- $-9,424/yr
For passive investors: Depreciation is non-cash, so a rental often shows a tax loss while cash-flowing — sheltering income. Rental losses are passive: they offset passive income freely, and up to $25,000/yr can offset ordinary (W-2) income if you actively participate and your MAGI is under $100k (phasing out to $0 by $150k); unused losses carry forward. On sale, claimed depreciation is recaptured at up to 25%, and gains may owe capital-gains tax (a 1031 exchange can defer both). Figures are a year-1 estimate at your 24.0% rate — not tax advice; consult a CPA.
Schools (NCES district)
- District
- Bellingham School District
- NCES district ID
- 5300420
- Math proficiency
- 47% ▼ -6.00%
- Reading proficiency
- 63% ▼ -1.00%
- Median HH income
- $47,678
- Composite
- 48.49/100
- National rank
- #4632
- State rank
- #106 of 291 in WA
Livability — Sudden Valley
- Score
- 68/100
- State rank
- #285
- US rank
- #9937
Category grades
Schools grade is shown separately in the Schools card above.
Census & demographics
- Census place
- Sudden Valley, WA
- County
- Whatcom County · 209,776 people
- Metro
- Bellingham, WA
- Population (ZIP)
- 46,782
- Household income
- $79,375
- Rent vs Own
- Severe rent burden
- 2061.0
Population outlook (Whatcom County) Hauer SSP2
- Today (2025)
- 240,408 people
- By 2030
- 254,667 · +5.9%
- By 2040
- 281,365 · +17.0%
- By 2050
- 307,592 · +27.9%
- By 2075
- 375,576 · +56.2%
- By 2100
- 421,637 · +75.4%
Race, ethnicity, and origin ACS 2023
- Neighborhood character
- Predominantly White (72%)
- Race & ethnicity
- White 72% Two or more races 10% Hispanic / Latino 9% Asian 6% Native American 5% Black 1%
- Hispanic origin (detail)
- Mexican 6%
- Common ancestry
- Portuguese 6% Iranian 4% Slovak 4%
- Foreign-born
- 11% · Canada, China, Vietnam
- Languages at home
- 88% English-only · Spanish 5% Chinese 2% Other Indo-European 1%
Political lean MEDSL · Whatcom
- 2024 margin
- Strong D (+24.9) · D 60.8% · R 35.9% · Other 3.3%
- 2008→2024 swing
- +6.9pp toward D · 2008: 18.0pp · 2024: 24.9pp
- All cycles
- 2024: D+24.9 2020: D+23.9 2016: D+17.7 2012: D+12.1 2008: D+18.0
Not yet ingested
- Civics
- —
Market trends
- HPI YoY
- ▼ -573.37%
- Current HPI
- 406.1085
- Rent YoY
- ▲ 0.42%
- Metro
- Bellingham, WA
- State GDP YoY
- ▲ 4.65%
- F500 in state
- 22
Industry mix (Fortune 500 HQ in WA)
| Industry | F500 HQs | Revenue |
|---|---|---|
| Retail | 2 | $269B |
|
||
| Technology / Retail | 1 | $638B |
|
||
| Technology | 1 | $245B |
|
||
| Telecommunications | 1 | $38B |
|
||
| Food / Beverage | 1 | $36B |
|
||
| Automotive / Trucks | 1 | $34B |
|
||
Price history
+150.0% since first listed7 events — show timeline
- 2026-05-17 Pending — NWMLS as Distributed by MLS Grid
- 2026-04-24 Relisted — NWMLS as Distributed by MLS Grid
- 2026-04-18 Pending — NWMLS as Distributed by MLS Grid
- 2026-03-31 Listed $400,000 NWMLS as Distributed by MLS Grid
- 2001-06-27 Sold (Public Records) $152,000 Public Records
- 2001-06-27 Sold (MLS) $152,000 NWMLS as Distributed by MLS Grid
- 2000-09-17 Listed $160,000 NWMLS as Distributed by MLS Grid
Property tax history
+5.9%/yrLatest (2026): $4,934 · +8.6% YoY. Source: county tax records.
Cash-flow waterfall
monthlySold comps — $/sqft
last 12 mo · ≤1 miLoading sold comps…