431 Well St · Marlin, TX
Flood risk 1/10 · Minimal
- FEMA flood zone
- X
- Chance of flooding over 30 yrs
- 0.0%
- Est. flood insurance / yr
- $507 – $1,088
Fire risk 3/10 · Minor
- Est. fire insurance / yr
- $1,222 – $2,270
Heat risk 7/10 · Major
- Hot days now (above 109°F)
- 7 days/yr
- Hot days in 30 yrs
- 23 days/yr
Wind risk 6/10 · Moderate
- Chance of severe wind over 30 yrs
- 76.0%
Air-quality risk 1/10 · Minimal
- Unhealthy air days now
- 0 days/yr
- Unhealthy air days in 30 yrs
- 0 days/yr
Risk factors via First Street. Map © Google.
Why this score? — see what drove the D+ grade
The composite is a weighted blend of 9 inputs, each scored 0–100. Each bar is that input's sub-score; the figure is the points it added to the 100-point composite (weight × sub-score).
- Cash flow +15.0/30.0
- ARV discount +7.5/15.0
- Appreciation +7.1/10.0
- 1% rule +5.0/10.0
- DSCR +5.0/10.0
- Livability +3.0/5.0
- Rent growth +2.5/5.0
- Condition / age +2.5/5.0
- Schools +1.7/10.0
$14,500
🖨 Deal sheet 📄 Offer letter ✓ Due diligence
Listing remarks MLS
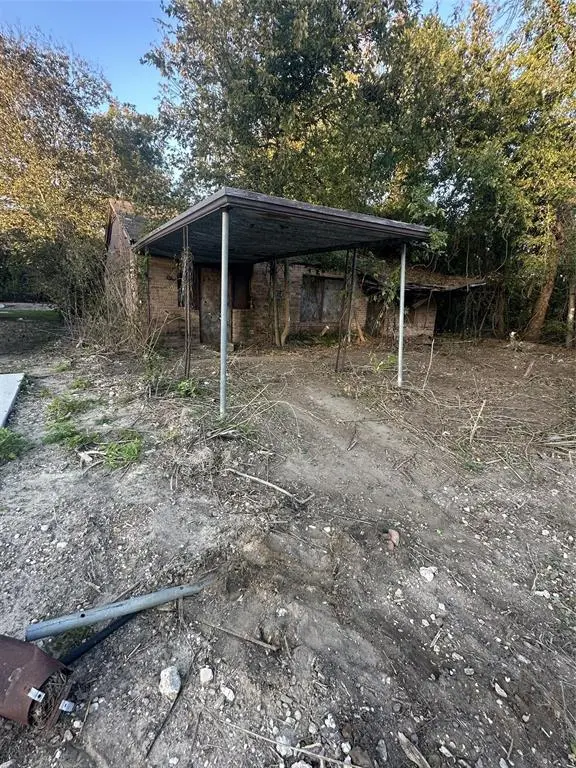
431 Wells St, Marlin, TX 76661 is a sf home that contains 1,040 sq ft with 0.17 ac lot. Investment Special! Opportunity awaits at 431 Wells St in Marlin, TX. This property is being sold AS-IS and offers strong potential for investors, renovators, or buyers looking for a value-add project. Located on a residential street with convenient access to local amenities, and downtown Marlin and 30 minutes from Waco and a block from the local H-E-B. With the right vision and updates, this property could be a great rental, flip, or long-term hold. No repairs will be made by seller
Key facts
- Close to schools
- Close to h-e-b
- 7,492 sq ft lot
Tags
Neighborhood map
What this means for you Summary
Snapshot
- This is a 4-bed/1.0-bath single-family listed at $14k.
Deal economics
- At list price, monthly cash flow is $851 ($10k/yr) — positive.
- The deal already cash-flows at list — no discount required.
- Meets the 1% rule at list price ($1k rent vs $14k).
- Recommended offer: $13k (9.0% below list) — sets the bar for market timing.
- Cap rate 76.7% vs local median 5.7% in Marlin — top-decile yield for the area; either an underpriced asset or a hidden risk that comps aren't pricing in. Stress-test before assuming the spread holds.
Location & tenants
- Location reads 59/100 on livability (#1,146 in TX) — a working-class tenant base; expect higher turnover. Strengths: cost of living A+, crime B+, housing B+; Watch: schools F, amenities F, commute F.
- Marlin ISD (town): math 21% / reading 22% proficiency, ranked #779 of 826 in TX (top 94%) — low school quality limits family demand, transient renter base, plan for 1-2y turnover; 84% free/reduced lunch — lower-income household profile, screen leases tightly.
- Market conditions: 122 active listings in the ZIP; 4 units permitted in Falls County in 2024 (0 in 5+ unit buildings).
Forward outlook
- In year one you build about $705 of equity ($100 loan paydown + $605 appreciation (4.2% local appreciation)).
- Falls County population projected at -14% by 2050 — secular population decline; favor cash flow + early exit over multi-decade hold.
- At projected returns (4.2% appreciation + 3.0% rent growth), your $4k cash investment doubles in ~1 year — after that, you're playing with house money.
Negotiation context
- It's been on market 114 days — a 9% lower offer ($13k) is reasonable based on typical stale-listing flexibility.
- 2 sale attempts since 3y ago; this cycle's ask has dropped $3k (19%) from the opening price — seller is motivated, your offer sets the floor, not the list.
Risks & watch-outs
- Watch-outs: built in 1950 — expect roof / HVAC / electrical / plumbing capex.
- Climate carrying-cost: major wind risk, 76% chance of damaging wind over 30y; extreme-heat days projected 7→23/yr by 2055 (HVAC capex compounding) — expect insurance premiums to compound above CPI over the hold.
Questions for the listing agent
- It's been on market 114 days. Have you received any prior offers? Is the seller open to a 9% concession, seller financing, or rate buy-down credit?
- Built in 1950 — when were the roof, HVAC, electrical panel, plumbing, and water heater last replaced?
- Why hasn't it sold? Are there any deal-killer items the seller is aware of (foundation, flood, title, zoning, code violations)?
- Is there a deadline driving the sale (1031 exchange, divorce, estate, relocation)? That informs how much negotiation room exists.
- Schools are F-rated, which usually means shorter tenancies and higher turnover. Who's the typical renter profile here, and what's been the actual vacancy rate?
- The area grade is low — what's the realistic commute time and amenity access for the typical tenant pool here? Any planned neighborhood developments (good or bad) we should know about?
- What's the average days-on-market for RENTAL listings here right now (not sales)? A rising rental-DOM trend means longer vacancies and softer asking-rent achievability than the comps imply.
- What's the recent tenant-quality profile in this submarket — average credit score on applications, eviction rate, late-payment / NSF rate, and stable-employment percentage? A property-management company in the area should have these aggregated.
- How much new for-sale + rental construction is in the pipeline within 1–3 miles? Heavy new supply typically softens prices + rents 12–24 months out; constrained supply supports both.
Investment metrics
- 1% rule
- 8.28% ✓
- Cap rate
- 76.75%
- Cash-on-cash
- 251.62%
- DSCR
- 12.20
- GRM
- 1.0
CMA / ARV
- ARV (median comp)
- $78,682
- List price
- $14,500
- Delta
- -81.57%
- Verdict
- UNDERPRICED
- Comps
- 15 within 1.0 mi
Show comp detail 4 sales within ~0.75 mi
| Address | Dist | Beds/Ba | Sqft | Sold | Price | $/sf | Match |
|---|---|---|---|---|---|---|---|
| 213 Capps St | 0.46mi | 3/1.5 (-1) | 1,004 (-4%) | 11mo | $79,000 | $79 | 57 |
| 911 Chambers St | 0.56mi | 3/1.0 (-1) | 1,147 (+10%) | 7mo | $39,999 | $35 | 46 |
| 812 Capps St | 0.52mi | 3/1.0 (-1) | 1,109 (+7%) | 22mo | $95,000 | $86 | 41 |
| 700 N Gresham St | 0.65mi | 3/1.0 (-1) | 920 (-12%) | 22mo | $29,500 | $32 | 27 |
Match score weights: distance 35% · size 25% · config 20% · recency 20%. Top-matched comps best support the ARV.
Projected returns pro-forma
4.17% appreciation · 3.0% rent growth · sell at horizon
- IRR
- —
- Equity multiple
- 15.02×
- Total profit
- $56,902
- Equity at exit
- $7,497
- IRR
- —
- Equity multiple
- 31.92×
- Total profit
- $125,524
- Equity at exit
- $12,378
Cash invested: $4,060 (down + closing). Projections, not guarantees.
Landlord ↔ Tenant lean methodology
- Overall (STATE)
- 87 Strongly Landlord-Friendly
- State Texas
- 87 Strongly Landlord-Friendly · R+5
- County
- — inherits STATE
- City
- — inherits STATE
ZIP-level market 76661
- Home prices YoY
- 3.4%
- Active inventory
- 122
- Price-to-rent
- 1.0×
Monthly cashflow live
- Estimated rent
- $1,200 medium interval (Pro) →
- Mortgage (P&I)
- −$76
- Tax from tax record
- −$15 /mo · $180/yr
- Insurance
- −$6
- HOA
- −$0
- Vacancy / Maint / Mgmt
- −$252
- Net cashflow
- $851
Break-even live
UW: 25.0% down · 7.5% · 30yr · 1.5% tax · 5.0% vac · 8.0% maint · 8.0% mgmt
Financing live
Cash to close
- Down payment
- $3,625
- Closing costs
- $435
- Reserves months
- —
- Total cash needed
- —
Loan-product check · same deal, 3 products live
Conventional
25% down · 7.5% · 30yr
- Down + closing
- —
- Monthly P&I
- —
- Monthly cashflow
- —
- DSCR
- —
- Eligible?
- —
Personal DTI + credit; lowest rate.
DSCR
20% down · 8.5% · 30yr
- Down + closing
- —
- Monthly P&I
- —
- Monthly cashflow
- —
- DSCR
- —
- Eligible?
- —
No personal income docs; deal must DSCR.
Hard money
10% down · 12.0% · 12mo
- Down + closing
- —
- Monthly P&I
- —
- Monthly cashflow
- —
- DSCR
- —
- Eligible?
- —
Short-term bridge; refi at stabilization.
Listing history 14 events
-
2026-06-13status $14,500 Pending 114 DOM
-
2026-06-10days on market $14,500 Active 114 DOM
-
2026-06-09days on market $14,500 Active 113 DOM
-
2026-06-08days on market $14,500 Active 112 DOM
-
2026-06-07days on market $14,500 Active 111 DOM
-
2026-06-03days on market $14,500 Active 107 DOM
-
2026-06-02days on market $14,500 Active 106 DOM
-
2026-06-01days on market $14,500 Active 105 DOM
-
2026-05-31days on market $14,500 Active 104 DOM
-
2026-05-30days on market $14,500 Active 103 DOM
-
2026-04-03price $14,500 580-char remark
Show marketing remark (580 chars)
431 Wells St, Marlin, TX 76661 is a sf home that contains 1,040 sq ft with 0.17 ac lot. Investment Special! Opportunity awaits at 431 Wells St in Marlin, TX. This property is being sold AS-IS and offers strong potential for investors, renovators, or buyers looking for a value-add project. Located on a residential street with convenient access to local amenities, and downtown Marlin and 30 minutes from Waco and a block from the local H-E-B. With the right vision and updates, this property could be a great rental, flip, or long-term hold. No repairs will be made by seller
-
2026-02-16$17,900 Active 580-char remark
Show marketing remark (580 chars)
431 Wells St, Marlin, TX 76661 is a sf home that contains 1,040 sq ft with 0.17 ac lot. Investment Special! Opportunity awaits at 431 Wells St in Marlin, TX. This property is being sold AS-IS and offers strong potential for investors, renovators, or buyers looking for a value-add project. Located on a residential street with convenient access to local amenities, and downtown Marlin and 30 minutes from Waco and a block from the local H-E-B. With the right vision and updates, this property could be a great rental, flip, or long-term hold. No repairs will be made by seller
-
2023-08-14historical
-
2023-08-09$20,000
ⓘ Source: listings_history table (triggers on properties + properties_extension) + one-shot
backfill from property_details.listing_events for pre-trigger history.
Tax reassessment forecast TX · Resets to sale price
- Current annual tax
- $180 · $15/mo
- Projected year-2 tax
- $265 · $22/mo
- Expected delta
- +$85/yr (+$7/mo · 47.5%)
ⓘ Screening estimate from a state-policy table — verify with the county assessor before closing.
Climate risk First Street
- Flood 1/10 Low FEMA zone X · 0% chance over 30 yrs
- Wildfire 3/10 Moderate
- Heat 7/10 Severe 7 d/yr ≥109°F today · 23 d/yr by 30 yrs out
- Wind 6/10 Major 76% chance of damaging wind over 30 yrs
- Air quality 1/10 Low 0 unhealthy d/yr today · 0 by 30 yrs out
Nearby sold comps map
Loading sold comps map…
Walkable amenities ~0.75 mi
Loading nearby amenities…
Taxation est. · year 1
- Rental income
- $14,406
- − Mortgage interest
- −$812
- − Property taxes
- −$180
- − Insurance
- −$72
- − Repairs & maintenance
- −$1,152
- − Management
- −$1,152
- − Depreciation
- −$422
- Taxable income
- $10,615
- Est. tax owed @ 24.0%
- −$2,547
- After-tax cash flow
- $7,668/yr
For passive investors: Depreciation is non-cash, so a rental often shows a tax loss while cash-flowing — sheltering income. Rental losses are passive: they offset passive income freely, and up to $25,000/yr can offset ordinary (W-2) income if you actively participate and your MAGI is under $100k (phasing out to $0 by $150k); unused losses carry forward. On sale, claimed depreciation is recaptured at up to 25%, and gains may owe capital-gains tax (a 1031 exchange can defer both). Figures are a year-1 estimate at your 24.0% rate — not tax advice; consult a CPA.
Schools (NCES district)
- District
- Marlin ISD
- NCES district ID
- 4829130
- Math proficiency
- 21% ▲ 2.00%
- Reading proficiency
- 22% ▲ 6.00%
- Median HH income
- $29,255
- Composite
- 17.18/100
- National rank
- #9106
- State rank
- #779 of 826 in TX
Livability — Marlin
- Score
- 59/100
- State rank
- #1146
- US rank
- #20161
Category grades
Schools grade is shown separately in the Schools card above.
Census & demographics
- Census place
- Marlin, TX
- Population (ZIP)
- 7,266
Population outlook (Falls County) Hauer SSP2
- Today (2025)
- 15,782 people
- By 2030
- 15,209 · -3.6%
- By 2040
- 14,276 · -9.5%
- By 2050
- 13,645 · -13.5%
- By 2075
- 13,724 · -13.0%
- By 2100
- 13,005 · -17.6%
Race, ethnicity, and origin ACS 2023
- Neighborhood character
- Highly diverse neighborhood (Simpson 0.70)
- Race & ethnicity
- Black 35% Hispanic / Latino 30% White 30% Two or more races 13% Asian 3%
- Hispanic origin (detail)
- Mexican 29%
- Common ancestry
- Romanian 2% Lithuanian 1% Italian 1%
- Foreign-born
- 7% · Canada
- Languages at home
- 84% English-only · Spanish 15%
Political lean MEDSL · Falls
- 2024 margin
- Solid R (+44.7) · D 27.3% · R 72.0%
- 2008→2024 swing
- -25.0pp toward R · 2008: -19.7pp · 2024: -44.7pp
- All cycles
- 2024: R+44.7 2020: R+37.1 2016: R+33.6 2012: R+24.4 2008: R+19.7
Not yet ingested
- Civics
- —
Market trends
- HPI YoY
- ▲ 4.17%
- Current HPI
- 126.9217
- Rent YoY
- —
- Metro
- —
- State GDP YoY
- ▲ 3.95%
- F500 in state
- 110
Industry mix (Fortune 500 HQ in TX)
| Industry | F500 HQs | Revenue |
|---|---|---|
| Energy | 16 | $1,198B |
|
||
| Technology | 5 | $198B |
|
||
| Engineering / Construction | 4 | $72B |
|
||
| Energy Services | 3 | $60B |
|
||
| Utilities | 3 | $41B |
|
||
| Healthcare | 2 | $330B |
|
||
Price history
-27.5% since first listed4 events — show timeline
- 2026-04-03 Price Changed $14,500 NTREIS
- 2026-02-16 Listed $17,900 NTREIS
- 2023-08-14 Listing Removed — NTREIS
- 2023-08-09 Listed $20,000 NTREIS
Property tax history
-7.0%/yrLatest (2025): $180 · -9.4% YoY. Source: county tax records.
Cash-flow waterfall
monthlySold comps — $/sqft
last 12 mo · ≤1 miLoading sold comps…