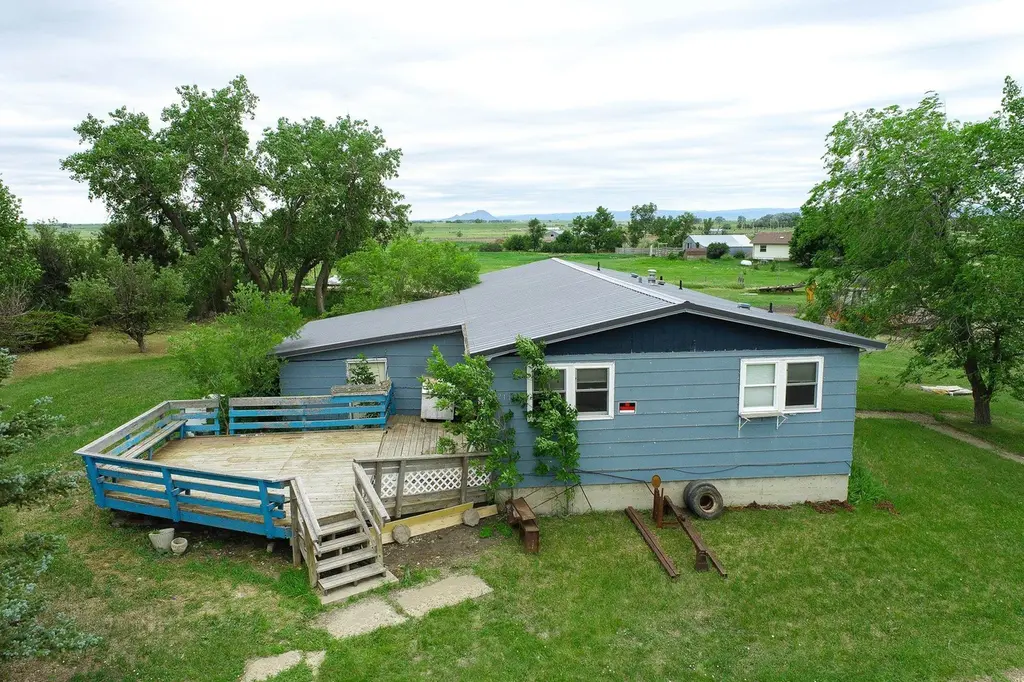
211 Ash St · Newell, SD
Flood risk No data
- FEMA flood zone
- —
- Chance of flooding over 30 yrs
- —
- Est. flood insurance / yr
- —
Fire risk No data
- Est. fire insurance / yr
- —
Heat risk No data
- Hot days now (above threshold)
- —
- Hot days in 30 yrs
- —
Wind risk No data
- Chance of severe wind over 30 yrs
- —
Air-quality risk No data
- Unhealthy air days now
- —
- Unhealthy air days in 30 yrs
- —
Risk factors via First Street. Map © Google.
Why this score? — see what drove the C+ grade
The composite is a weighted blend of 9 inputs, each scored 0–100. Each bar is that input's sub-score; the figure is the points it added to the 100-point composite (weight × sub-score).
- Cash flow +25.7/30.0
- DSCR +8.6/10.0
- 1% rule +8.2/10.0
- ARV discount +7.5/15.0
- Appreciation +5.0/10.0
- Livability +3.1/5.0
- Rent growth +2.5/5.0
- Condition / age +2.5/5.0
- Schools +1.8/10.0
$99,000
🖨 Deal sheet 📄 Offer letter ✓ Due diligence
Listing remarks MLS
Listed by Joanna Kapsch with Real Broker, LLC 605-580-0072. This property offers the perfect opportunity for investors or buyers looking to create their own home, sitting on 1.67 acres with beautiful views. The existing house is ready for a full transformation. Whether you're envisioning a complete renovation or building equity through updates, this fixer-upper is full of possibilities and sits on a spacious lot! Enjoy the peace of country living with room to grow all while being just a short drive from town. The basement offers additional space with non-conforming rooms. Bring your vision!
Key facts
- Complete renovation
- Spacious lot
- 1.67 acres
Tags
Neighborhood map
What this means for you Summary
Snapshot
- This is a 3-bed/1.5-bath single-family listed at $99k.
Deal economics
- At list price, monthly cash flow is $239 ($3k/yr) — positive.
- The deal already cash-flows at list — no discount required.
- Meets the 1% rule at list price ($1k rent vs $99k).
- Recommended offer: $87k (12.0% below list) — sets the bar for market timing.
Location & tenants
- Location reads 62/100 on livability (#220 in SD) — a middle-class / working-renter tenant base. Strengths: cost of living A+, housing A+; Watch: schools F, crime F, amenities F.
- Newell School District 09-2 (rural): math 10% / reading 25% proficiency, ranked #141 of 148 in SD (top 95%) — low school quality limits family demand, transient renter base, plan for 1-2y turnover.
- Market conditions: 18 active listings in the ZIP; 59 units permitted in Butte County in 2024 (0 in 5+ unit buildings).
Forward outlook
- In year one you build about $4k of equity ($684 loan paydown + $3k appreciation (3.0% local appreciation)).
- At projected returns (3.0% appreciation + 3.0% rent growth), your $28k cash investment doubles in ~4 years — after that, you're playing with house money.
- By year 9, paydown + projected appreciation supports a ~$31k cash-out refi (75% LTV) — recoverable capital for the next deal without selling this one.
Negotiation context
- It's been on market 359 days — a 12% lower offer ($87k) is reasonable based on typical stale-listing flexibility.
Risks & watch-outs
- Watch-outs: property tax is 2.8% of price.
Questions for the listing agent
- It's been on market 359 days. Have you received any prior offers? Is the seller open to a 12% concession, seller financing, or rate buy-down credit?
- Built in 1975 — when were the roof, HVAC, electrical panel, plumbing, and water heater last replaced?
- Property tax is high relative to price — has the assessment been appealed recently, and will the sale trigger a re-assessment?
- Why hasn't it sold? Are there any deal-killer items the seller is aware of (foundation, flood, title, zoning, code violations)?
- Is there a deadline driving the sale (1031 exchange, divorce, estate, relocation)? That informs how much negotiation room exists.
- Schools are F-rated, which usually means shorter tenancies and higher turnover. Who's the typical renter profile here, and what's been the actual vacancy rate?
- Crime grade is F in this area — have there been break-ins, vandalism, or insurance claims at this property in the last 3 years? What carrier currently insures it and at what premium?
- What's the average days-on-market for RENTAL listings here right now (not sales)? A rising rental-DOM trend means longer vacancies and softer asking-rent achievability than the comps imply.
- What's the recent tenant-quality profile in this submarket — average credit score on applications, eviction rate, late-payment / NSF rate, and stable-employment percentage? A property-management company in the area should have these aggregated.
- How much new for-sale + rental construction is in the pipeline within 1–3 miles? Heavy new supply typically softens prices + rents 12–24 months out; constrained supply supports both.
Investment metrics
- 1% rule
- 1.32% ✓
- Cap rate
- 9.19%
- Cash-on-cash
- 10.33%
- DSCR
- 1.46
- GRM
- 6.3
CMA / ARV
- ARV (median comp)
- $233,002
- List price
- $99,000
- Delta
- -57.51%
- Verdict
- UNDERPRICED
- Comps
- 13 within 1.0 mi
Show comp detail 2 sales within ~0.75 mi
| Address | Dist | Beds/Ba | Sqft | Sold | Price | $/sf | Match |
|---|---|---|---|---|---|---|---|
| 502 7th St | 0.59mi | 4/2.0 (+1) | 2,464 (-1%) | 4mo | $268,000 | $109 | 59 |
| 411 7th St | 0.55mi | 4/2.0 (+1) | 2,632 (+5%) | 22mo | $275,000 | $104 | 40 |
Match score weights: distance 35% · size 25% · config 20% · recency 20%. Top-matched comps best support the ARV.
Projected returns pro-forma
3.0% appreciation · 3.0% rent growth · sell at horizon
- IRR
- 17.2%
- Equity multiple
- 1.98×
- Total profit
- $27,214
- Equity at exit
- $44,515
- IRR
- 18.7%
- Equity multiple
- 3.73×
- Total profit
- $75,707
- Equity at exit
- $68,602
Cash invested: $27,720 (down + closing). Projections, not guarantees.
Landlord ↔ Tenant lean methodology
- Overall (STATE)
- 83 Strongly Landlord-Friendly
- State South Dakota
- 83 Strongly Landlord-Friendly · R+16
- County
- — inherits STATE
- City
- — inherits STATE
ZIP-level market 57760
- Active inventory
- 18
- Price-to-rent
- 6.3×
Monthly cashflow live
- Estimated rent
- $1,305 medium interval (Pro) →
- Mortgage (P&I)
- −$519
- Tax from tax record
- −$232 /mo · $2,778/yr
- Insurance
- −$41
- HOA
- −$0
- Vacancy / Maint / Mgmt
- −$274
- Net cashflow
- $239
Break-even live
UW: 25.0% down · 7.5% · 30yr · 1.5% tax · 5.0% vac · 8.0% maint · 8.0% mgmt
Financing live
Cash to close
- Down payment
- $24,750
- Closing costs
- $2,970
- Reserves months
- —
- Total cash needed
- —
Loan-product check · same deal, 3 products live
Conventional
25% down · 7.5% · 30yr
- Down + closing
- —
- Monthly P&I
- —
- Monthly cashflow
- —
- DSCR
- —
- Eligible?
- —
Personal DTI + credit; lowest rate.
DSCR
20% down · 8.5% · 30yr
- Down + closing
- —
- Monthly P&I
- —
- Monthly cashflow
- —
- DSCR
- —
- Eligible?
- —
No personal income docs; deal must DSCR.
Hard money
10% down · 12.0% · 12mo
- Down + closing
- —
- Monthly P&I
- —
- Monthly cashflow
- —
- DSCR
- —
- Eligible?
- —
Short-term bridge; refi at stabilization.
Listing history 17 events
-
2026-06-18days on market $99,000 Active 359 DOM
-
2026-06-17days on market $99,000 Active 358 DOM
-
2026-06-16days on market $99,000 Active 357 DOM
-
2026-06-15days on market $99,000 Active 356 DOM
-
2026-06-13days on market $99,000 Active 354 DOM
-
2026-06-12days on market $99,000 Active 353 DOM
-
2026-06-09pricedays on market $99,000 Active 350 DOM
-
2026-06-08days on market $129,900 Active 349 DOM
-
2026-06-07days on market $129,900 Active 348 DOM
-
2026-06-05days on market $129,900 Active 346 DOM
-
2026-06-04days on market $129,900 Active 344 DOM
-
2026-06-02days on market $129,900 Active 343 DOM
-
2026-06-01days on market $129,900 Active 342 DOM
-
2026-05-31days on market $129,900 Active 341 DOM
-
2026-05-31days on market $129,900 Active 340 DOM
-
2025-07-28price $129,900 597-char remark
Show marketing remark (597 chars)
Listed by Joanna Kapsch with Real Broker, LLC 605-580-0072. This property offers the perfect opportunity for investors or buyers looking to create their own home, sitting on 1.67 acres with beautiful views. The existing house is ready for a full transformation. Whether you're envisioning a complete renovation or building equity through updates, this fixer-upper is full of possibilities and sits on a spacious lot! Enjoy the peace of country living with room to grow all while being just a short drive from town. The basement offers additional space with non-conforming rooms. Bring your vision!
-
2025-06-24$149,999 Active 597-char remark
Show marketing remark (597 chars)
Listed by Joanna Kapsch with Real Broker, LLC 605-580-0072. This property offers the perfect opportunity for investors or buyers looking to create their own home, sitting on 1.67 acres with beautiful views. The existing house is ready for a full transformation. Whether you're envisioning a complete renovation or building equity through updates, this fixer-upper is full of possibilities and sits on a spacious lot! Enjoy the peace of country living with room to grow all while being just a short drive from town. The basement offers additional space with non-conforming rooms. Bring your vision!
ⓘ Source: listings_history table (triggers on properties + properties_extension) + one-shot
backfill from property_details.listing_events for pre-trigger history.
Tax reassessment forecast SD · Resets to sale price
- Current annual tax
- $2,778 · $232/mo
- Projected year-2 tax
- $2,778 · $232/mo
- Expected delta
- $0/yr ($0/mo · 0.0%)
ⓘ Screening estimate from a state-policy table — verify with the county assessor before closing.
Nearby sold comps map
Loading sold comps map…
Walkable amenities ~0.75 mi
Loading nearby amenities…
Taxation est. · year 1
- Rental income
- $15,655
- − Mortgage interest
- −$5,546
- − Property taxes
- −$2,778
- − Insurance
- −$495
- − Repairs & maintenance
- −$1,252
- − Management
- −$1,252
- − Depreciation
- −$2,880
- Taxable income
- $1,451
- Est. tax owed @ 24.0%
- −$348
- After-tax cash flow
- $2,516/yr
For passive investors: Depreciation is non-cash, so a rental often shows a tax loss while cash-flowing — sheltering income. Rental losses are passive: they offset passive income freely, and up to $25,000/yr can offset ordinary (W-2) income if you actively participate and your MAGI is under $100k (phasing out to $0 by $150k); unused losses carry forward. On sale, claimed depreciation is recaptured at up to 25%, and gains may owe capital-gains tax (a 1031 exchange can defer both). Figures are a year-1 estimate at your 24.0% rate — not tax advice; consult a CPA.
Schools (NCES district)
- District
- Newell School District 09-2
- NCES district ID
- 4650850
- Math proficiency
- 10% ▼ -10.00%
- Reading proficiency
- 25% ▬ 0.00%
- Median HH income
- $41,001
- Composite
- 18.3/100
- National rank
- #14060
- State rank
- #141 of 148 in SD
Livability — Newell
- Score
- 62/100
- State rank
- #220
- US rank
- #17019
Category grades
Schools grade is shown separately in the Schools card above.
Census & demographics
- Census place
- Newell, SD
- Population (ZIP)
- 1,084
Population outlook (Butte County) Hauer SSP2
- Today (2025)
- 10,598 people
- By 2030
- 10,711 · +1.1%
- By 2040
- 10,818 · +2.1%
- By 2050
- 10,874 · +2.6%
- By 2075
- 12,151 · +14.7%
- By 2100
- 15,016 · +41.7%
Race, ethnicity, and origin ACS 2023
- Neighborhood character
- Predominantly White (92%)
- Race & ethnicity
- White 92% Native American 7%
- Common ancestry
- Italian 10% Slovak 5% Serbian 4%
- Foreign-born
- 1%
Political lean MEDSL · Butte
- 2024 margin
- Solid R (+60.6) · D 18.5% · R 79.2% · Other 2.3%
- 2008→2024 swing
- -25.0pp toward R · 2008: -35.6pp · 2024: -60.6pp
- All cycles
- 2024: R+60.6 2020: R+58.1 2016: R+61.2 2012: R+49.2 2008: R+35.6
Not yet ingested
- Civics
- —
Market trends
- HPI YoY
- —
- Current HPI
- —
- Rent YoY
- —
- Metro
- —
- State GDP YoY
- ▲ 0.70%
- F500 in state
- 2
Industry mix (Fortune 500 HQ in SD)
| Industry | F500 HQs | Revenue |
|---|---|---|
| Utilities | 1 | $1B |
|
||
Price history
-13.4% since first listed2 events — show timeline
- 2025-07-28 Price Changed $129,900 MRAOR
- 2025-06-24 Listed $149,999 MRAOR
Property tax history
+46.9%/yrLatest (2025): $2,778 · +2848.5% YoY. Source: county tax records.
Cash-flow waterfall
monthlySold comps — $/sqft
last 12 mo · ≤1 miLoading sold comps…