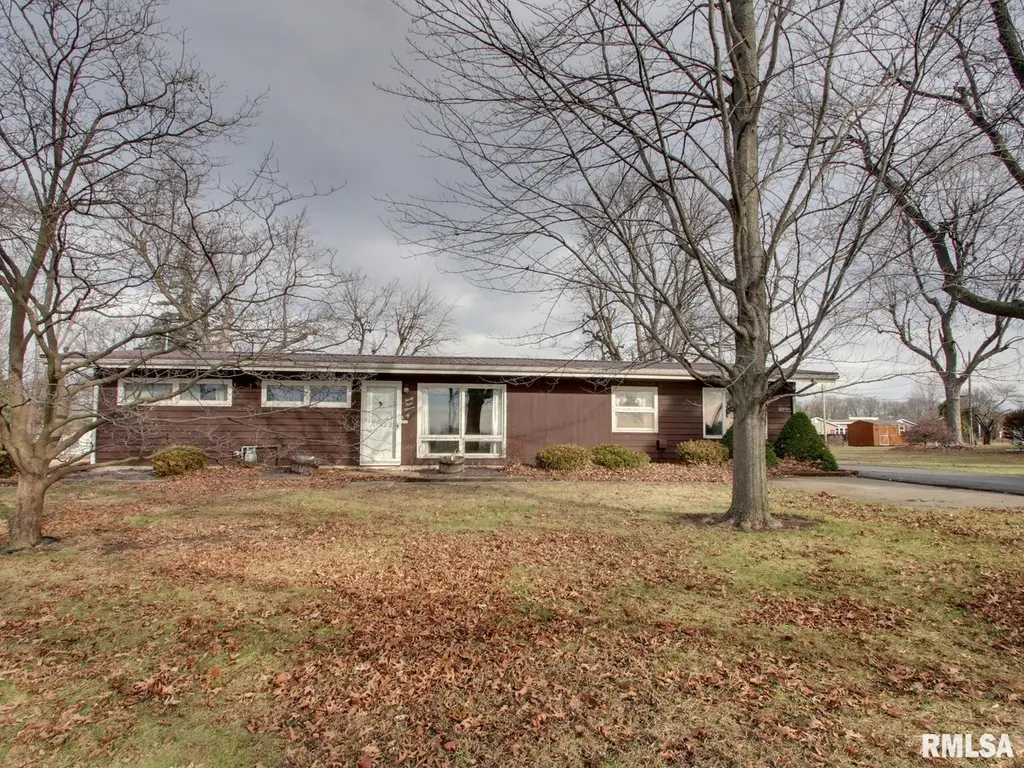
3411 Payson Rd · Quincy, IL
Flood risk 1/10 · Minimal
- FEMA flood zone
- X (unshaded)
- Chance of flooding over 30 yrs
- 0.0%
- Est. flood insurance / yr
- $473 – $860
Fire risk 1/10 · Minimal
- Est. fire insurance / yr
- $804 – $1,492
Heat risk 4/10 · Minor
- Hot days now (above 106°F)
- 7 days/yr
- Hot days in 30 yrs
- 17 days/yr
Wind risk 2/10 · Minimal
- Chance of severe wind over 30 yrs
- —
Air-quality risk 2/10 · Minimal
- Unhealthy air days now
- 1 days/yr
- Unhealthy air days in 30 yrs
- 1 days/yr
Risk factors via First Street. Map © Google.
Why this score? — see what drove the D grade
The composite is a weighted blend of 9 inputs, each scored 0–100. Each bar is that input's sub-score; the figure is the points it added to the 100-point composite (weight × sub-score).
- ARV discount +15.0/15.0
- Cash flow +10.1/30.0
- Livability +3.4/5.0
- DSCR +2.9/10.0
- 1% rule +2.8/10.0
- Rent growth +2.5/5.0
- Condition / age +2.5/5.0
- Schools +2.2/10.0
- Appreciation +0.0/10.0
$169,900
🖨 Deal sheet 📄 Offer letter ✓ Due diligence
Listing remarks MLS
Spacious 4-bedroom, 2-bath ranch offering great potential for the right buyer! Situated on a half-acre lot at the edge of town, this home provides a great setting while still being within walking distance to the school. Features include an oversized 2-car garage plus a 2-car carport—perfect for vehicles, storage, or projects. Recent improvements include new central air in 2024 and a new waterline in 2023. The property does need TLC, making it an excellent opportunity to add value and customize to your taste. There is a well on the property, though it is not currently in use. Don’t miss this chance to create your ideal home in a convenient location!
Key facts
- Half-acre lot
- Well on the property
- New waterline
Tags
Neighborhood map
What this means for you Summary
Snapshot
- This is a 4-bed/2.0-bath single-family listed at $170k.
Deal economics
- At list price, monthly cash flow is $-101 ($-1k/yr) — negative.
- To cash-flow at today's rent, offer at most $152k (10.5% below list).
- To meet the 1% rule (rent ≥ 1% of price), the offer needs to be $133k (22.0% below list).
- Recommended offer: $133k (22.0% below list) — sets the bar for 1% rule.
- Cap rate 5.6% vs local median 4.3% in Quincy — meaningfully above typical; check what's discounted (condition, days-on-market, listing class) to confirm the premium yield is real.
Location & tenants
- Location reads 67/100 on livability (#506 in IL) — a middle-class / working-renter tenant base. Strengths: cost of living A+, housing A+; Watch: schools D+, crime D, employment D.
- Quincy SD 172 (town): math 24% / reading 27% proficiency, ranked #328 of 620 in IL (top 53%) — low school quality limits family demand, transient renter base, plan for 1-2y turnover.
- Market conditions: 105 active listings in the ZIP; 68 units permitted in Adams County in 2024 (0 in 5+ unit buildings).
Forward outlook
- Local home prices are declining (-3.0%/yr); year-one equity from $1k of loan paydown is wiped out by about $5k of value loss. Plan a longer hold.
- Adams County population projected at -14% by 2050 — secular population decline; favor cash flow + early exit over multi-decade hold.
Negotiation context
- It's been on market 149 days — a 12% lower offer ($150k) is reasonable based on typical stale-listing flexibility.
- 3 sale attempts; this cycle's ask has dropped $10k (6%) from the opening price — seller is motivated, your offer sets the floor, not the list.
Questions for the listing agent
- What do current leases actually rent for vs. the listed asking? Can we see a recent rent roll and the last 12 months of T-12 income?
- It's been on market 149 days. Have you received any prior offers? Is the seller open to a 22% concession, seller financing, or rate buy-down credit?
- Why hasn't it sold? Are there any deal-killer items the seller is aware of (foundation, flood, title, zoning, code violations)?
- Is there a deadline driving the sale (1031 exchange, divorce, estate, relocation)? That informs how much negotiation room exists.
- Schools are D-rated, which usually means shorter tenancies and higher turnover. Who's the typical renter profile here, and what's been the actual vacancy rate?
- Crime grade is D in this area — have there been break-ins, vandalism, or insurance claims at this property in the last 3 years? What carrier currently insures it and at what premium?
- The area grade is low — what's the realistic commute time and amenity access for the typical tenant pool here? Any planned neighborhood developments (good or bad) we should know about?
- What's the average days-on-market for RENTAL listings here right now (not sales)? A rising rental-DOM trend means longer vacancies and softer asking-rent achievability than the comps imply.
- What's the recent tenant-quality profile in this submarket — average credit score on applications, eviction rate, late-payment / NSF rate, and stable-employment percentage? A property-management company in the area should have these aggregated.
- How much new for-sale + rental construction is in the pipeline within 1–3 miles? Heavy new supply typically softens prices + rents 12–24 months out; constrained supply supports both.
Investment metrics
- 1% rule
- 0.78% ✗
- Cap rate
- 5.58%
- Cash-on-cash
- -2.54%
- DSCR
- 0.89
- GRM
- 10.7
CMA / ARV
- ARV (median comp)
- $234,743
- List price
- $169,900
- Delta
- -27.62%
- Verdict
- UNDERPRICED
- Comps
- 16 within 1.0 mi
Show comp detail 4 sales within ~0.75 mi
| Address | Dist | Beds/Ba | Sqft | Sold | Price | $/sf | Match |
|---|---|---|---|---|---|---|---|
| 3411 Payson Rd | 0.00mi | 4/2.0 | 1,620 (0%) | 0mo | $150,000 | $93 | 100 |
| 3413 Lewis Dr | 0.08mi | 3/1.0 (-1) | 1,539 (-5%) | 11mo | $172,000 | $112 | 70 |
| 3420 Westview Dr | 0.34mi | 3/1.5 (-1) | 1,714 (+6%) | 21mo | $212,000 | $124 | 50 |
| 2124 S 40th | 0.68mi | 4/3.0 | 1,449 (-11%) | 8mo | $224,500 | $155 | 40 |
Match score weights: distance 35% · size 25% · config 20% · recency 20%. Top-matched comps best support the ARV.
Projected returns pro-forma
-3.0% appreciation · 3.0% rent growth · sell at horizon
- IRR
- -20.5%
- Equity multiple
- 0.29×
- Total profit
- $-33,946
- Equity at exit
- $25,333
- IRR
- -13.7%
- Equity multiple
- 0.21×
- Total profit
- $-37,808
- Equity at exit
- $14,690
Cash invested: $47,572 (down + closing). Projections, not guarantees.
Landlord ↔ Tenant lean methodology
- Overall (STATE)
- 43 Moderately Tenant-Leaning
- State Illinois
- 43 Moderately Tenant-Leaning · D+7
- County
- — inherits STATE
- City
- — inherits STATE
ZIP-level market 62305
- Active inventory
- 105
- Price-to-rent
- 10.7×
Monthly cashflow live
- Estimated rent
- $1,325 medium interval (Pro) →
- Mortgage (P&I)
- −$891
- Tax from tax record
- −$186 /mo · $2,232/yr
- Insurance
- −$71
- HOA
- −$0
- Vacancy / Maint / Mgmt
- −$278
- Net cashflow
- $-101
Break-even live
UW: 25.0% down · 7.5% · 30yr · 1.5% tax · 5.0% vac · 8.0% maint · 8.0% mgmt
Financing live
Cash to close
- Down payment
- $42,475
- Closing costs
- $5,097
- Reserves months
- —
- Total cash needed
- —
Loan-product check · same deal, 3 products live
Conventional
25% down · 7.5% · 30yr
- Down + closing
- —
- Monthly P&I
- —
- Monthly cashflow
- —
- DSCR
- —
- Eligible?
- —
Personal DTI + credit; lowest rate.
DSCR
20% down · 8.5% · 30yr
- Down + closing
- —
- Monthly P&I
- —
- Monthly cashflow
- —
- DSCR
- —
- Eligible?
- —
No personal income docs; deal must DSCR.
Hard money
10% down · 12.0% · 12mo
- Down + closing
- —
- Monthly P&I
- —
- Monthly cashflow
- —
- DSCR
- —
- Eligible?
- —
Short-term bridge; refi at stabilization.
Listing history 21 events
-
2026-06-12days on market $169,900 Under Contract 149 DOM
-
2026-06-09days on market $169,900 Under Contract 146 DOM
-
2026-06-08days on market $169,900 Under Contract 145 DOM
-
2026-06-07days on market $169,900 Under Contract 144 DOM
-
2026-06-03days on market $169,900 Under Contract 140 DOM
-
2026-06-02days on market $169,900 Under Contract 139 DOM
-
2026-06-01days on market $169,900 Under Contract 138 DOM
-
2026-05-31days on market $169,900 Under Contract 137 DOM
-
2026-05-30days on market $169,900 Under Contract 136 DOM
-
2026-05-19historical Under Contract 668-char remark
Show marketing remark (668 chars)
Spacious 4-bedroom, 2-bath ranch offering great potential for the right buyer! Situated on a half-acre lot at the edge of town, this home provides a great setting while still being within walking distance to the school. Features include an oversized 2-car garage plus a 2-car carport—perfect for vehicles, storage, or projects. Recent improvements include new central air in 2024 and a new waterline in 2023. The property does need TLC, making it an excellent opportunity to add value and customize to your taste. There is a well on the property, though it is not currently in use. Don’t miss this chance to create your ideal home in a convenient location!
-
2026-01-29price $169,900 668-char remark
Show marketing remark (668 chars)
Spacious 4-bedroom, 2-bath ranch offering great potential for the right buyer! Situated on a half-acre lot at the edge of town, this home provides a great setting while still being within walking distance to the school. Features include an oversized 2-car garage plus a 2-car carport—perfect for vehicles, storage, or projects. Recent improvements include new central air in 2024 and a new waterline in 2023. The property does need TLC, making it an excellent opportunity to add value and customize to your taste. There is a well on the property, though it is not currently in use. Don’t miss this chance to create your ideal home in a convenient location!
-
2026-01-13$179,900 Active 668-char remark
Show marketing remark (668 chars)
Spacious 4-bedroom, 2-bath ranch offering great potential for the right buyer! Situated on a half-acre lot at the edge of town, this home provides a great setting while still being within walking distance to the school. Features include an oversized 2-car garage plus a 2-car carport—perfect for vehicles, storage, or projects. Recent improvements include new central air in 2024 and a new waterline in 2023. The property does need TLC, making it an excellent opportunity to add value and customize to your taste. There is a well on the property, though it is not currently in use. Don’t miss this chance to create your ideal home in a convenient location!
-
2025-09-15historical
-
2025-08-13price $189,000
-
2025-08-13price
-
2025-08-04price $200,000
-
2025-08-04price
-
2025-07-08price $215,000
-
2025-07-08price
-
2025-06-20$225,000 Active
-
2025-06-20Active
ⓘ Source: listings_history table (triggers on properties + properties_extension) + one-shot
backfill from property_details.listing_events for pre-trigger history.
Tax reassessment forecast IL · Partial reset (capped growth)
- Current annual tax
- $2,232 · $186/mo
- Projected year-2 tax
- $3,045 · $254/mo
- Expected delta
- +$812/yr (+$68/mo · 36.4%)
ⓘ Screening estimate from a state-policy table — verify with the county assessor before closing.
Climate risk First Street
- Flood 1/10 Low FEMA zone X (unshaded) · 0% chance over 30 yrs
- Wildfire 1/10 Low
- Heat 4/10 Moderate 7 d/yr ≥106°F today · 17 d/yr by 30 yrs out
- Wind 2/10 Low
- Air quality 2/10 Low 1 unhealthy d/yr today · 1 by 30 yrs out
Nearby sold comps map
Loading sold comps map…
Walkable amenities ~0.75 mi
Loading nearby amenities…
Taxation est. · year 1
- Rental income
- $15,904
- − Mortgage interest
- −$9,517
- − Property taxes
- −$2,232
- − Insurance
- −$850
- − Repairs & maintenance
- −$1,272
- − Management
- −$1,272
- − Depreciation
- −$4,943
- Taxable loss
- −$4,182
- Est. tax savings @ 24.0%
- +$1,004
- After-tax cash flow
- $-206/yr
For passive investors: Depreciation is non-cash, so a rental often shows a tax loss while cash-flowing — sheltering income. Rental losses are passive: they offset passive income freely, and up to $25,000/yr can offset ordinary (W-2) income if you actively participate and your MAGI is under $100k (phasing out to $0 by $150k); unused losses carry forward. On sale, claimed depreciation is recaptured at up to 25%, and gains may owe capital-gains tax (a 1031 exchange can defer both). Figures are a year-1 estimate at your 24.0% rate — not tax advice; consult a CPA.
Schools (NCES district)
- District
- Quincy SD 172
- NCES district ID
- 1733000
- Math proficiency
- 24% ▬ 0.00%
- Reading proficiency
- 27% ▬ 0.00%
- Median HH income
- $44,132
- Composite
- 21.91/100
- National rank
- #8229
- State rank
- #328 of 620 in IL
Livability — Quincy
- Score
- 67/100
- State rank
- #506
- US rank
- #10458
Category grades
Schools grade is shown separately in the Schools card above.
Census & demographics
- City population
- 30,746
- Population (ZIP)
- 19,077
Population outlook (Adams County) Hauer SSP2
- Today (2025)
- 65,795 people
- By 2030
- 64,436 · -2.1%
- By 2040
- 61,007 · -7.3%
- By 2050
- 56,851 · -13.6%
- By 2075
- 46,424 · -29.4%
- By 2100
- 34,305 · -47.9%
Race, ethnicity, and origin ACS 2023
- Neighborhood character
- Predominantly White (95%)
- Race & ethnicity
- White 95% Black 2% Two or more races 2% Hispanic / Latino 1%
- Common ancestry
- Lithuanian 3% Slovak 2% Serbian 1%
- Foreign-born
- 1% · Canada
- Languages at home
- 98% English-only · Spanish 1%
Political lean MEDSL · Adams
- 2024 margin
- Solid R (+47.4) · D 25.6% · R 73.0% · Other 1.5%
- 2008→2024 swing
- -25.0pp toward R · 2008: -22.4pp · 2024: -47.4pp
- All cycles
- 2024: R+47.4 2020: R+46.5 2016: R+47.5 2012: R+35.2 2008: R+22.4
Not yet ingested
- Civics
- —
Market trends
- HPI YoY
- ▼ -106.58%
- Current HPI
- 144.3445
- Rent YoY
- —
- Metro
- —
- State GDP YoY
- ▲ 1.59%
- F500 in state
- 60
Industry mix (Fortune 500 HQ in IL)
| Industry | F500 HQs | Revenue |
|---|---|---|
| Insurance | 4 | $201B |
|
||
| Consumer Goods | 4 | $87B |
|
||
| Industrial Machinery | 3 | $64B |
|
||
| Healthcare | 2 | $55B |
|
||
| Retail / Pharmacy | 1 | $148B |
|
||
| Agriculture / Food | 1 | $86B |
|
||
Price history
-24.5% since first listed12 events — show timeline
- 2026-05-19 Contingent — RMLSA as Distributed by MLS Grid
- 2026-01-29 Price Changed $169,900 RMLSA as Distributed by MLS Grid
- 2026-01-13 Listed $179,900 RMLSA as Distributed by MLS Grid
- 2025-09-15 Listing Removed — MRED as Distributed by MLS Grid
- 2025-08-13 Price Changed $189,000 Quincy AOR
- 2025-08-13 Price Changed — MRED as Distributed by MLS Grid
- 2025-08-04 Price Changed $200,000 Quincy AOR
- 2025-08-04 Price Changed — MRED as Distributed by MLS Grid
- 2025-07-08 Price Changed $215,000 Quincy AOR
- 2025-07-08 Price Changed — MRED as Distributed by MLS Grid
- 2025-06-20 Listed $225,000 Quincy AOR
- 2025-06-20 Listed — MRED as Distributed by MLS Grid
Property tax history
+1.3%/yrLatest (2023): $2,232 · +7.5% YoY. Source: county tax records.
Cash-flow waterfall
monthlySold comps — $/sqft
last 12 mo · ≤1 miLoading sold comps…