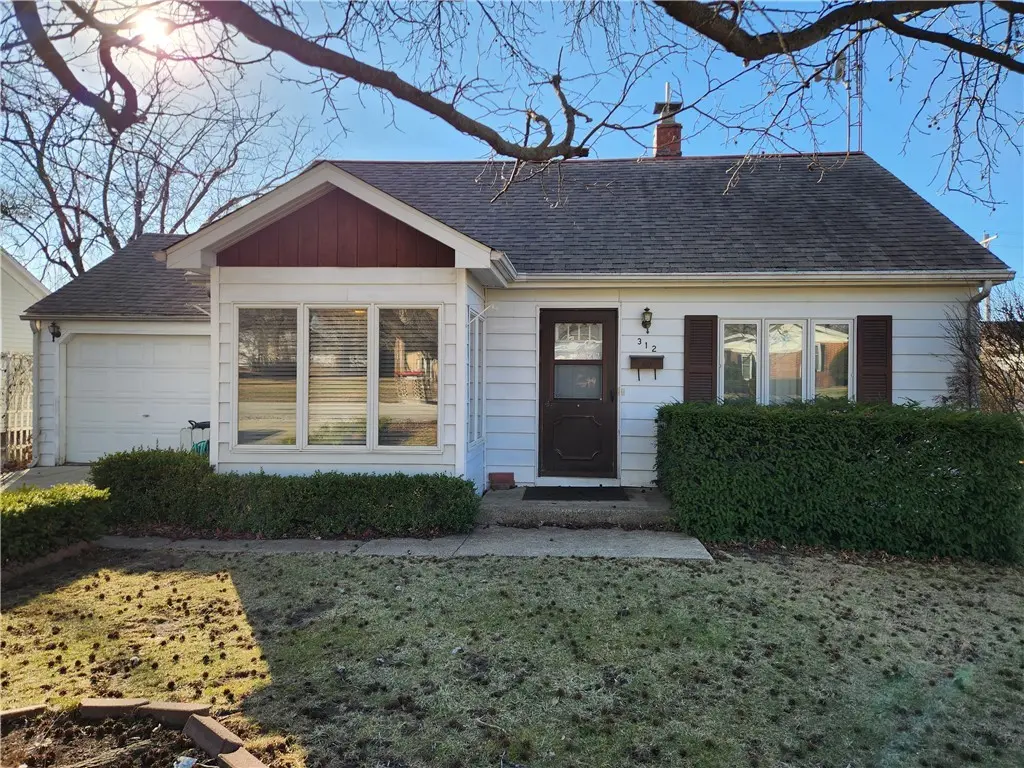
312 N Spruce St · Shelbyville, IL
Flood risk 1/10 · Minimal
- FEMA flood zone
- —
- Chance of flooding over 30 yrs
- 0.0%
- Est. flood insurance / yr
- —
Fire risk 1/10 · Minimal
- Est. fire insurance / yr
- $804 – $1,492
Heat risk 4/10 · Minor
- Hot days now (above 105°F)
- 7 days/yr
- Hot days in 30 yrs
- 20 days/yr
Wind risk 2/10 · Minimal
- Chance of severe wind over 30 yrs
- 2.0%
Air-quality risk 2/10 · Minimal
- Unhealthy air days now
- 1 days/yr
- Unhealthy air days in 30 yrs
- 2 days/yr
Risk factors via First Street. Map © Google.
Why this score? — see what drove the F grade
The composite is a weighted blend of 9 inputs, each scored 0–100. Each bar is that input's sub-score; the figure is the points it added to the 100-point composite (weight × sub-score).
- Cash flow +8.0/30.0
- ARV discount +6.7/15.0
- Livability +3.5/5.0
- Schools +2.8/10.0
- Rent growth +2.5/5.0
- Condition / age +2.5/5.0
- DSCR +2.1/10.0
- 1% rule +1.6/10.0
- Appreciation +0.0/10.0
$149,000
🖨 Deal sheet 📄 Offer letter ✓ Due diligence
Listing remarks MLS
Welcome to this spacious 5-bedroom, 2.5-bath home offering room for everyone and everything! From the moment you step inside, you’ll appreciate the functional layout designed for both everyday living and entertaining. The eat-in kitchen provides the perfect space for morning coffee, family dinners, and gathering with friends. The large primary suite is conveniently located on the main level, offering a private retreat with plenty of room to unwind. Upstairs, you’ll find generously sized bedrooms that could use a little TLC, giving you the opportunity to add your own personal touch. Outside, this property truly stands out with both an attached garage for convenience and an additional 2-car detached garage — ideal for extra vehicles, storage, hobbies, or a workshop. The fenced-in yard offers space for pets, play, or outdoor entertaining. If you’re looking for space, functionality, and potential all in one — this is a home you won’t want to miss!
Key facts
- Attached garage
- Eat-in kitchen
- Fenced-in yard
Tags
Neighborhood map
What this means for you Summary
Snapshot
- This is a 3-bed/1.5-bath single-family listed at $149k.
Deal economics
- At list price, monthly cash flow is $-152 ($-2k/yr) — negative.
- To cash-flow at today's rent, offer at most $122k (18.1% below list).
- To meet the 1% rule (rent ≥ 1% of price), the offer needs to be $98k (34.0% below list).
- Recommended offer: $98k (34.0% below list) — sets the bar for 1% rule.
Location & tenants
- Location reads 70/100 on livability (#355 in IL) — a middle-class / working-renter tenant base. Strengths: crime A+, cost of living A+, housing A+; Watch: employment D+, amenities F, commute F.
- Shelbyville CUSD 4 (town): math 25% / reading 41% proficiency, ranked #225 of 620 in IL (top 36%) — families likely to look elsewhere, expect single-tenant / working-renter base with shorter leases.
- Market conditions: 53 active listings in the ZIP; 41 units permitted in Shelby County in 2024 (0 in 5+ unit buildings).
Forward outlook
- Local home prices are declining (-3.0%/yr); year-one equity from $1k of loan paydown is wiped out by about $4k of value loss. Plan a longer hold.
- Shelby County population projected at -22% by 2050 — secular population decline; favor cash flow + early exit over multi-decade hold.
Negotiation context
- It's been on market 108 days — a 9% lower offer ($136k) is reasonable based on typical stale-listing flexibility.
Risks & watch-outs
- Watch-outs: built in 1948 — expect roof / HVAC / electrical / plumbing capex.
Questions for the listing agent
- What do current leases actually rent for vs. the listed asking? Can we see a recent rent roll and the last 12 months of T-12 income?
- It's been on market 108 days. Have you received any prior offers? Is the seller open to a 34% concession, seller financing, or rate buy-down credit?
- Built in 1948 — when were the roof, HVAC, electrical panel, plumbing, and water heater last replaced?
- Why hasn't it sold? Are there any deal-killer items the seller is aware of (foundation, flood, title, zoning, code violations)?
- Is there a deadline driving the sale (1031 exchange, divorce, estate, relocation)? That informs how much negotiation room exists.
- The area grade is low — what's the realistic commute time and amenity access for the typical tenant pool here? Any planned neighborhood developments (good or bad) we should know about?
- What's the average days-on-market for RENTAL listings here right now (not sales)? A rising rental-DOM trend means longer vacancies and softer asking-rent achievability than the comps imply.
- What's the recent tenant-quality profile in this submarket — average credit score on applications, eviction rate, late-payment / NSF rate, and stable-employment percentage? A property-management company in the area should have these aggregated.
- How much new for-sale + rental construction is in the pipeline within 1–3 miles? Heavy new supply typically softens prices + rents 12–24 months out; constrained supply supports both.
Investment metrics
- 1% rule
- 0.66% ✗
- Cap rate
- 5.07%
- Cash-on-cash
- -4.38%
- DSCR
- 0.81
- GRM
- 12.6
CMA / ARV
- ARV (median comp)
- $146,429
- List price
- $149,000
- Delta
- 1.76%
- Verdict
- FAIR
- Comps
- 20 within 1.0 mi
Show comp detail 12 sales within ~0.75 mi
| Address | Dist | Beds/Ba | Sqft | Sold | Price | $/sf | Match |
|---|---|---|---|---|---|---|---|
| 1502 W North 4th St | 0.25mi | 3/2.0 | 1,023 (-10%) | 2mo | $230,000 | $225 | 67 |
| 915 W South 3rd St | 0.39mi | 3/1.0 | 1,200 (+5%) | 7mo | $122,500 | $102 | 65 |
| 1000 North 1st St | 0.15mi | 2/1.0 (-1) | 1,038 (-9%) | 9mo | $110,000 | $106 | 64 |
| 705 W South 1st St | 0.36mi | 2/1.5 (-1) | 1,050 (-8%) | 2mo | $75,000 | $71 | 63 |
| 606 N Will St | 0.35mi | 2/1.0 (-1) | 1,015 (-11%) | 2mo | $25,000 | $25 | 57 |
| 212 S Virginia St | 0.48mi | 2/2.0 (-1) | 1,192 (+5%) | 8mo | $110,000 | $92 | 56 |
| 308 S Chestnut St | 0.65mi | 3/1.0 | 1,208 (+6%) | 4mo | $8,000 | $7 | 55 |
| 419 W South 2nd St | 0.54mi | 3/1.0 | 1,264 (+11%) | 3mo | $41,000 | $32 | 52 |
| 1707 W North 3rd St | 0.48mi | 3/2.0 | 1,260 (+10%) | 7mo | $224,900 | $178 | 52 |
| 815 W South 4th St | 0.47mi | 2/2.0 (-1) | 976 (-14%) | 5mo | $135,000 | $138 | 43 |
| 1111 W Northland Dr | 0.71mi | 3/1.0 | 1,008 (-12%) | 6mo | $152,000 | $151 | 41 |
| 1035 E Northland Dr | 0.70mi | 3/1.0 | 1,292 (+13%) | 5mo | $162,000 | $125 | 39 |
Match score weights: distance 35% · size 25% · config 20% · recency 20%. Top-matched comps best support the ARV.
Projected returns pro-forma
-3.0% appreciation · 3.0% rent growth · sell at horizon
- IRR
- -23.8%
- Equity multiple
- 0.19×
- Total profit
- $-33,890
- Equity at exit
- $22,216
- IRR
- -18.9%
- Equity multiple
- -0.01×
- Total profit
- $-42,191
- Equity at exit
- $12,883
Cash invested: $41,720 (down + closing). Projections, not guarantees.
Landlord ↔ Tenant lean methodology
- Overall (STATE)
- 43 Moderately Tenant-Leaning
- State Illinois
- 43 Moderately Tenant-Leaning · D+7
- County
- — inherits STATE
- City
- — inherits STATE
ZIP-level market 62565
- Home prices YoY
- -11.6%
- Active inventory
- 53
- Price-to-rent
- 12.6×
Monthly cashflow live
- Estimated rent
- $983 medium interval (Pro) →
- Mortgage (P&I)
- −$781
- Tax from tax record
- −$85 /mo · $1,025/yr
- Insurance
- −$62
- HOA
- −$0
- Vacancy / Maint / Mgmt
- −$206
- Net cashflow
- $-152
Break-even live
UW: 25.0% down · 7.5% · 30yr · 1.5% tax · 5.0% vac · 8.0% maint · 8.0% mgmt
Financing live
Cash to close
- Down payment
- $37,250
- Closing costs
- $4,470
- Reserves months
- —
- Total cash needed
- —
Loan-product check · same deal, 3 products live
Conventional
25% down · 7.5% · 30yr
- Down + closing
- —
- Monthly P&I
- —
- Monthly cashflow
- —
- DSCR
- —
- Eligible?
- —
Personal DTI + credit; lowest rate.
DSCR
20% down · 8.5% · 30yr
- Down + closing
- —
- Monthly P&I
- —
- Monthly cashflow
- —
- DSCR
- —
- Eligible?
- —
No personal income docs; deal must DSCR.
Hard money
10% down · 12.0% · 12mo
- Down + closing
- —
- Monthly P&I
- —
- Monthly cashflow
- —
- DSCR
- —
- Eligible?
- —
Short-term bridge; refi at stabilization.
Listing history 15 events
-
2026-06-18days on market $149,000 Active 108 DOM
-
2026-06-17days on market $149,000 Active 107 DOM
-
2026-06-16days on market $149,000 Active 106 DOM
-
2026-06-15days on market $149,000 Active 105 DOM
-
2026-06-13days on market $149,000 Active 103 DOM
-
2026-06-12days on market $149,000 Active 102 DOM
-
2026-06-09days on market $149,000 Active 99 DOM
-
2026-06-08days on market $149,000 Active 98 DOM
-
2026-06-07days on market $149,000 Active 97 DOM
-
2026-06-04days on market $149,000 Active 93 DOM
-
2026-06-02days on market $149,000 Active 92 DOM
-
2026-06-01days on market $149,000 Active 91 DOM
-
2026-05-31days on market $149,000 Active 90 DOM
-
2026-05-31days on market $149,000 Active 89 DOM
-
2026-03-02$159,900 Active 993-char remark
Show marketing remark (993 chars)
Welcome to this spacious 5-bedroom, 2.5-bath home offering room for everyone and everything! From the moment you step inside, you’ll appreciate the functional layout designed for both everyday living and entertaining. The eat-in kitchen provides the perfect space for morning coffee, family dinners, and gathering with friends. The large primary suite is conveniently located on the main level, offering a private retreat with plenty of room to unwind. Upstairs, you’ll find generously sized bedrooms that could use a little TLC, giving you the opportunity to add your own personal touch. Outside, this property truly stands out with both an attached garage for convenience and an additional 2-car detached garage — ideal for extra vehicles, storage, hobbies, or a workshop. The fenced-in yard offers space for pets, play, or outdoor entertaining. If you’re looking for space, functionality, and potential all in one — this is a home you won’t want to miss!
ⓘ Source: listings_history table (triggers on properties + properties_extension) + one-shot
backfill from property_details.listing_events for pre-trigger history.
Tax reassessment forecast IL · Partial reset (capped growth)
- Current annual tax
- $1,025 · $85/mo
- Projected year-2 tax
- $2,203 · $184/mo
- Expected delta
- +$1,179/yr (+$98/mo · 115.1%)
ⓘ Screening estimate from a state-policy table — verify with the county assessor before closing.
Climate risk First Street
- Flood 1/10 Low 0% chance over 30 yrs
- Wildfire 1/10 Low
- Heat 4/10 Moderate 7 d/yr ≥105°F today · 20 d/yr by 30 yrs out
- Wind 2/10 Low 2% chance of damaging wind over 30 yrs
- Air quality 2/10 Low 1 unhealthy d/yr today · 2 by 30 yrs out
Nearby sold comps map
Loading sold comps map…
Walkable amenities ~0.75 mi
Loading nearby amenities…
Taxation est. · year 1
- Rental income
- $11,796
- − Mortgage interest
- −$8,346
- − Property taxes
- −$1,025
- − Insurance
- −$745
- − Repairs & maintenance
- −$944
- − Management
- −$944
- − Depreciation
- −$4,335
- Taxable loss
- −$4,542
- Est. tax savings @ 24.0%
- +$1,090
- After-tax cash flow
- $-737/yr
For passive investors: Depreciation is non-cash, so a rental often shows a tax loss while cash-flowing — sheltering income. Rental losses are passive: they offset passive income freely, and up to $25,000/yr can offset ordinary (W-2) income if you actively participate and your MAGI is under $100k (phasing out to $0 by $150k); unused losses carry forward. On sale, claimed depreciation is recaptured at up to 25%, and gains may owe capital-gains tax (a 1031 exchange can defer both). Figures are a year-1 estimate at your 24.0% rate — not tax advice; consult a CPA.
Schools (NCES district)
- District
- Shelbyville CUSD 4
- NCES district ID
- 1736090
- Math proficiency
- 25% ▼ -10.00%
- Reading proficiency
- 41% ▼ -12.00%
- Median HH income
- $44,461
- Composite
- 28.1/100
- National rank
- #6827
- State rank
- #225 of 620 in IL
Livability — Shelbyville
- Score
- 70/100
- State rank
- #355
- US rank
- #7321
Category grades
Schools grade is shown separately in the Schools card above.
Census & demographics
- Census place
- Shelbyville, IL
- City population
- 7,422
- Population (ZIP)
- 7,422
Population outlook (Shelby County) Hauer SSP2
- Today (2025)
- 20,512 people
- By 2030
- 19,675 · -4.1%
- By 2040
- 17,851 · -13.0%
- By 2050
- 15,973 · -22.1%
- By 2075
- 11,799 · -42.5%
- By 2100
- 8,030 · -60.9%
Race, ethnicity, and origin ACS 2023
- Neighborhood character
- Predominantly White (97%)
- Race & ethnicity
- White 97% Two or more races 2%
- Common ancestry
- Lithuanian 4% Romanian 3% Slovak 2%
- Foreign-born
- 2% · Canada, South Korea
- Languages at home
- 97% English-only · Russian/Polish/Slavic 2% Spanish 1%
Political lean MEDSL · Shelby
- 2024 margin
- Solid R (+60.2) · D 19.2% · R 79.5% · Other 1.4%
- 2008→2024 swing
- -40.5pp toward R · 2008: -19.8pp · 2024: -60.2pp
- All cycles
- 2024: R+60.2 2020: R+57.2 2016: R+54.3 2012: R+33.7 2008: R+19.8
Not yet ingested
- Civics
- —
Market trends
- HPI YoY
- ▼ -23.35%
- Current HPI
- 178.3002
- Rent YoY
- —
- Metro
- —
- State GDP YoY
- ▲ 1.59%
- F500 in state
- 60
Industry mix (Fortune 500 HQ in IL)
| Industry | F500 HQs | Revenue |
|---|---|---|
| Insurance | 4 | $201B |
|
||
| Consumer Goods | 4 | $87B |
|
||
| Industrial Machinery | 3 | $64B |
|
||
| Healthcare | 2 | $55B |
|
||
| Retail / Pharmacy | 1 | $148B |
|
||
| Agriculture / Food | 1 | $86B |
|
||
Price history
1 event — show timeline
- 2026-03-02 Listed $159,900 CIBR
Property tax history
+0.9%/yrLatest (2024): $1,025 · -5.1% YoY. Source: county tax records.
Cash-flow waterfall
monthlySold comps — $/sqft
last 12 mo · ≤1 miLoading sold comps…