476120 1091 Rd · Remy, OK
Flood risk 9/10 · Severe
- FEMA flood zone
- X (unshaded)
- Chance of flooding over 30 yrs
- 0.99%
- Est. flood insurance / yr
- $507 – $1,088
Fire risk 7/10 · Major
- Est. fire insurance / yr
- $2,463 – $4,575
Heat risk 6/10 · Moderate
- Hot days now (above 111°F)
- 7 days/yr
- Hot days in 30 yrs
- 19 days/yr
Wind risk 2/10 · Minimal
- Chance of severe wind over 30 yrs
- 4.0%
Air-quality risk 2/10 · Minimal
- Unhealthy air days now
- 0 days/yr
- Unhealthy air days in 30 yrs
- 1 days/yr
Risk factors via First Street. Map © Google.
Why this score? — see what drove the D+ grade
The composite is a weighted blend of 9 inputs, each scored 0–100. Each bar is that input's sub-score; the figure is the points it added to the 100-point composite (weight × sub-score).
- Cash flow +18.6/30.0
- Appreciation +6.2/10.0
- DSCR +5.9/10.0
- 1% rule +4.0/10.0
- ARV discount +4.0/15.0
- Livability +2.9/5.0
- Rent growth +2.5/5.0
- Condition / age +2.5/5.0
- Schools +1.6/10.0
$199,000
🖨 Deal sheet 📄 Offer letter ✓ Due diligence
Listing remarks
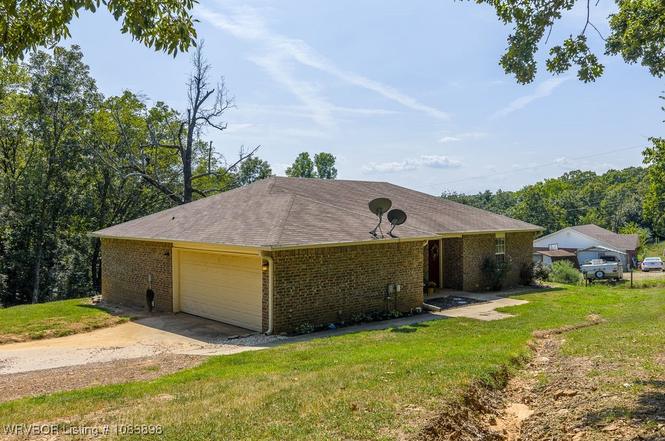
Charming 3-bedroom, 2-bath home built in 2008 on 3.84 acres with a classic brick exterior. Inside you’ll find fresh paint, newer carpet, tile flooring in the living areas, a 4-year-old stove, and a 2-year-old refrigerator. All electric with central air and water heating. The foundation has been professionally repaired and the roof has been replaced, giving added peace of mind to the next owner. The garage includes washer/dryer hookups and has been finished with an extra room that can serve as a fourth bedroom, office, or be converted back into a spacious garage. Move-in ready with room to enjoy the outdoors.
Key facts
- 3.84 acre lot
- Garage
- Built 2008
Property features AI
Exterior
- Parking: Attached garage with 2 covered spaces; Gravel driveway; Garage door opener
- Utilities: Public water; Electricity available; Sewer available; Water available
- Home design: Single-family house; One story; Slab foundation
- Construction: Brick construction; Built as a single-family residence
- Exterior features: Cleared lot; No fencing; Shingle roof
Interior
- Kitchen: Dishwasher; Electric water heater
- Flooring: Carpet; Ceramic tile; Laminate; Simulated wood
- Bathrooms: 2 full bathrooms
- Heating & cooling: Central heating (electric); Central air conditioning (electric); Ceiling fan(s)
- Interior features: Ceiling fans; Storage; Blinds on windows
- Laundry & utility: Electric dryer hookup
Neighborhood map
What this means for you Summary
Snapshot
- This is a 3-bed/2.0-bath single-family listed at $199k.
Deal economics
- At list price, monthly cash flow is $128 ($2k/yr) — positive.
- The deal already cash-flows at list — no discount required.
- To meet the 1% rule (rent ≥ 1% of price), the offer needs to be $180k (9.8% below list).
- Recommended offer: $175k (12.0% below list) — sets the bar for market timing.
Location & tenants
- Location reads 57/100 on livability (#462 in OK) — a working-class tenant base; expect higher turnover. Strengths: cost of living A+; Watch: employment C-, crime F, amenities F.
- Roland (town): math 18% / reading 21% proficiency, ranked #182 of 270 in OK (top 67%) — low school quality limits family demand, transient renter base, plan for 1-2y turnover; 67% free/reduced lunch — lower-income household profile, screen leases tightly.
- Zoned schools: Roland Es (math 42% / reading 32%, grade F, #132 of 845 statewide, top 19%, 427 students, 0% FRL); Roland Ms (math 8% / reading 12%, grade F, #288 of 345 statewide, top 86%, 195 students, 0% FRL); Roland Hs (math 2% / reading 34%, grade F, #302 of 447 statewide, top 68%, 323 students, 0% FRL) — zoned schools average 0% FRL vs 67% district-wide (67 pts lower); this property's tenant base skews higher-income than the district average.
- Market conditions: 56 active listings in the ZIP; 1 comparable units currently listed for rent nearby; 125 units permitted in Sequoyah County in 2024 (0 in 5+ unit buildings).
Forward outlook
- In year one you build about $6k of equity ($1k loan paydown + $5k appreciation (2.4% local appreciation)).
- Sequoyah County population projected at -16% by 2050 — secular population decline; favor cash flow + early exit over multi-decade hold.
- At projected returns (2.4% appreciation + 3.0% rent growth), your $56k cash investment doubles in ~6 years — after that, you're playing with house money.
- By year 6, paydown + projected appreciation supports a ~$33k cash-out refi (75% LTV) — recoverable capital for the next deal without selling this one.
Negotiation context
- It's been on market 276 days — a 12% lower offer ($175k) is reasonable based on typical stale-listing flexibility.
Risks & watch-outs
- Watch-outs: flood insurance adds $66/mo.
- Climate carrying-cost: severe flood risk; major wildfire risk; extreme-heat days projected 7→19/yr by 2055 (HVAC capex compounding) — expect insurance premiums to compound above CPI over the hold.
Questions for the listing agent
- It's been on market 276 days. Have you received any prior offers? Is the seller open to a 12% concession, seller financing, or rate buy-down credit?
- What's the actual annual flood-insurance premium (NFIP or private), and is the property in a SFHA with mandatory coverage?
- Why hasn't it sold? Are there any deal-killer items the seller is aware of (foundation, flood, title, zoning, code violations)?
- Is there a deadline driving the sale (1031 exchange, divorce, estate, relocation)? That informs how much negotiation room exists.
- Schools are D-rated, which usually means shorter tenancies and higher turnover. Who's the typical renter profile here, and what's been the actual vacancy rate?
- Crime grade is F in this area — have there been break-ins, vandalism, or insurance claims at this property in the last 3 years? What carrier currently insures it and at what premium?
- The area grade is low — what's the realistic commute time and amenity access for the typical tenant pool here? Any planned neighborhood developments (good or bad) we should know about?
- What's the average days-on-market for RENTAL listings here right now (not sales)? A rising rental-DOM trend means longer vacancies and softer asking-rent achievability than the comps imply.
- What's the recent tenant-quality profile in this submarket — average credit score on applications, eviction rate, late-payment / NSF rate, and stable-employment percentage? A property-management company in the area should have these aggregated.
- How much new for-sale + rental construction is in the pipeline within 1–3 miles? Heavy new supply typically softens prices + rents 12–24 months out; constrained supply supports both.
Investment metrics
- 1% rule
- 0.90% ✗
- Cap rate
- 7.47%
- Cash-on-cash
- 4.19%
- DSCR
- 1.19
- GRM
- 9.2
CMA / ARV
- ARV (on-the-fly)
- $184,760
- Comps found
- 1
Show comp detail 1 sale within ~0.75 mi
| Address | Dist | Beds/Ba | Sqft | Sold | Price | $/sf | Match |
|---|---|---|---|---|---|---|---|
| 109111 S 4762 | 0.16mi | 4/2.0 (+1) | 1,616 (+8%) | 14mo | $200,000 | $124 | 62 |
Match score weights: distance 35% · size 25% · config 20% · recency 20%. Top-matched comps best support the ARV.
Projected returns pro-forma
2.37% appreciation · 3.0% rent growth · sell at horizon
- IRR
- 8.3%
- Equity multiple
- 1.46×
- Total profit
- $25,520
- Equity at exit
- $82,479
- IRR
- 11.2%
- Equity multiple
- 2.58×
- Total profit
- $87,820
- Equity at exit
- $121,914
Cash invested: $55,720 (down + closing). Projections, not guarantees.
Landlord ↔ Tenant lean methodology
- Overall (STATE)
- 83 Strongly Landlord-Friendly
- State Oklahoma
- 83 Strongly Landlord-Friendly · R+20
- County
- — inherits STATE
- City
- — inherits STATE
ZIP-level market 74954
- Home prices YoY
- 1.1%
- Active inventory
- 56
- Price-to-rent
- 9.2×
Monthly cashflow live
- Estimated rent
- $1,795 medium interval (Pro) →
- Mortgage (P&I)
- −$1,044
- Tax from tax record
- −$97 /mo · $1,165/yr
- Insurance
- −$83
- Flood insurance flood zone
- −$66 /mo · $798/yr
- HOA
- −$0
- Vacancy / Maint / Mgmt
- −$377
- Net cashflow
- $128
Break-even live
UW: 25.0% down · 7.5% · 30yr · 1.5% tax · 5.0% vac · 8.0% maint · 8.0% mgmt
Financing live
Cash to close
- Down payment
- $49,750
- Closing costs
- $5,970
- Reserves months
- —
- Total cash needed
- —
Loan-product check · same deal, 3 products live
Conventional
25% down · 7.5% · 30yr
- Down + closing
- —
- Monthly P&I
- —
- Monthly cashflow
- —
- DSCR
- —
- Eligible?
- —
Personal DTI + credit; lowest rate.
DSCR
20% down · 8.5% · 30yr
- Down + closing
- —
- Monthly P&I
- —
- Monthly cashflow
- —
- DSCR
- —
- Eligible?
- —
No personal income docs; deal must DSCR.
Hard money
10% down · 12.0% · 12mo
- Down + closing
- —
- Monthly P&I
- —
- Monthly cashflow
- —
- DSCR
- —
- Eligible?
- —
Short-term bridge; refi at stabilization.
Rent comps 1 comps
| Address | Beds | Baths | Sqft | Rent | $/sqft | DOM | Units | Dist |
|---|---|---|---|---|---|---|---|---|
| 476207 E 1094 Rd Roland, OK | 3.0 | 2.0 | 1191 | $1,795 | $1.51 | 11d | 1 | 0.18mi |
Listing history 17 events
-
2026-06-19days on market $199,000 Active 276 DOM
-
2026-06-18days on market $199,000 Active 275 DOM
-
2026-06-17days on market $199,000 Active 274 DOM
-
2026-06-16days on market $199,000 Active 273 DOM
-
2026-06-15days on market $199,000 Active 272 DOM
-
2026-06-14days on market $199,000 Active 270 DOM
-
2026-06-13days on market $199,000 Active 269 DOM
-
2026-06-10days on market $199,000 Active 267 DOM
-
2026-06-09days on market $199,000 Active 266 DOM
-
2026-06-08days on market $199,000 Active 265 DOM
-
2026-06-07days on market $199,000 Active 264 DOM
-
2026-06-03days on market $199,000 Active 260 DOM
-
2026-06-02days on market $199,000 Active 259 DOM
-
2026-05-30days on market $199,000 Active 257 DOM
-
2026-03-14price $199,000
-
2025-09-29price $205,000
-
2025-09-15$215,000 Active
ⓘ Source: listings_history table (triggers on properties + properties_extension) + one-shot
backfill from property_details.listing_events for pre-trigger history.
Tax reassessment forecast OK · Resets to sale price
- Current annual tax
- $1,165 · $97/mo
- Projected year-2 tax
- $1,791 · $149/mo
- Expected delta
- +$626/yr (+$52/mo · 53.7%)
ⓘ Screening estimate from a state-policy table — verify with the county assessor before closing.
Climate risk First Street
- Flood 9/10 Extreme FEMA zone X (unshaded) · 99% chance over 30 yrs
- Wildfire 7/10 Severe
- Heat 6/10 Major 7 d/yr ≥111°F today · 19 d/yr by 30 yrs out
- Wind 2/10 Low 4% chance of damaging wind over 30 yrs
- Air quality 2/10 Low 0 unhealthy d/yr today · 1 by 30 yrs out
Nearby sold comps map
Loading sold comps map…
Walkable amenities ~0.75 mi
Loading nearby amenities…
Taxation est. · year 1
- Rental income
- $21,540
- − Mortgage interest
- −$11,147
- − Property taxes
- −$1,165
- − Insurance
- −$1,792
- − Repairs & maintenance
- −$1,723
- − Management
- −$1,723
- − Depreciation
- −$5,789
- Taxable loss
- −$1,800
- Est. tax savings @ 24.0%
- +$432
- After-tax cash flow
- $1,968/yr
For passive investors: Depreciation is non-cash, so a rental often shows a tax loss while cash-flowing — sheltering income. Rental losses are passive: they offset passive income freely, and up to $25,000/yr can offset ordinary (W-2) income if you actively participate and your MAGI is under $100k (phasing out to $0 by $150k); unused losses carry forward. On sale, claimed depreciation is recaptured at up to 25%, and gains may owe capital-gains tax (a 1031 exchange can defer both). Figures are a year-1 estimate at your 24.0% rate — not tax advice; consult a CPA.
Schools (NCES district)
- District
- Roland
- NCES district ID
- 4026310
- Math proficiency
- 18% ▼ -8.00%
- Reading proficiency
- 21% ▼ -9.00%
- Median HH income
- $37,345
- Composite
- 16.28/100
- National rank
- #9216
- State rank
- #182 of 270 in OK
Livability — Remy
- Score
- 57/100
- State rank
- #462
- US rank
- #21758
Category grades
Schools grade is shown separately in the Schools card above.
Census & demographics
- Population (ZIP)
- 5,066
Population outlook (Sequoyah County) Hauer SSP2
- Today (2025)
- 39,398 people
- By 2030
- 38,215 · -3.0%
- By 2040
- 35,625 · -9.6%
- By 2050
- 32,943 · -16.4%
- By 2075
- 27,805 · -29.4%
- By 2100
- 23,311 · -40.8%
Race, ethnicity, and origin ACS 2023
- Neighborhood character
- Diverse neighborhood (Simpson 0.56)
- Race & ethnicity
- White 66% Two or more races 13% Native American 13% Black 6% Hispanic / Latino 2%
- Common ancestry
- Italian 2% Iranian 1% Slovak 1%
- Foreign-born
- 1% · Canada
- Languages at home
- 96% English-only · German/W. Germanic 1% Spanish 1%
Political lean MEDSL · Sequoyah
- 2024 margin
- Solid R (+61.5) · D 18.6% · R 80.2% · Other 1.2%
- 2008→2024 swing
- -25.5pp toward R · 2008: -36.0pp · 2024: -61.5pp
- All cycles
- 2024: R+61.5 2020: R+59.0 2016: R+54.2 2012: R+39.1 2008: R+36.0
Not yet ingested
- Civics
- —
Market trends
- HPI YoY
- ▲ 2.37%
- Current HPI
- 207.654
- Rent YoY
- —
- Metro
- —
- State GDP YoY
- ▲ 1.55%
- F500 in state
- 6
Industry mix (Fortune 500 HQ in OK)
| Industry | F500 HQs | Revenue |
|---|---|---|
| Energy | 3 | $48B |
|
||
Price history
-7.4% since first listed3 events — show timeline
- 2026-03-14 Price Changed $199,000 WRVBOR
- 2025-09-29 Price Changed $205,000 WRVBOR
- 2025-09-15 Listed $215,000 WRVBOR
Property tax history
+1.9%/yrLatest (2025): $1,165 · +4.9% YoY. Source: county tax records.
Cash-flow waterfall
monthlySold comps — $/sqft
last 12 mo · ≤1 miLoading sold comps…