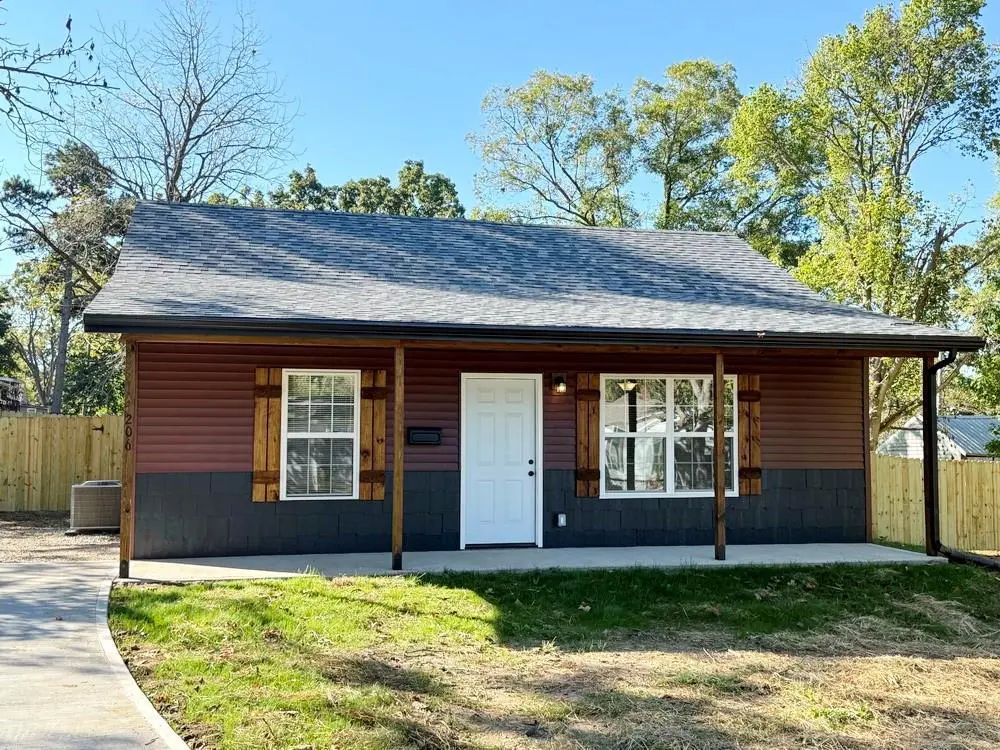
106 E Lafayette St · El Dorado Springs, MO
Flood risk 1/10 · Minimal
- FEMA flood zone
- X (unshaded)
- Chance of flooding over 30 yrs
- 0.0%
- Est. flood insurance / yr
- $507 – $1,088
Fire risk 4/10 · Minor
- Est. fire insurance / yr
- $1,054 – $1,958
Heat risk 5/10 · Moderate
- Hot days now (above 108°F)
- 7 days/yr
- Hot days in 30 yrs
- 18 days/yr
Wind risk 2/10 · Minimal
- Chance of severe wind over 30 yrs
- 1.0%
Air-quality risk 2/10 · Minimal
- Unhealthy air days now
- 0 days/yr
- Unhealthy air days in 30 yrs
- 1 days/yr
Risk factors via First Street. Map © Google.
Why this score? — see what drove the F grade
The composite is a weighted blend of 9 inputs, each scored 0–100. Each bar is that input's sub-score; the figure is the points it added to the 100-point composite (weight × sub-score).
- Appreciation +10.0/10.0
- ARV discount +7.5/15.0
- Cash flow +5.6/30.0
- Livability +3.1/5.0
- Rent growth +2.5/5.0
- Condition / age +2.5/5.0
- Schools +2.4/10.0
- 1% rule +1.1/10.0
- DSCR +0.0/10.0
$125,900
🖨 Deal sheet (PDF) 📄 Offer letter ✓ Due diligence
Listing remarks MLS
New Construction Home For Sale - El Dorado Springs, MO. Tired of fixer-uppers? Discover this affordable, low-maintenance new build in the heart of El Dorado Springs - a move-in ready option for buyers seeking simplicity, efficiency, and modern comfort. This 2-bedroom, 1-bathroom home offers 875 sq ft of well-designed living space. The kitchen features custom cabinets, a pantry, and brand-new appliances including a refrigerator, oven, and built-in microwave - ready for use on day one. The two bedrooms share a full hall bathroom with a shower-over-tub combo. In addition, a covered back patio provides a comfortable outdoor retreat. The buyer who puts this home under contract soon will be able to select some colors and finishes, allowing them to customize to their preferences. Estimated completion is summer 2026 - now is the perfect time to secure this quality-built home before it's gone. Photos provided are from a similar home by the same builder; final colors and layout may vary. Call today to schedule a tour or make an offer.
Key facts
- Custom cabinets
- Covered back patio
- Move in ready
Tags
Neighborhood map
What this means for you Summary
Snapshot
- This is a 2-bed/1.0-bath manufactured listed at $126k.
Deal economics
- At list price, monthly cash flow is $-262 ($-3k/yr) — negative.
- To cash-flow at today's rent, offer at most $88k (30.1% below list).
- To meet the 1% rule (rent ≥ 1% of price), the offer needs to be $77k (38.9% below list).
- Recommended offer: $77k (38.9% below list) — sets the bar for 1% rule.
- Cap rate 3.8% vs local median 4.9% in El Dorado Springs — below-typical yield; the buyer is paying a premium for something (appreciation thesis, condition, location) that the cap rate doesn't capture.
Location & tenants
- Location reads 62/100 on livability (#370 in MO) — a middle-class / working-renter tenant base. Strengths: cost of living A+, housing A+, health & safety A+; Watch: schools D-, amenities F, commute F.
- El Dorado Springs R-II (town): math 25% / reading 34% proficiency, ranked #279 of 324 in MO (top 86%) — low school quality limits family demand, transient renter base, plan for 1-2y turnover.
- Market conditions: 84 active listings in the ZIP; 4 units permitted in Cedar County in 2024 (0 in 5+ unit buildings).
Forward outlook
- In year one you build about $13k of equity ($870 loan paydown + $13k appreciation (10.0% local appreciation)).
- Cedar County population projected at -12% by 2050 — secular population decline; favor cash flow + early exit over multi-decade hold.
- By year 3, paydown + projected appreciation supports a ~$34k cash-out refi (75% LTV) — recoverable capital for the next deal without selling this one.
Negotiation context
- It's been on market 246 days — a 12% lower offer ($111k) is reasonable based on typical stale-listing flexibility.
- 2 sale attempts with the ask held roughly flat each time — persistent listings suggest the price (not the market) is what's stuck; bring a comps-based counter.
Risks & watch-outs
- Climate carrying-cost: extreme-heat days projected 7→18/yr by 2055 (HVAC capex compounding) — expect insurance premiums to compound above CPI over the hold.
Questions for the listing agent
- What do current leases actually rent for vs. the listed asking? Can we see a recent rent roll and the last 12 months of T-12 income?
- It's been on market 246 days. Have you received any prior offers? Is the seller open to a 39% concession, seller financing, or rate buy-down credit?
- Why hasn't it sold? Are there any deal-killer items the seller is aware of (foundation, flood, title, zoning, code violations)?
- Is there a deadline driving the sale (1031 exchange, divorce, estate, relocation)? That informs how much negotiation room exists.
- Schools are D-rated, which usually means shorter tenancies and higher turnover. Who's the typical renter profile here, and what's been the actual vacancy rate?
- The area grade is low — what's the realistic commute time and amenity access for the typical tenant pool here? Any planned neighborhood developments (good or bad) we should know about?
- What's the average days-on-market for RENTAL listings here right now (not sales)? A rising rental-DOM trend means longer vacancies and softer asking-rent achievability than the comps imply.
- What's the recent tenant-quality profile in this submarket — average credit score on applications, eviction rate, late-payment / NSF rate, and stable-employment percentage? A property-management company in the area should have these aggregated.
- How much new for-sale + rental construction is in the pipeline within 1–3 miles? Heavy new supply typically softens prices + rents 12–24 months out; constrained supply supports both.
Investment metrics
- 1% rule
- 0.61% ✗
- Cap rate
- 3.80%
- Cash-on-cash
- -8.92%
- DSCR
- 0.60
- GRM
- 13.6
CMA / ARV
- ARV (median comp)
- $76,336
- List price
- $125,900
- Delta
- 64.93%
- Verdict
- OVERPRICED
- Comps
- 20 within 1.0 mi
Projected returns pro-forma
10.0% appreciation · 3.0% rent growth · sell at horizon
- IRR
- 18.0%
- Equity multiple
- 2.47×
- Total profit
- $51,892
- Equity at exit
- $113,421
- IRR
- 16.8%
- Equity multiple
- 5.71×
- Total profit
- $165,961
- Equity at exit
- $244,596
Cash invested: $35,252 (down + closing). Projections, not guarantees.
Landlord ↔ Tenant lean methodology
- Overall (STATE)
- 81 Strongly Landlord-Friendly
- State Missouri
- 81 Strongly Landlord-Friendly · R+10
- County
- — inherits STATE
- City
- — inherits STATE
ZIP-level market 64744
- Home prices YoY
- 5.2%
- Active inventory
- 84
- Price-to-rent
- 13.6×
Monthly cashflow live
- Estimated rent
- $770 medium interval (Pro) →
- Mortgage (P&I)
- −$660
- Tax est. 1.5%
- −$157 /mo · $1,888/yr
- Insurance
- −$52
- HOA
- −$0
- Vacancy / Maint / Mgmt
- −$162
- Net cashflow
- $-262
Break-even live
Sensitivity live
| Price | -10% $-175 | -5% $-219 | +0% $-262 | +5% $-306 | +10% $-349 |
|---|---|---|---|---|---|
| Rent | -10% $-323 | -5% $-292 | +0% $-262 | +5% $-232 | +10% $-201 |
| Rate | -1.0pp $-199 | -0.5pp $-230 | base $-262 | +0.5pp $-295 | +1.0pp $-328 |
UW: 25.0% down · 7.5% · 30yr · 1.5% tax · 5.0% vac · 8.0% maint · 8.0% mgmt
Financing live
Cash to close
- Down payment
- $31,475
- Closing costs
- $3,777
- Reserves months
- —
- Total cash needed
- —
Loan-product check · same deal, 3 products live
Conventional
25% down · 7.5% · 30yr
- Down + closing
- —
- Monthly P&I
- —
- Monthly cashflow
- —
- DSCR
- —
- Eligible?
- —
Personal DTI + credit; lowest rate.
DSCR
20% down · 8.5% · 30yr
- Down + closing
- —
- Monthly P&I
- —
- Monthly cashflow
- —
- DSCR
- —
- Eligible?
- —
No personal income docs; deal must DSCR.
Hard money
10% down · 12.0% · 12mo
- Down + closing
- —
- Monthly P&I
- —
- Monthly cashflow
- —
- DSCR
- —
- Eligible?
- —
Short-term bridge; refi at stabilization.
Listing history 18 events
-
2026-06-21days on market $125,900 Active 246 DOM
-
2026-06-18days on market $125,900 Active 244 DOM
-
2026-06-17days on market $125,900 Active 243 DOM
-
2026-06-16days on market $125,900 Active 242 DOM
-
2026-06-15days on market $125,900 Active 241 DOM
-
2026-06-13days on market $125,900 Active 239 DOM
-
2026-06-12days on market $125,900 Active 238 DOM
-
2026-06-09days on market $125,900 Active 235 DOM
-
2026-06-08days on market $125,900 Active 234 DOM
-
2026-06-07days on market $125,900 Active 233 DOM
-
2026-06-07days on market $125,900 Active 232 DOM
-
2026-06-04days on market $125,900 Active 229 DOM
-
2026-06-02days on market $125,900 Active 228 DOM
-
2026-06-01days on market $125,900 Active 227 DOM
-
2026-05-31days on market $125,900 Active 226 DOM
-
2025-10-17$125,900 Active 1040-char remark
Show marketing remark (1040 chars)
New Construction Home For Sale - El Dorado Springs, MO. Tired of fixer-uppers? Discover this affordable, low-maintenance new build in the heart of El Dorado Springs - a move-in ready option for buyers seeking simplicity, efficiency, and modern comfort. This 2-bedroom, 1-bathroom home offers 875 sq ft of well-designed living space. The kitchen features custom cabinets, a pantry, and brand-new appliances including a refrigerator, oven, and built-in microwave - ready for use on day one. The two bedrooms share a full hall bathroom with a shower-over-tub combo. In addition, a covered back patio provides a comfortable outdoor retreat. The buyer who puts this home under contract soon will be able to select some colors and finishes, allowing them to customize to their preferences. Estimated completion is summer 2026 - now is the perfect time to secure this quality-built home before it's gone. Photos provided are from a similar home by the same builder; final colors and layout may vary. Call today to schedule a tour or make an offer.
-
2015-03-06soldstatus
ⓘ Source: listings_history table (triggers on properties + properties_extension) + one-shot
backfill from property_details.listing_events for pre-trigger history.
Climate risk First Street
- Flood 1/10 Low FEMA zone X (unshaded) · 0% chance over 30 yrs
- Wildfire 4/10 Moderate
- Heat 5/10 Major 7 d/yr ≥108°F today · 18 d/yr by 30 yrs out
- Wind 2/10 Low 100% chance of damaging wind over 30 yrs
- Air quality 2/10 Low 0 unhealthy d/yr today · 1 by 30 yrs out
Nearby sold comps map
Loading sold comps map…
Walkable amenities ~0.75 mi
Loading nearby amenities…
Taxation est. · year 1
- Rental income
- $9,236
- − Mortgage interest
- −$7,052
- − Property taxes
- −$1,888
- − Insurance
- −$630
- − Repairs & maintenance
- −$739
- − Management
- −$739
- − Depreciation
- −$3,663
- Taxable loss
- −$5,474
- Est. tax savings @ 24.0%
- +$1,314
- After-tax cash flow
- $-1,830/yr
For passive investors: Depreciation is non-cash, so a rental often shows a tax loss while cash-flowing — sheltering income. Rental losses are passive: they offset passive income freely, and up to $25,000/yr can offset ordinary (W-2) income if you actively participate and your MAGI is under $100k (phasing out to $0 by $150k); unused losses carry forward. On sale, claimed depreciation is recaptured at up to 25%, and gains may owe capital-gains tax (a 1031 exchange can defer both). Figures are a year-1 estimate at your 24.0% rate — not tax advice; consult a CPA.
Schools (NCES district)
- District
- El Dorado Springs R-II
- NCES district ID
- 2911310
- Math proficiency
- 25% ▼ -5.00%
- Reading proficiency
- 34% ▼ -5.00%
- Median HH income
- $31,880
- Composite
- 24.02/100
- National rank
- #7772
- State rank
- #279 of 324 in MO
Livability — El Dorado Springs
- Score
- 62/100
- State rank
- #370
- US rank
- #16324
Category grades
Schools grade is shown separately in the Schools card above.
Census & demographics
- Census place
- El Dorado Springs, MO
- Population (ZIP)
- 8,547
Population outlook (Cedar County) Hauer SSP2
- Today (2025)
- 13,424 people
- By 2030
- 13,080 · -2.6%
- By 2040
- 12,434 · -7.4%
- By 2050
- 11,841 · -11.8%
- By 2075
- 10,171 · -24.2%
- By 2100
- 7,744 · -42.3%
Race, ethnicity, and origin ACS 2023
- Neighborhood character
- Predominantly White (95%)
- Race & ethnicity
- White 95% Two or more races 4%
- Common ancestry
- Italian 6% Iranian 3% Romanian 3%
- Foreign-born
- 1% · Canada
- Languages at home
- 94% English-only · German/W. Germanic 5% Spanish 1%
Political lean MEDSL · Cedar
- 2024 margin
- Solid R (+69.6) · D 14.8% · R 84.4%
- 2008→2024 swing
- -36.0pp toward R · 2008: -33.6pp · 2024: -69.6pp
- All cycles
- 2024: R+69.6 2020: R+65.9 2016: R+63.9 2012: R+47.0 2008: R+33.6
Not yet ingested
- Civics
- —
Market trends
- HPI YoY
- ▲ 11.88%
- Current HPI
- 242.0421
- Rent YoY
- —
- Metro
- —
- State GDP YoY
- ▲ 1.84%
- F500 in state
- 20
Industry mix (Fortune 500 HQ in MO)
| Industry | F500 HQs | Revenue |
|---|---|---|
| Healthcare | 1 | $163B |
|
||
| Insurance | 1 | $21B |
|
||
| Industrial Technology | 1 | $17B |
|
||
| Retail | 1 | $16B |
|
||
| Industrial Distribution | 1 | $10B |
|
||
| Utilities | 1 | $9B |
|
||
Price history
+0.0% since first listed3 events — show timeline
- 2025-10-17 Listed $125,900 SOMO
- 2025-10-17 Listed $125,900 Heartland MLS as Distributed by MLS Grid
- 2015-03-06 Sold (Public Records) — Public Records
Property tax history
+3.1%/yrLatest (2025): $55 · +10.4% YoY. Source: county tax records.
Cash-flow waterfall
monthlySold comps — $/sqft
last 12 mo · ≤1 miLoading sold comps…