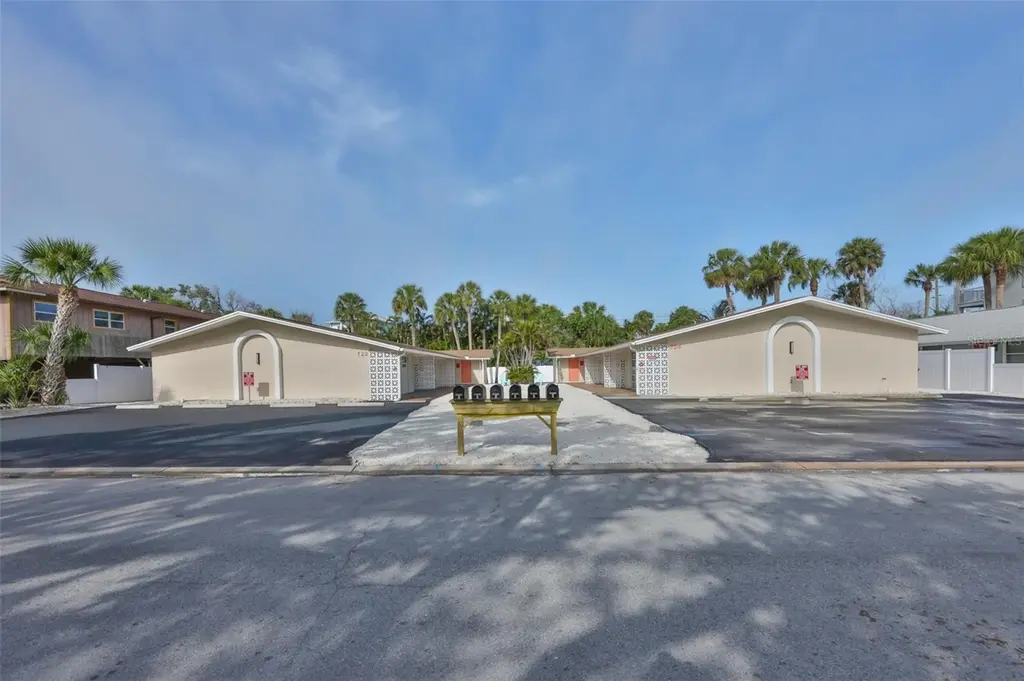
 Triplex
724 1st St · Indian Rocks Beach, FL
Flood risk 10/10 · Severe
- FEMA flood zone
- AE
- Chance of flooding over 30 yrs
- 0.99%
- Est. flood insurance / yr
- $1,737 – $8,500
Fire risk 1/10 · Minimal
- Est. fire insurance / yr
- $947 – $1,759
Heat risk 10/10 · Severe
- Hot days now (above 107°F)
- 7 days/yr
- Hot days in 30 yrs
- 27 days/yr
Wind risk 10/10 · Severe
- Chance of severe wind over 30 yrs
- 99.0%
Air-quality risk 3/10 · Minor
- Unhealthy air days now
- 2 days/yr
- Unhealthy air days in 30 yrs
- 3 days/yr
Risk factors via First Street. Map © Google.
Why this score? — see what drove the D grade
The composite is a weighted blend of 9 inputs, each scored 0–100. Each bar is that input's sub-score; the figure is the points it added to the 100-point composite (weight × sub-score).
- Cash flow +11.7/30.0
- ARV discount +7.5/15.0
- Appreciation +5.6/10.0
- Schools +4.3/10.0
- Livability +3.7/5.0
- DSCR +3.5/10.0
- 1% rule +2.8/10.0
- Rent growth +2.5/5.0
- Condition / age +2.5/5.0
$1,097,500
🖨 Deal sheet (PDF) 📄 Offer letter ✓ Due diligence
Multi-family units
County records classify this as Multi-Family (2-4 Unit). Listing-text estimate: 3 units. confirmed
Listing remarks
Under contract-accepting backup offers. A Rare Opportunity in the Heart of Indian Rocks Beach! Welcome to an exceptional 3-unit multifamily gem in the highly coveted Indian Rocks Beach community - where lifestyle, location, and income potential align beautifully. Being sold with neighboring triplex (TB8486443). This property has been completely renovated from top to bottom, delivering peace of mind and modern appeal for today's savvy investor. Every detail has been thoughtfully refreshed, including new landscaping, a new privacy fence, and fully updated interiors throughout all units. Each residence features a spacious 2-bedroom, 1-bath layout, enhanced with brand-new modern appliances, sl
Key facts
- 7,130 sq ft lot
- Built 1974
Neighborhood map
What this means for you Summary
Snapshot
- This is a 3 × 2-bed/1.0-bath units multifamily listed at $1.10M.
Deal economics
- At list price, monthly cash flow is $-738 ($-9k/yr) — negative. Per door: $-246/mo.
- To cash-flow at today's rent, offer at most $967k (11.9% below list).
- To meet the 1% rule (rent ≥ 1% of price), the offer needs to be $851k (22.4% below list).
- Recommended offer: $851k (22.4% below list) — sets the bar for 1% rule.
- Cap rate 6.0% vs local median 1.1% in Indian Rocks Beach — top-decile yield for the area; either an underpriced asset or a hidden risk that comps aren't pricing in. Stress-test before assuming the spread holds.
Location & tenants
- Location reads 73/100 on livability (#315 in FL) — a middle-class / working-renter tenant base. Strengths: health & safety A+, commute A, crime A-; Watch: amenities F, cost of living F.
- Pinellas (suburban): math 51% / reading 51% proficiency, ranked #31 of 73 in FL (top 42%) — acceptable for families but not a draw, mixed tenant base, ~2y average lease.
- Zoned schools: Anona Elementary School (math 80% / reading 67%, grade A, #260 of 2,144 statewide, top 13%, 473 students, 45% FRL); Seminole Middle School (math 55% / reading 53%, grade B-, #196 of 571 statewide, top 36%, 824 students, 49% FRL); Richard O Jacobson Technical High School At Seminole (math 52% / reading 53%, grade C-, #154 of 667 statewide, top 24%, 578 students, 45% FRL) — zoned schools at 46% FRL track the district average.
- Market conditions: 246 active listings in the ZIP; 1 comparable units currently listed for rent nearby; solid renter incomes; 2,676 units permitted in Pinellas County in 2024 (1,422 in 5+ unit buildings).
- At $8,513/mo this rent would consume 101% of the median local household income ($101k/yr) (locally 130% of renters already pay >50% of income on rent) — very limited rent-growth headroom before tenants either downsize or default.
Forward outlook
- In year one you build about $20k of equity ($8k loan paydown + $12k appreciation (1.1% local appreciation)).
- Pinellas County population projected at +14% by 2050 — modest demand growth; plan on rents tracking national, not racing it.
- By year 4, paydown + projected appreciation supports a ~$71k cash-out refi (75% LTV) — recoverable capital for the next deal without selling this one.
Negotiation context
- Only 1 days on market — expect competitive offers; lowballing is unlikely to land.
- Current owner paid $550k; list at $1.10M implies a 100% gain — meaningful room to come down on a strong offer.
Risks & watch-outs
- Watch-outs: flood insurance adds $427/mo.
- Climate carrying-cost: in FEMA flood zone AE (mandatory federal flood insurance); severe wind risk, 99% chance of damaging wind over 30y; extreme-heat days projected 7→27/yr by 2055 (HVAC capex compounding) — expect insurance premiums to compound above CPI over the hold.
Questions for the listing agent
- What do current leases actually rent for vs. the listed asking? Can we see a recent rent roll and the last 12 months of T-12 income?
- Can we see the unit-by-unit rent roll, current vacancy, and any below-market leases? What's the average tenancy length?
- What capital expenditures (roof, boiler, parking lot, exteriors) have been made in the last 5 years, and what's planned in the next 2?
- Built in 1974 — when were the roof, HVAC, electrical panel, plumbing, and water heater last replaced?
- What's the actual annual flood-insurance premium (NFIP or private), and is the property in a SFHA with mandatory coverage?
- Is there a deadline driving the sale (1031 exchange, divorce, estate, relocation)? That informs how much negotiation room exists.
- Schools are D-rated, which usually means shorter tenancies and higher turnover. Who's the typical renter profile here, and what's been the actual vacancy rate?
- The area grade is low — what's the realistic commute time and amenity access for the typical tenant pool here? Any planned neighborhood developments (good or bad) we should know about?
- What's the average days-on-market for RENTAL listings here right now (not sales)? A rising rental-DOM trend means longer vacancies and softer asking-rent achievability than the comps imply.
- What's the recent tenant-quality profile in this submarket — average credit score on applications, eviction rate, late-payment / NSF rate, and stable-employment percentage? A property-management company in the area should have these aggregated.
- How much new apartment / multifamily construction is in the pipeline within 1–3 miles? Heavy new supply (>2% of stock underway) typically softens rents 12–24 months out; light construction supports rent growth.
Investment metrics
- 1% rule
- 0.78% ✗
- Cap rate
- 5.95%
- Cash-on-cash
- -1.22%
- DSCR
- 0.95
- GRM
- 10.7
CMA / ARV
No comps found within radius.
Projected returns pro-forma
1.11% appreciation · 3.0% rent growth · sell at horizon
- IRR
- -1.3%
- Equity multiple
- 0.93×
- Total profit
- $-20,475
- Equity at exit
- $380,987
- IRR
- 3.6%
- Equity multiple
- 1.44×
- Total profit
- $135,321
- Equity at exit
- $511,221
Cash invested: $307,300 (down + closing). Projections, not guarantees.
Landlord ↔ Tenant lean methodology
- Overall (STATE)
- 87 Strongly Landlord-Friendly
- State Florida
- 87 Strongly Landlord-Friendly · R+3
- County
- — inherits STATE
- City
- — inherits STATE
ZIP-level market 33785
- Home prices YoY
- 0.3%
- Active inventory
- 246
- Price-to-rent
- 32.2×
Monthly cashflow live
- Estimated rent
- $8,513 high interval (Pro) →
- Mortgage (P&I)
- −$5,755
- Tax from tax record
- −$824 /mo · $9,886/yr
- Insurance
- −$457
- Flood insurance flood zone
- −$427 /mo · $5,118/yr
- HOA
- −$0
- Vacancy / Maint / Mgmt
- −$1,788
- Net cashflow
- $-738
Break-even live
Sensitivity live
| Price | -10% $-117 | -5% $-427 | +0% $-738 | +5% $-1,048 | +10% $-1,359 |
|---|---|---|---|---|---|
| Rent | -10% $-1,410 | -5% $-1,074 | +0% $-738 | +5% $-402 | +10% $-65 |
| Rate | -1.0pp $-185 | -0.5pp $-459 | base $-738 | +0.5pp $-1,022 | +1.0pp $-1,312 |
3-unit breakdown (identical units grouped — click to expand)
| Units | Beds | Baths | Est. rent |
|---|---|---|---|
| 3× units | 2 | 1 | $8,514 |
| #1 | 2 | 1 | $2,838 |
| #2 | 2 | 1 | $2,838 |
| #3 | 2 | 1 | $2,838 |
| Total (3 units) | $8,513 | ||
UW: 25.0% down · 7.5% · 30yr · 1.5% tax · 5.0% vac · 8.0% maint · 8.0% mgmt
Financing live
Cash to close
- Down payment
- $274,375
- Closing costs
- $32,925
- Reserves months
- —
- Total cash needed
- —
Loan-product check · same deal, 3 products live
Conventional
25% down · 7.5% · 30yr
- Down + closing
- —
- Monthly P&I
- —
- Monthly cashflow
- —
- DSCR
- —
- Eligible?
- —
Personal DTI + credit; lowest rate.
DSCR
20% down · 8.5% · 30yr
- Down + closing
- —
- Monthly P&I
- —
- Monthly cashflow
- —
- DSCR
- —
- Eligible?
- —
No personal income docs; deal must DSCR.
Hard money
10% down · 12.0% · 12mo
- Down + closing
- —
- Monthly P&I
- —
- Monthly cashflow
- —
- DSCR
- —
- Eligible?
- —
Short-term bridge; refi at stabilization.
Rent comps 1 comps
| Address | Beds | Baths | Sqft | Rent | $/sqft | DOM | Units | Dist |
|---|---|---|---|---|---|---|---|---|
| 1612 1st St Indian Rocks Beach, FL | 6.0 | 2.0 | 3262 | $4,950 | $1.52 | 26d | 1 | 0.73mi |
Listing history 7 events
-
2026-04-24status Pending
-
2026-04-22status Pending
-
2026-04-22$1,097,500 Active
-
2004-01-20soldstatus $550,000
-
1999-07-21soldstatus $150,000
-
1990-06-29soldstatus $225,000
-
1990-06-01soldstatus $225,000
ⓘ Source: listings_history table (triggers on properties + properties_extension) + one-shot
backfill from property_details.listing_events for pre-trigger history.
Tax reassessment forecast FL · Resets to sale price
- Current annual tax
- $9,886 · $824/mo
- Projected year-2 tax
- $9,886 · $824/mo
- Expected delta
- $0/yr ($0/mo · 0.0%)
ⓘ Screening estimate from a state-policy table — verify with the county assessor before closing.
Climate risk First Street
- Flood 10/10 Extreme FEMA zone AE · 99% chance over 30 yrs
- Wildfire 1/10 Low
- Heat 10/10 Extreme 7 d/yr ≥107°F today · 27 d/yr by 30 yrs out
- Wind 10/10 Extreme 99% chance of damaging wind over 30 yrs
- Air quality 3/10 Moderate 2 unhealthy d/yr today · 3 by 30 yrs out
Nearby sold comps map
Loading sold comps map…
Walkable amenities ~0.75 mi
Loading nearby amenities…
Taxation est. · year 1
- Rental income
- $102,156
- − Mortgage interest
- −$61,477
- − Property taxes
- −$9,886
- − Insurance
- −$10,606
- − Repairs & maintenance
- −$8,172
- − Management
- −$8,172
- − Depreciation
- −$31,927
- Taxable loss
- −$28,086
- Est. tax savings @ 24.0%
- +$6,741
- After-tax cash flow
- $-2,113/yr
For passive investors: Depreciation is non-cash, so a rental often shows a tax loss while cash-flowing — sheltering income. Rental losses are passive: they offset passive income freely, and up to $25,000/yr can offset ordinary (W-2) income if you actively participate and your MAGI is under $100k (phasing out to $0 by $150k); unused losses carry forward. On sale, claimed depreciation is recaptured at up to 25%, and gains may owe capital-gains tax (a 1031 exchange can defer both). Figures are a year-1 estimate at your 24.0% rate — not tax advice; consult a CPA.
Schools (NCES district)
- District
- Pinellas
- NCES district ID
- 1201560
- Math proficiency
- 51% ▼ -5.00%
- Reading proficiency
- 51% ▼ -3.00%
- Median HH income
- $46,270
- Composite
- 43.27/100
- National rank
- #3046
- State rank
- #31 of 73 in FL
Livability — Indian Rocks Beach
- Score
- 73/100
- State rank
- #315
- US rank
- #5348
Category grades
Schools grade is shown separately in the Schools card above.
Census & demographics
- Census place
- Indian Rocks Beach, FL
- County
- Pinellas County · 939,478 people
- City population
- 4,907
- Metro
- Tampa-St. Petersburg-Clearwater, FL
- Population (ZIP)
- 4,907
- Household income
- $101,356
- Rent vs Own
- Severe rent burden
- 130.0
Population outlook (Pinellas County) Hauer SSP2
- Today (2025)
- 1,027,532 people
- By 2030
- 1,063,586 · +3.5%
- By 2040
- 1,125,020 · +9.5%
- By 2050
- 1,168,637 · +13.7%
- By 2075
- 1,265,188 · +23.1%
- By 2100
- 1,260,357 · +22.7%
Race, ethnicity, and origin ACS 2023
- Neighborhood character
- Predominantly White (86%)
- Race & ethnicity
- White 86% Hispanic / Latino 7% Two or more races 4% Asian 4%
- Hispanic origin (detail)
- Puerto Rican 1% Cuban 3%
- Common ancestry
- Romanian 5% Lithuanian 3% Slovak 3%
- Foreign-born
- 10% · Canada, China, Jamaica
- Languages at home
- 93% English-only · Spanish 3% French/Haitian/Cajun 1% Other Indo-European 1%
Political lean MEDSL · Pinellas
- 2024 margin
- Lean R (+5.2) · D 46.9% · R 52.1%
- 2008→2024 swing
- -13.5pp toward R · 2008: 8.3pp · 2024: -5.2pp
- All cycles
- 2024: R+5.2 2020: D+0.2 2016: R+1.1 2012: D+5.6 2008: D+8.3
Not yet ingested
- Civics
- —
Market trends
- HPI YoY
- ▲ 1.11%
- Current HPI
- 384.4452
- Rent YoY
- —
- Metro
- Tampa-St. Petersburg-Clearwater, FL
- State GDP YoY
- ▲ 3.28%
- F500 in state
- 36
Industry mix (Fortune 500 HQ in FL)
| Industry | F500 HQs | Revenue |
|---|---|---|
| Industrial Technology | 2 | $29B |
|
||
| Insurance | 2 | $17B |
|
||
| Retail | 1 | $60B |
|
||
| Technology Distribution | 1 | $58B |
|
||
| Homebuilding | 1 | $35B |
|
||
| Technology Manufacturing | 1 | $35B |
|
||
Price history
+387.8% since first listed7 events — show timeline
- 2026-04-24 Pending — Stellar MLS as Distributed by MLS Grid
- 2026-04-22 Pending — Stellar MLS as Distributed by MLS Grid
- 2026-04-22 Listed $1,097,500 Stellar MLS as Distributed by MLS Grid
- 2004-01-20 Sold (Public Records) $550,000 Public Records
- 1999-07-21 Sold (Public Records) $150,000 Public Records
- 1990-06-29 Sold (Public Records) $225,000 Public Records
- 1990-06-01 Sold (Public Records) $225,000 Public Records
Property tax history
+7.4%/yrLatest (2025): $9,886 · -15.1% YoY. Source: county tax records.
Cash-flow waterfall
monthlySold comps — $/sqft
last 12 mo · ≤1 miLoading sold comps…