515 Vailtown Rd · Liberty, PA
Flood risk No data
- FEMA flood zone
- —
- Chance of flooding over 30 yrs
- —
- Est. flood insurance / yr
- —
Fire risk No data
- Est. fire insurance / yr
- —
Heat risk No data
- Hot days now (above threshold)
- —
- Hot days in 30 yrs
- —
Wind risk No data
- Chance of severe wind over 30 yrs
- —
Air-quality risk No data
- Unhealthy air days now
- —
- Unhealthy air days in 30 yrs
- —
Risk factors via First Street. Map © Google.
Why this score? — see what drove the D grade
The composite is a weighted blend of 9 inputs, each scored 0–100. Each bar is that input's sub-score; the figure is the points it added to the 100-point composite (weight × sub-score).
- Cash flow +11.2/30.0
- ARV discount +7.5/15.0
- Appreciation +6.5/10.0
- Livability +3.6/5.0
- DSCR +3.3/10.0
- 1% rule +3.2/10.0
- Schools +3.0/10.0
- Rent growth +2.5/5.0
- Condition / age +2.5/5.0
$132,500
🖨 Deal sheet (PDF) 📄 Offer letter ✓ Due diligence
Listing remarks
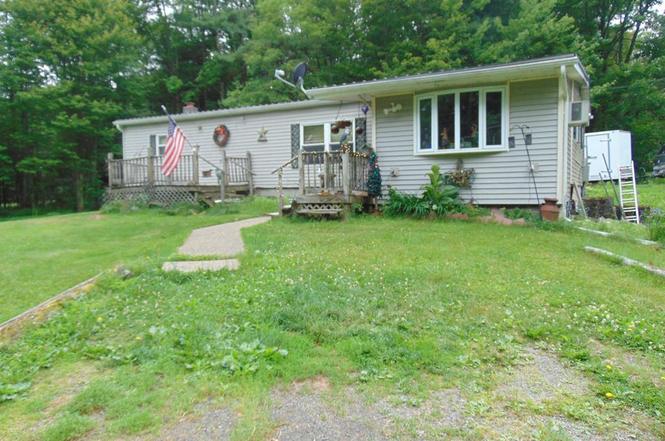
Your next chapter begins here on Vailtown Rd. This cozy 1 story Ranch is on 1 acre with a quiet neighborhood. There is privacy all around you with the potential of more, with 1 acre lot next door is also for sale. It offers central air, generator and public sewer. Laundry room, 3/4 bathroom with a room that was a bedroom with a half bathroom. With a little construction could be again. Conveniently located between Mansfield and Williamsport. This Affordable Home is a must see! Schedule your showing today.
Key facts
- Public sewer
- Laundry room
- 1 acre
Tags
Property features AI
Finance
- Other: Listing broker: Penn Oak Realty Mansfield; Listing agent: Virginia Chamberlain
Exterior
- Utilities: Private well water; Public sewer
- Home design: Residential manufactured home; Located on a 1-acre lot
- Construction: Vinyl siding construction; Metal roof; Full basement
- Exterior features: Metal roof; Vinyl siding
Interior
- Bedrooms: Total of 9 rooms (bedroom count not specified)
- Bathrooms: 1 full bathroom; 1 half bathroom
- Heating & cooling: Central air conditioning; Forced-air heating (natural gas)
- Interior features: Gas water heater; Full basement
Neighborhood map
What this means for you Summary
Snapshot
- This is a 2-bed/1.5-bath manufactured listed at $132k.
Deal economics
- At list price, monthly cash flow is $-52 ($-625/yr) — negative.
- To cash-flow at today's rent, offer at most $123k (6.9% below list).
- To meet the 1% rule (rent ≥ 1% of price), the offer needs to be $108k (18.3% below list).
- Recommended offer: $108k (18.3% below list) — sets the bar for 1% rule.
Location & tenants
- Location reads 72/100 on livability (#659 in PA) — a middle-class / working-renter tenant base. Strengths: crime A+, cost of living A+, housing A+; Watch: employment C-, health & safety D, amenities F.
- Southern Tioga SD (rural): math 25% / reading 45% proficiency, ranked #421 of 539 in PA (top 78%) — families likely to look elsewhere, expect single-tenant / working-renter base with shorter leases.
- Zoned schools: Liberty El Sch (math 27% / reading 47%, grade F, #1,004 of 1,518 statewide, top 68%, 174 students, 53% FRL); North Penn-Liberty Jshs (math 27% / reading 52%, grade F, #265 of 437 statewide, top 63%, 238 students, 48% FRL) — zoned schools average 51% FRL vs 36% district-wide (15 pts higher); higher-poverty schools than district average — tighter screening recommended.
- Market conditions: 6 active listings in the ZIP; 32 units permitted in Tioga County in 2024 (0 in 5+ unit buildings).
Forward outlook
- In year one you build about $5k of equity ($916 loan paydown + $4k appreciation (3.0% local appreciation)).
- Tioga County population projected at -20% by 2050 — secular population decline; favor cash flow + early exit over multi-decade hold.
- At projected returns (3.0% appreciation + 3.0% rent growth), your $37k cash investment doubles in ~7 years — after that, you're playing with house money.
- By year 7, paydown + projected appreciation supports a ~$31k cash-out refi (75% LTV) — recoverable capital for the next deal without selling this one.
Negotiation context
- Only 2 days on market — expect competitive offers; lowballing is unlikely to land.
- Current owner paid $36k; list at $132k implies a 268% gain — meaningful room to come down on a strong offer.
Questions for the listing agent
- What do current leases actually rent for vs. the listed asking? Can we see a recent rent roll and the last 12 months of T-12 income?
- Built in 1972 — when were the roof, HVAC, electrical panel, plumbing, and water heater last replaced?
- Is there a deadline driving the sale (1031 exchange, divorce, estate, relocation)? That informs how much negotiation room exists.
- Schools are B-rated — typically a magnet for longer-tenancy family renters. What's the average tenant stay here, and is there a school-zone premium baked into asking?
- The area grade is low — what's the realistic commute time and amenity access for the typical tenant pool here? Any planned neighborhood developments (good or bad) we should know about?
- What's the average days-on-market for RENTAL listings here right now (not sales)? A rising rental-DOM trend means longer vacancies and softer asking-rent achievability than the comps imply.
- What's the recent tenant-quality profile in this submarket — average credit score on applications, eviction rate, late-payment / NSF rate, and stable-employment percentage? A property-management company in the area should have these aggregated.
- How much new for-sale + rental construction is in the pipeline within 1–3 miles? Heavy new supply typically softens prices + rents 12–24 months out; constrained supply supports both.
Investment metrics
- 1% rule
- 0.82% ✗
- Cap rate
- 5.82%
- Cash-on-cash
- -1.69%
- DSCR
- 0.93
- GRM
- 10.2
CMA / ARV
No comps found within radius.
Projected returns pro-forma
3.0% appreciation · 3.0% rent growth · sell at horizon
- IRR
- 5.9%
- Equity multiple
- 1.34×
- Total profit
- $12,632
- Equity at exit
- $59,554
- IRR
- 8.9%
- Equity multiple
- 2.34×
- Total profit
- $49,683
- Equity at exit
- $91,761
Cash invested: $37,100 (down + closing). Projections, not guarantees.
Landlord ↔ Tenant lean methodology
- Overall (STATE)
- 62 Landlord-Friendly
- State Pennsylvania
- 62 Landlord-Friendly · EVEN
- County
- — inherits STATE
- City
- — inherits STATE
ZIP-level market 16930
- Home prices YoY
- 1.2%
- Active inventory
- 6
- Price-to-rent
- 10.2×
Monthly cashflow live
- Estimated rent
- $1,082 medium interval (Pro) →
- Mortgage (P&I)
- −$695
- Tax from tax record
- −$157 /mo · $1,883/yr
- Insurance
- −$55
- HOA
- −$0
- Vacancy / Maint / Mgmt
- −$227
- Net cashflow
- $-52
Break-even live
Sensitivity live
| Price | -10% $23 | -5% $-15 | +0% $-52 | +5% $-90 | +10% $-127 |
|---|---|---|---|---|---|
| Rent | -10% $-138 | -5% $-95 | +0% $-52 | +5% $-9 | +10% $33 |
| Rate | -1.0pp $15 | -0.5pp $-18 | base $-52 | +0.5pp $-86 | +1.0pp $-121 |
UW: 25.0% down · 7.5% · 30yr · 1.5% tax · 5.0% vac · 8.0% maint · 8.0% mgmt
Financing live
Cash to close
- Down payment
- $33,125
- Closing costs
- $3,975
- Reserves months
- —
- Total cash needed
- —
Loan-product check · same deal, 3 products live
Conventional
25% down · 7.5% · 30yr
- Down + closing
- —
- Monthly P&I
- —
- Monthly cashflow
- —
- DSCR
- —
- Eligible?
- —
Personal DTI + credit; lowest rate.
DSCR
20% down · 8.5% · 30yr
- Down + closing
- —
- Monthly P&I
- —
- Monthly cashflow
- —
- DSCR
- —
- Eligible?
- —
No personal income docs; deal must DSCR.
Hard money
10% down · 12.0% · 12mo
- Down + closing
- —
- Monthly P&I
- —
- Monthly cashflow
- —
- DSCR
- —
- Eligible?
- —
Short-term bridge; refi at stabilization.
Listing history 3 events
-
2026-06-21days on market $132,500 Active 2 DOM
-
2026-06-21remarks 509-char remark
-
2026-06-21$132,500 Active 1 DOM
ⓘ Source: listings_history table (triggers on properties + properties_extension) + one-shot
backfill from property_details.listing_events for pre-trigger history.
Tax reassessment forecast PA · Partial reset (capped growth)
- Current annual tax
- $1,883 · $157/mo
- Projected year-2 tax
- $1,988 · $166/mo
- Expected delta
- +$105/yr (+$9/mo · 5.6%)
ⓘ Screening estimate from a state-policy table — verify with the county assessor before closing.
Nearby sold comps map
Loading sold comps map…
Walkable amenities ~0.75 mi
Loading nearby amenities…
Taxation est. · year 1
- Rental income
- $12,985
- − Mortgage interest
- −$7,422
- − Property taxes
- −$1,883
- − Insurance
- −$662
- − Repairs & maintenance
- −$1,039
- − Management
- −$1,039
- − Depreciation
- −$3,855
- Taxable loss
- −$2,914
- Est. tax savings @ 24.0%
- +$699
- After-tax cash flow
- $74/yr
For passive investors: Depreciation is non-cash, so a rental often shows a tax loss while cash-flowing — sheltering income. Rental losses are passive: they offset passive income freely, and up to $25,000/yr can offset ordinary (W-2) income if you actively participate and your MAGI is under $100k (phasing out to $0 by $150k); unused losses carry forward. On sale, claimed depreciation is recaptured at up to 25%, and gains may owe capital-gains tax (a 1031 exchange can defer both). Figures are a year-1 estimate at your 24.0% rate — not tax advice; consult a CPA.
Schools (NCES district)
- District
- Southern Tioga SD
- NCES district ID
- 4222370
- Math proficiency
- 25% ▼ -15.00%
- Reading proficiency
- 45% ▼ -10.00%
- Median HH income
- $44,260
- Composite
- 29.72/100
- National rank
- #6451
- State rank
- #421 of 539 in PA
Livability — Liberty
- Score
- 72/100
- State rank
- #659
- US rank
- #6444
Category grades
Schools grade is shown separately in the Schools card above.
Census & demographics
- City population
- 6,139
- Population (ZIP)
- 1,202
Population outlook (Tioga County) Hauer SSP2
- Today (2025)
- 40,253 people
- By 2030
- 38,795 · -3.6%
- By 2040
- 35,376 · -12.1%
- By 2050
- 32,081 · -20.3%
- By 2075
- 24,341 · -39.5%
- By 2100
- 17,180 · -57.3%
Race, ethnicity, and origin ACS 2023
- Neighborhood character
- Predominantly White (97%)
- Race & ethnicity
- White 97% Two or more races 2%
- Common ancestry
- Romanian 5% Lithuanian 3% Iranian 2%
- Foreign-born
- 1%
Political lean MEDSL · Tioga
- 2024 margin
- Solid R (+51.8) · D 23.6% · R 75.4% · Other 1.0%
- 2008→2024 swing
- -24.3pp toward R · 2008: -27.4pp · 2024: -51.8pp
- All cycles
- 2024: R+51.8 2020: R+51.2 2016: R+53.6 2012: R+34.8 2008: R+27.4
Not yet ingested
- Civics
- —
Market trends
- HPI YoY
- ▲ 3.00%
- Current HPI
- 248.8152
- Rent YoY
- —
- Metro
- —
- State GDP YoY
- ▲ 1.68%
- F500 in state
- 34
Industry mix (Fortune 500 HQ in PA)
| Industry | F500 HQs | Revenue |
|---|---|---|
| Healthcare | 2 | $309B |
|
||
| Insurance | 2 | $27B |
|
||
| Telecommunications / Media | 1 | $124B |
|
||
| Industrial Distribution | 1 | $22B |
|
||
| Financial Services | 1 | $20B |
|
||
| Chemicals / Materials | 1 | $18B |
|
||
Price history
+268.1% since first listed2 events — show timeline
- 2026-06-17 Listed $132,500 NMPA
- 1992-05-20 Sold (Public Records) $36,000 Public Records
Property tax history
+5.1%/yrLatest (2026): $1,883 · +1.1% YoY. Source: county tax records.
Cash-flow waterfall
monthlySold comps — $/sqft
last 12 mo · ≤1 miLoading sold comps…