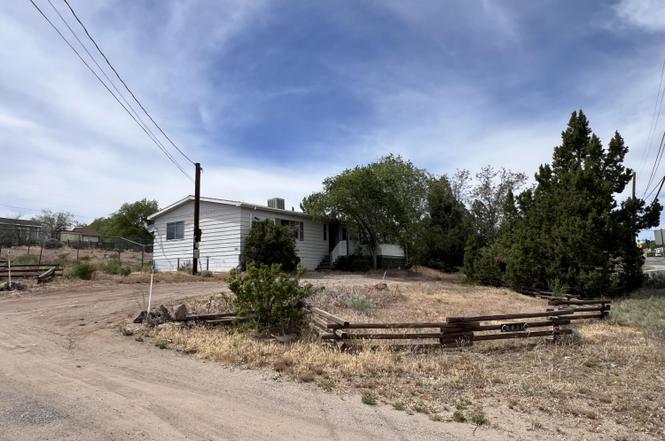
5831 Sun Valley Blvd · Sun Valley, NV
Flood risk 1/10 · Minimal
- FEMA flood zone
- X (unshaded)
- Chance of flooding over 30 yrs
- 0.0%
- Est. flood insurance / yr
- $507 – $1,088
Fire risk 7/10 · Major
- Est. fire insurance / yr
- $490 – $910
Heat risk 4/10 · Minor
- Hot days now (above 94°F)
- 5 days/yr
- Hot days in 30 yrs
- 12 days/yr
Wind risk 1/10 · Minimal
- Chance of severe wind over 30 yrs
- —
Air-quality risk 8/10 · Major
- Unhealthy air days now
- 15 days/yr
- Unhealthy air days in 30 yrs
- 17 days/yr
Risk factors via First Street. Map © Google.
Why this score? — see what drove the A- grade
The composite is a weighted blend of 9 inputs, each scored 0–100. Each bar is that input's sub-score; the figure is the points it added to the 100-point composite (weight × sub-score).
- Cash flow +30.0/30.0
- ARV discount +15.0/15.0
- DSCR +10.0/10.0
- 1% rule +8.5/10.0
- Appreciation +5.4/10.0
- Schools +3.2/10.0
- Livability +3.1/5.0
- Rent growth +2.5/5.0
- Condition / age +2.5/5.0
$199,900
🖨 Deal sheet 📄 Offer letter ✓ Due diligence
Listing remarks MLS
Completely remodeled manufactured home. Custom tile entry, hall, kitchen, and dining room. New carpet. Custom tile counter tops in kitchen and baths. New vinyl in baths. Completely fenced back yard just needs some landscaping. Large shed with utilities. RV parking with hookups. Very clean home & lot. Newer stove, frig & dishwasher. Motivated seller says bring all offers. Seller will even leave yard tractor with all attachments. Agent related to seller.
Key facts
- 0.33 acre lot
- Built 1978
- Listed 2 days
Property features AI
Finance
- Other: Zoning: MDS; Public maintained road frontage
- HOA & community: Not a senior community
Exterior
- Parking: RV access/parking; Additional off-street parking; No carport
- Utilities: Public water; Public sewer; Electricity connected; Phone available; Sewer connected; Cellular coverage
- Home design: Manufactured home (double wide); One story
- Construction: Aluminum siding; Composition/shingle pitched roof; Crawl space foundation; Built as a double wide manufactured home
- Exterior features: Covered deck; Partial backyard fencing; Shed(s) on property; Corner lot on a cul-de-sac; Lot is generally level with some upward slope; Mountain, trees/woods and valley views; No private pool
Interior
- Kitchen: No appliances included
- Bedrooms: Primary downstairs
- Flooring: Tile; Vinyl; Wood
- Bathrooms: 2 full bathrooms
- Heating & cooling: Electric heating
- Interior features: No interior steps; Breakfast bar; Primary bedroom on main level; Metal window frames
- Laundry & utility: Laundry closet
Neighborhood map
What this means for you Summary
Snapshot
- This is a 3-bed/2.0-bath manufactured listed at $200k.
Deal economics
- At list price, monthly cash flow is $957 ($11k/yr) — positive.
- The deal already cash-flows at list — no discount required.
- Meets the 1% rule at list price ($3k rent vs $200k).
- Cap rate 12.0% vs local median 3.7% in Sun Valley — top-decile yield for the area; either an underpriced asset or a hidden risk that comps aren't pricing in. Stress-test before assuming the spread holds.
Location & tenants
- Location reads 61/100 on livability (#72 in NV) — a middle-class / working-renter tenant base. Strengths: cost of living A+, housing A+; Watch: crime F, amenities F, commute F.
- Washoe County School District (urban): math 30% / reading 44% proficiency, ranked #6 of 17 in NV (top 35%) — families likely to look elsewhere, expect single-tenant / working-renter base with shorter leases.
- Zoned schools: Esther Bennett Elementary (math 17% / reading 17%, grade F, #311 of 402 statewide, top 82%, 538 students, 100% FRL); Desert Skies Middle School (math 10% / reading 22%, grade F, #92 of 109 statewide, top 84%, 978 students, 100% FRL); Procter R. Hug High School (math 11% / reading 18%, grade F, #114 of 131 statewide, top 88%, 2,331 students, 100% FRL) — zoned schools average 100% FRL vs 42% district-wide (58 pts higher); higher-poverty schools than district average — tighter screening recommended.
- Zoned-school proficiency averages 16% at this address vs 37% district-wide (-21 pts) — the specific schools serving this property underperform the Washoe County School District average; the district grade overstates school quality for this exact location.
- Market conditions: 47 active listings in the ZIP; 11 comparable units currently listed for rent nearby; rentals at typical pace (median 24d on market — plan ~3-4 weeks tenant-placement turnaround); 4,085 units permitted in Washoe County in 2024 (1,634 in 5+ unit buildings).
Forward outlook
- In year one you build about $3k of equity ($1k loan paydown + $2k appreciation (0.8% local appreciation)).
- Washoe County population projected at +19% by 2050 — long-run rental-demand tailwind backs the buy-and-hold thesis.
- At projected returns (0.8% appreciation + 3.0% rent growth), your $56k cash investment doubles in ~4 years — after that, you're playing with house money.
- By year 10, paydown + projected appreciation supports a ~$32k cash-out refi (75% LTV) — recoverable capital for the next deal without selling this one.
Negotiation context
- Only 2 days on market — expect competitive offers; lowballing is unlikely to land.
- 3 sale attempts since 24y ago with the ask held roughly flat each time — persistent listings suggest the price (not the market) is what's stuck; bring a comps-based counter.
- Current owner paid $142k; 41% above their basis — modest negotiation headroom, anchor on the comps not their cost.
Risks & watch-outs
- Climate carrying-cost: major wildfire risk — expect insurance premiums to compound above CPI over the hold.
Questions for the listing agent
- Built in 1978 — when were the roof, HVAC, electrical panel, plumbing, and water heater last replaced?
- Is there a deadline driving the sale (1031 exchange, divorce, estate, relocation)? That informs how much negotiation room exists.
- Schools are F-rated, which usually means shorter tenancies and higher turnover. Who's the typical renter profile here, and what's been the actual vacancy rate?
- Crime grade is F in this area — have there been break-ins, vandalism, or insurance claims at this property in the last 3 years? What carrier currently insures it and at what premium?
- What's the average days-on-market for RENTAL listings here right now (not sales)? A rising rental-DOM trend means longer vacancies and softer asking-rent achievability than the comps imply.
- What's the recent tenant-quality profile in this submarket — average credit score on applications, eviction rate, late-payment / NSF rate, and stable-employment percentage? A property-management company in the area should have these aggregated.
- How much new for-sale + rental construction is in the pipeline within 1–3 miles? Heavy new supply typically softens prices + rents 12–24 months out; constrained supply supports both.
Investment metrics
- 1% rule
- 1.35% ✓
- Cap rate
- 12.04%
- Cash-on-cash
- 20.52%
- DSCR
- 1.91
- GRM
- 6.2
CMA / ARV
- ARV (on-the-fly)
- $305,080
- Comps found
- 8
Show comp detail 8 sales within ~0.75 mi
| Address | Dist | Beds/Ba | Sqft | Sold | Price | $/sf | Match |
|---|---|---|---|---|---|---|---|
| 5707 Jacobson Rd | 0.18mi | 3/2.0 | 1,152 (+10%) | 11mo | $280,000 | $243 | 66 |
| 135 Staci Way | 0.23mi | 2/2.0 (-1) | 924 (-12%) | 3mo | $400,000 | $433 | 61 |
| 237 Gerdes Ave | 0.32mi | 3/2.0 | 1,152 (+10%) | 10mo | $399,000 | $346 | 61 |
| 135 S Fork Dr | 0.22mi | 3/2.0 | 1,152 (+10%) | 24mo | $362,000 | $314 | 54 |
| 305 Quartz Ln | 0.48mi | 2/2.0 (-1) | 980 (-7%) | 10mo | $125,000 | $128 | 53 |
| 5590 Lil Abner Ln | 0.61mi | 2/2.0 (-1) | 1,152 (+10%) | 5mo | $275,000 | $239 | 47 |
| 220 Haas Ct | 0.71mi | 3/2.0 | 1,152 (+10%) | 9mo | $320,000 | $278 | 44 |
| 135 Guildwood Dr | 0.50mi | 2/1.0 (-1) | 896 (-15%) | 16mo | $260,000 | $290 | 30 |
Match score weights: distance 35% · size 25% · config 20% · recency 20%. Top-matched comps best support the ARV.
Projected returns pro-forma
0.81% appreciation · 3.0% rent growth · sell at horizon
- IRR
- 22.2%
- Equity multiple
- 2.12×
- Total profit
- $62,796
- Equity at exit
- $66,300
- IRR
- 25.3%
- Equity multiple
- 4.00×
- Total profit
- $168,149
- Equity at exit
- $86,624
Cash invested: $55,972 (down + closing). Projections, not guarantees.
Landlord ↔ Tenant lean methodology
- Overall (STATE)
- 71 Landlord-Friendly
- State Nevada
- 71 Landlord-Friendly · R+1
- County
- — inherits STATE
- City
- — inherits STATE
ZIP-level market 89433
- Home prices YoY
- 0.3%
- Active inventory
- 47
- Price-to-rent
- 6.2×
Monthly cashflow live
- Estimated rent
- $2,700 high interval (Pro) →
- Mortgage (P&I)
- −$1,048
- Tax from tax record
- −$44 /mo · $530/yr
- Insurance
- −$83
- HOA
- −$0
- Vacancy / Maint / Mgmt
- −$567
- Net cashflow
- $957
Break-even live
UW: 25.0% down · 7.5% · 30yr · 1.5% tax · 5.0% vac · 8.0% maint · 8.0% mgmt
Financing live
Cash to close
- Down payment
- $49,975
- Closing costs
- $5,997
- Reserves months
- —
- Total cash needed
- —
Loan-product check · same deal, 3 products live
Conventional
25% down · 7.5% · 30yr
- Down + closing
- —
- Monthly P&I
- —
- Monthly cashflow
- —
- DSCR
- —
- Eligible?
- —
Personal DTI + credit; lowest rate.
DSCR
20% down · 8.5% · 30yr
- Down + closing
- —
- Monthly P&I
- —
- Monthly cashflow
- —
- DSCR
- —
- Eligible?
- —
No personal income docs; deal must DSCR.
Hard money
10% down · 12.0% · 12mo
- Down + closing
- —
- Monthly P&I
- —
- Monthly cashflow
- —
- DSCR
- —
- Eligible?
- —
Short-term bridge; refi at stabilization.
Rent comps 11 comps
| Address | Beds | Baths | Sqft | Rent | $/sqft | DOM | Units | Dist |
|---|---|---|---|---|---|---|---|---|
| 5363 Crest Cove Dr Sun Valley, NV | 3.0 | 2.0 | 1344 | $2,700 | $2.01 | 23d | 1 | 1.25mi |
| 5363 Crest Cove Dr Sun Valley, NV | 3.0 | 2.0 | 1344 | $2,700 | $2.01 | 43d | 1 | 1.25mi |
| 419 Leland Dr Sun Valley, NV | 3.0 | 2.0 | 1344 | $2,700 | $2.01 | 23d | 1 | 1.34mi |
| 425 Leland Dr Sun Valley, NV | 3.0 | 2.0 | 1344 | $2,700 | $2.01 | 13d | 1 | 1.35mi |
| 431 Leland Dr Sun Valley, NV | 3.0 | 2.0 | 1344 | $2,700 | $2.01 | 13d | 1 | 1.35mi |
| 5370 Beverly Lake Dr Sun Valley, NV | 3.0 | 2.0 | 1344 | $2,700 | $2.01 | 13d | 1 | 1.38mi |
| 5366 Beverly Lake Dr Sun Valley, NV | 3.0 | 2.0 | 1344 | $2,700 | $2.01 | 13d | 1 | 1.39mi |
| 5377 Camino Carlos Dr Sun Valley, NV | 3.0 | 2.0 | 1344 | $2,700 | $2.01 | 23d | 1 | 1.40mi |
| 5359 Beverly Lake Dr Sun Valley, NV | 3.0 | 2.0 | 1344 | $2,700 | $2.01 | 43d | 1 | 1.40mi |
| 5362 Beverly Lake Dr Sun Valley, NV | 3.0 | 2.0 | 1344 | $2,700 | $2.01 | 23d | 1 | 1.40mi |
| 5373 Camino Carlos Dr Sun Valley, NV | 3.0 | 2.0 | 1344 | $2,700 | $2.01 | 43d | 1 | 1.41mi |
Listing history 2 events
-
2026-06-18days on market $199,900 Active 2 DOM
-
2026-06-16$199,900 Active 1 DOM
ⓘ Source: listings_history table (triggers on properties + properties_extension) + one-shot
backfill from property_details.listing_events for pre-trigger history.
Tax reassessment forecast NV · Resets to sale price
- Current annual tax
- $530 · $44/mo
- Projected year-2 tax
- $1,179 · $98/mo
- Expected delta
- +$650/yr (+$54/mo · 122.7%)
ⓘ Screening estimate from a state-policy table — verify with the county assessor before closing.
Climate risk First Street
- Flood 1/10 Low FEMA zone X (unshaded) · 0% chance over 30 yrs
- Wildfire 7/10 Severe
- Heat 4/10 Moderate 5 d/yr ≥94°F today · 12 d/yr by 30 yrs out
- Wind 1/10 Low
- Air quality 8/10 Severe 15 unhealthy d/yr today · 17 by 30 yrs out
Nearby sold comps map
Loading sold comps map…
Walkable amenities ~0.75 mi
Loading nearby amenities…
Taxation est. · year 1
- Rental income
- $32,400
- − Mortgage interest
- −$11,198
- − Property taxes
- −$530
- − Insurance
- −$1,000
- − Repairs & maintenance
- −$2,592
- − Management
- −$2,592
- − Depreciation
- −$5,815
- Taxable income
- $8,674
- Est. tax owed @ 24.0%
- −$2,082
- After-tax cash flow
- $9,406/yr
For passive investors: Depreciation is non-cash, so a rental often shows a tax loss while cash-flowing — sheltering income. Rental losses are passive: they offset passive income freely, and up to $25,000/yr can offset ordinary (W-2) income if you actively participate and your MAGI is under $100k (phasing out to $0 by $150k); unused losses carry forward. On sale, claimed depreciation is recaptured at up to 25%, and gains may owe capital-gains tax (a 1031 exchange can defer both). Figures are a year-1 estimate at your 24.0% rate — not tax advice; consult a CPA.
Schools (NCES district)
- District
- Washoe County School District
- NCES district ID
- 3200480
- Math proficiency
- 30% ▼ -9.00%
- Reading proficiency
- 44% ▼ -4.00%
- Median HH income
- $55,025
- Composite
- 32.44/100
- National rank
- #5721
- State rank
- #6 of 17 in NV
Livability — Sun Valley
- Score
- 61/100
- State rank
- #72
- US rank
- #17949
Category grades
Schools grade is shown separately in the Schools card above.
Census & demographics
- Census place
- Sun Valley, NV
- City population
- 23,385
- Population (ZIP)
- 23,385
Population outlook (Washoe County) Hauer SSP2
- Today (2025)
- 499,260 people
- By 2030
- 523,429 · +4.8%
- By 2040
- 564,420 · +13.1%
- By 2050
- 595,548 · +19.3%
- By 2075
- 652,375 · +30.7%
- By 2100
- 661,518 · +32.5%
Race, ethnicity, and origin ACS 2023
- Neighborhood character
- Diverse neighborhood (Simpson 0.56)
- Race & ethnicity
- Hispanic / Latino 53% White 39% Two or more races 16% Native American 3% Asian 1% Black 1%
- Hispanic origin (detail)
- Mexican 46%
- Common ancestry
- Russian 2% Lithuanian 1% Romanian 1%
- Foreign-born
- 20% · Canada
- Languages at home
- 64% English-only · Spanish 34% Other Indo-European 1%
Political lean MEDSL · Washoe
- 2024 margin
- Toss-up / Even · D 49.3% · R 48.3% · Other 2.4%
- 2008→2024 swing
- -11.7pp toward R · 2008: 12.7pp · 2024: 1.0pp
- All cycles
- 2024: D+1.0 2020: D+4.5 2016: D+1.2 2012: D+3.6 2008: D+12.7
Not yet ingested
- Civics
- —
Market trends
- HPI YoY
- ▲ 0.81%
- Current HPI
- 310.5538
- Rent YoY
- —
- Metro
- —
- State GDP YoY
- ▲ 3.08%
- F500 in state
- 6
Industry mix (Fortune 500 HQ in NV)
| Industry | F500 HQs | Revenue |
|---|---|---|
| Hotels / Casinos | 3 | $36B |
|
||
Price history
+471.1% since first listed12 events — show timeline
- 2026-06-13 Listed $199,900 NNRMLS
- 2004-10-20 Sold (Public Records) $150,000 Public Records
- 2004-10-20 Sold (MLS) $142,000 NNRMLS
- 2004-09-20 Listing Removed — NNRMLS
- 2004-09-06 Listed $155,000 NNRMLS
- 2002-05-08 Listing Removed — NNRMLS
- 2002-05-03 Sold (Public Records) $83,000 Public Records
- 2002-05-03 Sold (MLS) $83,000 NNRMLS
- 2002-02-20 Listed $86,000 NNRMLS
- 1995-03-09 Sold (Public Records) $71,500 Public Records
- 1994-09-01 Sold (Public Records) $35,000 Public Records
- 1991-02-01 Sold (Public Records) $35,000 Public Records
Property tax history
+2.7%/yrLatest (2025): $530 · +2.6% YoY. Source: county tax records.
Cash-flow waterfall
monthlySold comps — $/sqft
last 12 mo · ≤1 miLoading sold comps…