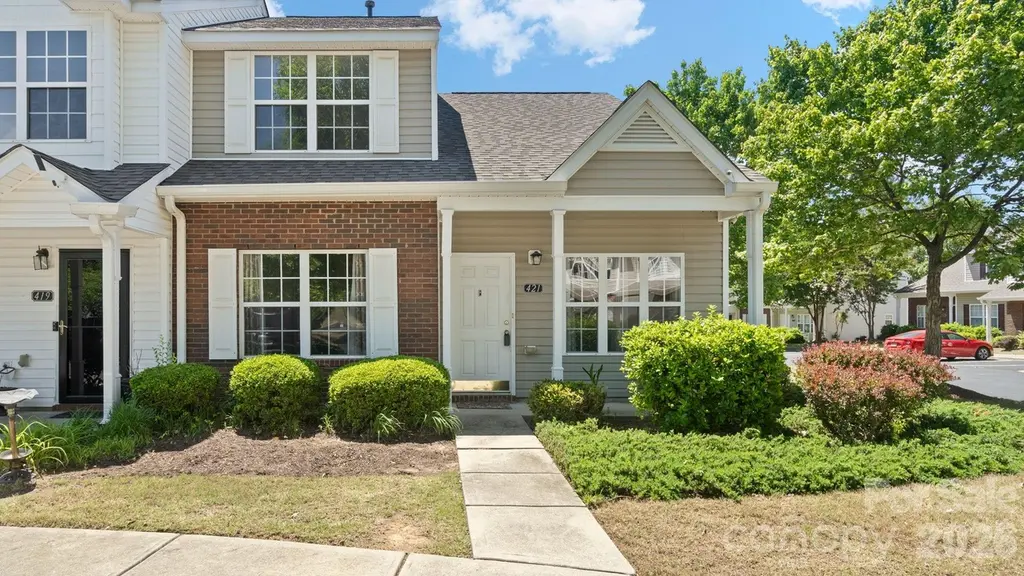
421 Caddy St · Pineville, NC
Flood risk 1/10 · Minimal
- FEMA flood zone
- X (unshaded)
- Chance of flooding over 30 yrs
- 0.0%
- Est. flood insurance / yr
- $507 – $1,088
Fire risk 3/10 · Minor
- Est. fire insurance / yr
- $783 – $1,453
Heat risk 7/10 · Major
- Hot days now (above 106°F)
- 7 days/yr
- Hot days in 30 yrs
- 16 days/yr
Wind risk 6/10 · Moderate
- Chance of severe wind over 30 yrs
- 27.0%
Air-quality risk 3/10 · Minor
- Unhealthy air days now
- 2 days/yr
- Unhealthy air days in 30 yrs
- 3 days/yr
Risk factors via First Street. Map © Google.
Why this score? — see what drove the D- grade
The composite is a weighted blend of 9 inputs, each scored 0–100. Each bar is that input's sub-score; the figure is the points it added to the 100-point composite (weight × sub-score).
- Cash flow +10.9/30.0
- ARV discount +7.5/15.0
- Schools +6.1/10.0
- DSCR +3.2/10.0
- Livability +3.2/5.0
- 1% rule +3.0/10.0
- Rent growth +2.8/5.0
- Condition / age +2.5/5.0
- Appreciation +0.0/10.0
$269,000
🖨 Deal sheet 📄 Offer letter ✓ Due diligence
Listing remarks
Don't miss this beautiful end unit located directly across from the community pool in Cole Creek. Ideally located within the award-winning Fort Mill School District, and close proximity to I-77. This home offers an open floorplan filled with abundant natural light. The main level offers a spacious primary suite with a full bathroom, living room with a vaulted ceiling, and a kitchen and dining area. The dining area opens to a private fenced in patio that is perfect for entertaining. Upstairs you will find an additional bedroom and full bathroom, along with a loft that can easily be converted to a 3rd bedroom or home office. Recent updates include fresh paint, new LVP flooring, and a newly
Key facts
- Recent updates
- Community pool
- End unit
Tags
Property features AI
Finance
- Other: Land included with property
- HOA & community: Mandatory HOA managed by Association Management Group; HOA fee $210 per month; Community is gated with an outdoor pool; Pets allowed
Exterior
- Parking: Assigned parking (2 assigned spaces)
- Utilities: County water; County sewer; Electricity connected; Cable available and connected; Wired internet available; Publicly maintained paved/asphalt road
- Home design: Townhouse (residential); Site-built construction; Completed development; RD-I zoning; Two levels; Entry level is main level
- Construction: Partial brick and vinyl exterior; Slab foundation
- Exterior features: End unit; Patio; Porch; Fenced yard (privacy fencing); Lawn maintenance included; Storage; In-ground private pool
Interior
- Kitchen: Kitchen island; Dishwasher; Electric oven; Electric range; Microwave; Breakfast bar; Pantry
- Bedrooms: 2 bedrooms (1 on main level, 1 on upper level); Upper-level bedroom has a walk-in closet
- Bathrooms: 2 full bathrooms; 1 half bathroom (main level)
- Heating & cooling: Forced air heating (natural gas); Central air conditioning (electric); Ceiling fans
- Interior features: Attic access; Breakfast bar; Kitchen island; Pantry; 10 rooms total; Vaulted ceiling; Ceiling fan(s); Carbon monoxide detector(s); Smoke detector(s)
- Laundry & utility: In-unit laundry hookups (washer hookup, electric dryer hookup); Laundry on main level
Neighborhood map
What this means for you Summary
Snapshot
- This is a 2-bed/2.5-bath single-family listed at $269k.
Deal economics
- At list price, monthly cash flow is $-118 ($-1k/yr) — negative.
- To cash-flow at today's rent, offer at most $248k (7.7% below list).
- To meet the 1% rule (rent ≥ 1% of price), the offer needs to be $215k (20.1% below list).
- Recommended offer: $215k (20.1% below list) — sets the bar for 1% rule.
- Cap rate 5.8% vs local median 3.6% in Pineville — top-decile yield for the area; either an underpriced asset or a hidden risk that comps aren't pricing in. Stress-test before assuming the spread holds.
Location & tenants
- Location reads 63/100 on livability (#406 in NC) — a middle-class / working-renter tenant base. Strengths: commute A+, housing A+, cost of living B+; Watch: crime F, amenities F, health & safety F.
- York 04 (suburban): math 65% / reading 71% proficiency, ranked #1 of 80 in SC (top 1%) — acceptable for families but not a draw, mixed tenant base, ~2y average lease; only 15% free/reduced lunch — higher-income household profile.
- Zoned schools: Nation Ford High (math 74% / reading 94%, grade A, #13 of 196 statewide, top 7%, 1,877 students, 30% FRL) — zoned schools average 30% FRL vs 15% district-wide (16 pts higher); higher-poverty schools than district average — tighter screening recommended.
- Zoned-school proficiency averages 84% at this address vs 68% district-wide (+16 pts) — the actual schools serving this property are materially stronger than the York 04 average implies; a family-tenant draw the district grade alone would hide.
- Market conditions: Rents rising (+1.0%/yr); 7 comparable units currently listed for rent nearby; rentals at typical pace (median 15d on market — plan ~3-4 weeks tenant-placement turnaround); solid renter incomes; 2,550 units permitted in York County in 2024 (350 in 5+ unit buildings).
Forward outlook
- Local home prices are declining (-3.0%/yr); year-one equity from $2k of loan paydown is wiped out by about $8k of value loss. Plan a longer hold.
- York County population projected at +44% by 2050 — long-run rental-demand tailwind backs the buy-and-hold thesis.
Negotiation context
- It's been on market 35 days — a 3% lower offer ($261k) is reasonable based on typical stale-listing flexibility.
- Current owner paid $118k; list at $269k implies a 129% gain — meaningful room to come down on a strong offer.
Risks & watch-outs
- Climate carrying-cost: major wind risk, 27% chance of damaging wind over 30y; extreme-heat days projected 7→16/yr by 2055 (HVAC capex compounding) — expect insurance premiums to compound above CPI over the hold.
Questions for the listing agent
- What do current leases actually rent for vs. the listed asking? Can we see a recent rent roll and the last 12 months of T-12 income?
- It's been on market 35 days. Have you received any prior offers? Is the seller open to a 20% concession, seller financing, or rate buy-down credit?
- What does the HOA fee cover, when was the last increase, and are there any pending special assessments or reserve-fund shortfalls?
- Is there a deadline driving the sale (1031 exchange, divorce, estate, relocation)? That informs how much negotiation room exists.
- Schools are D-rated, which usually means shorter tenancies and higher turnover. Who's the typical renter profile here, and what's been the actual vacancy rate?
- Crime grade is F in this area — have there been break-ins, vandalism, or insurance claims at this property in the last 3 years? What carrier currently insures it and at what premium?
- The area grade is low — what's the realistic commute time and amenity access for the typical tenant pool here? Any planned neighborhood developments (good or bad) we should know about?
- What's the average days-on-market for RENTAL listings here right now (not sales)? A rising rental-DOM trend means longer vacancies and softer asking-rent achievability than the comps imply.
- What's the recent tenant-quality profile in this submarket — average credit score on applications, eviction rate, late-payment / NSF rate, and stable-employment percentage? A property-management company in the area should have these aggregated.
- How much new for-sale + rental construction is in the pipeline within 1–3 miles? Heavy new supply typically softens prices + rents 12–24 months out; constrained supply supports both.
Investment metrics
- 1% rule
- 0.80% ✗
- Cap rate
- 5.77%
- Cash-on-cash
- -1.88%
- DSCR
- 0.92
- GRM
- 10.4
CMA / ARV
No comps found within radius.
Projected returns pro-forma
-3.0% appreciation · 1.0% rent growth · sell at horizon
- IRR
- -21.6%
- Equity multiple
- 0.27×
- Total profit
- $-55,335
- Equity at exit
- $40,109
- IRR
- -20.8%
- Equity multiple
- 0.01×
- Total profit
- $-74,554
- Equity at exit
- $23,258
Cash invested: $75,320 (down + closing). Projections, not guarantees.
Landlord ↔ Tenant lean methodology
- Overall (STATE)
- 85 Strongly Landlord-Friendly
- State North Carolina
- 85 Strongly Landlord-Friendly · R+3
- County
- — inherits STATE
- City
- — inherits STATE
ZIP-level market 29715
- Rents YoY
- 1.0%
- Price-to-rent
- 10.4×
Monthly cashflow live
- Estimated rent
- $2,150 high interval (Pro) →
- Mortgage (P&I)
- −$1,411
- Tax from tax record
- −$84 /mo · $1,008/yr
- Insurance
- −$112
- HOA
- −$210
- Vacancy / Maint / Mgmt
- −$452
- Net cashflow
- $-118
Break-even live
UW: 25.0% down · 7.5% · 30yr · 1.5% tax · 5.0% vac · 8.0% maint · 8.0% mgmt
Financing live
Cash to close
- Down payment
- $67,250
- Closing costs
- $8,070
- Reserves months
- —
- Total cash needed
- —
Loan-product check · same deal, 3 products live
Conventional
25% down · 7.5% · 30yr
- Down + closing
- —
- Monthly P&I
- —
- Monthly cashflow
- —
- DSCR
- —
- Eligible?
- —
Personal DTI + credit; lowest rate.
DSCR
20% down · 8.5% · 30yr
- Down + closing
- —
- Monthly P&I
- —
- Monthly cashflow
- —
- DSCR
- —
- Eligible?
- —
No personal income docs; deal must DSCR.
Hard money
10% down · 12.0% · 12mo
- Down + closing
- —
- Monthly P&I
- —
- Monthly cashflow
- —
- DSCR
- —
- Eligible?
- —
Short-term bridge; refi at stabilization.
Rent comps 7 comps
| Address | Beds | Baths | Sqft | Rent | $/sqft | DOM | Units | Dist |
|---|---|---|---|---|---|---|---|---|
| 14221 S Polk St Pineville, NC | 3.0 | 2.0 | 1656 | $2,522 | $1.52 | 4d | 4 | 0.30mi |
| 17112 Birchwood Farm Rd Pineville, NC | 3.0 | 2.5 | 1874 | $2,930 | $1.56 | 1d | 4 | 0.32mi |
| 315 Flint Hill Rd Fort Mill, SC | 2.0 | 2.0 | 1000 | $1,410 | $1.41 | 15d | 3 | 0.49mi |
| 507 Tayberry Ln Fort Mill, SC | 3.0 | 3.0 | 1500 | $2,500 | $1.67 | 24d | 1 | 0.59mi |
| 125 Charterhouse Ln Fort Mill, SC | 3.0 | 2.5 | 1394 | $1,900 | $1.36 | 2d | 1 | 1.08mi |
| 127 Snead Rd Fort Mill, SC | 3.0 | 2.5 | 1800 | $2,495 | $1.39 | 24d | 1 | 1.41mi |
| 2620 Grantham Place Dr Fort Mill, SC | 3.0 | 3.0 | 1820 | $2,495 | $1.37 | 15d | 1 | 1.44mi |
HOA detail
- Monthly dues
- $210 · $2,520/yr
- Likely covers
- pool
Listing history 9 events
-
2026-06-07status $269,000 Pending 35 DOM
-
2026-06-04days on market $269,000 Active Under Contract 35 DOM
-
2026-06-03days on market $269,000 Active Under Contract 34 DOM
-
2026-06-02days on market $269,000 Active Under Contract 33 DOM
-
2026-06-01days on market $269,000 Active Under Contract 32 DOM
-
2026-05-31days on market $269,000 Active Under Contract 31 DOM
-
2026-05-17historical Active Under Contract
-
2026-04-30$269,000 Active
-
2014-07-03soldstatus $117,500
ⓘ Source: listings_history table (triggers on properties + properties_extension) + one-shot
backfill from property_details.listing_events for pre-trigger history.
Tax reassessment forecast NC · Resets to sale price
- Current annual tax
- $1,008 · $84/mo
- Projected year-2 tax
- $2,206 · $184/mo
- Expected delta
- +$1,198/yr (+$100/mo · 118.8%)
ⓘ Screening estimate from a state-policy table — verify with the county assessor before closing.
Climate risk First Street
- Flood 1/10 Low FEMA zone X (unshaded) · 0% chance over 30 yrs
- Wildfire 3/10 Moderate
- Heat 7/10 Severe 7 d/yr ≥106°F today · 16 d/yr by 30 yrs out
- Wind 6/10 Major 27% chance of damaging wind over 30 yrs
- Air quality 3/10 Moderate 2 unhealthy d/yr today · 3 by 30 yrs out
Nearby sold comps map
Loading sold comps map…
Walkable amenities ~0.75 mi
Loading nearby amenities…
Taxation est. · year 1
- Rental income
- $25,805
- − Mortgage interest
- −$15,068
- − Property taxes
- −$1,008
- − Insurance
- −$1,345
- − Repairs & maintenance
- −$2,064
- − Management
- −$2,064
- − HOA
- −$2,520
- − Depreciation
- −$7,825
- Taxable loss
- −$6,090
- Est. tax savings @ 24.0%
- +$1,462
- After-tax cash flow
- $47/yr
For passive investors: Depreciation is non-cash, so a rental often shows a tax loss while cash-flowing — sheltering income. Rental losses are passive: they offset passive income freely, and up to $25,000/yr can offset ordinary (W-2) income if you actively participate and your MAGI is under $100k (phasing out to $0 by $150k); unused losses carry forward. On sale, claimed depreciation is recaptured at up to 25%, and gains may owe capital-gains tax (a 1031 exchange can defer both). Figures are a year-1 estimate at your 24.0% rate — not tax advice; consult a CPA.
Schools (NCES district)
- District
- York 04
- NCES district ID
- 4503900
- Math proficiency
- 65% ▼ -9.00%
- Reading proficiency
- 71% ▬ 0.00%
- Median HH income
- $79,981
- Composite
- 60.56/100
- National rank
- #835
- State rank
- #1 of 80 in SC
Livability — Pineville
- Score
- 63/100
- State rank
- #406
- US rank
- #15393
Category grades
Schools grade is shown separately in the Schools card above.
Census & demographics
- County
- York County
- City population
- 13,245
- Metro
- Charlotte-Concord-Gastonia, NC-SC
- Population (ZIP)
- 46,865
- Household income
- $109,689
- Rent vs Own
- Severe rent burden
- 680.0
Population outlook (York County) Hauer SSP2
- Today (2025)
- 307,757 people
- By 2030
- 335,979 · +9.2%
- By 2040
- 391,378 · +27.2%
- By 2050
- 443,234 · +44.0%
- By 2075
- 557,102 · +81.0%
- By 2100
- 625,837 · +103.4%
Race, ethnicity, and origin ACS 2023
- Neighborhood character
- Predominantly White (69%)
- Race & ethnicity
- White 69% Black 11% Hispanic / Latino 10% Two or more races 9% Asian 4%
- Hispanic origin (detail)
- Mexican 4%
- Common ancestry
- Serbian 4% Slovak 3% Romanian 3%
- Foreign-born
- 9% · Canada, China, Jamaica
- Languages at home
- 87% English-only · Spanish 7% Other Indo-European 2% Other Asian/Pacific 2%
Political lean MEDSL · York
- 2024 margin
- R (+19.1) · D 39.7% · R 58.8% · Other 1.5%
- 2008→2024 swing
- -1.4pp toward R · 2008: -17.7pp · 2024: -19.1pp
- All cycles
- 2024: R+19.1 2020: R+16.5 2016: R+22.1 2012: R+20.5 2008: R+17.7
Not yet ingested
- Civics
- —
Market trends
- HPI YoY
- ▼ -161.26%
- Current HPI
- 261.4136
- Rent YoY
- ▲ 1.00%
- Metro
- Charlotte-Concord-Gastonia, NC-SC
- State GDP YoY
- ▲ 3.28%
- F500 in state
- 26
Industry mix (Fortune 500 HQ in NC)
| Industry | F500 HQs | Revenue |
|---|---|---|
| Financial Services | 2 | $213B |
|
||
| Retail | 2 | $95B |
|
||
| Industrial Conglomerate | 1 | $38B |
|
||
| Metals / Steel | 1 | $35B |
|
||
| Utilities | 1 | $30B |
|
||
| Industrial Machinery | 1 | $19B |
|
||
Price history
+128.9% since first listed3 events — show timeline
- 2026-05-17 Contingent — CANOPYMLS as Distributed by MLS Grid
- 2026-04-30 Listed $269,000 CANOPYMLS as Distributed by MLS Grid
- 2014-07-03 Sold (Public Records) $117,500 Public Records
Property tax history
-5.8%/yrLatest (2025): $1,008 · +14.4% YoY. Source: county tax records.
Cash-flow waterfall
monthlySold comps — $/sqft
last 12 mo · ≤1 miLoading sold comps…