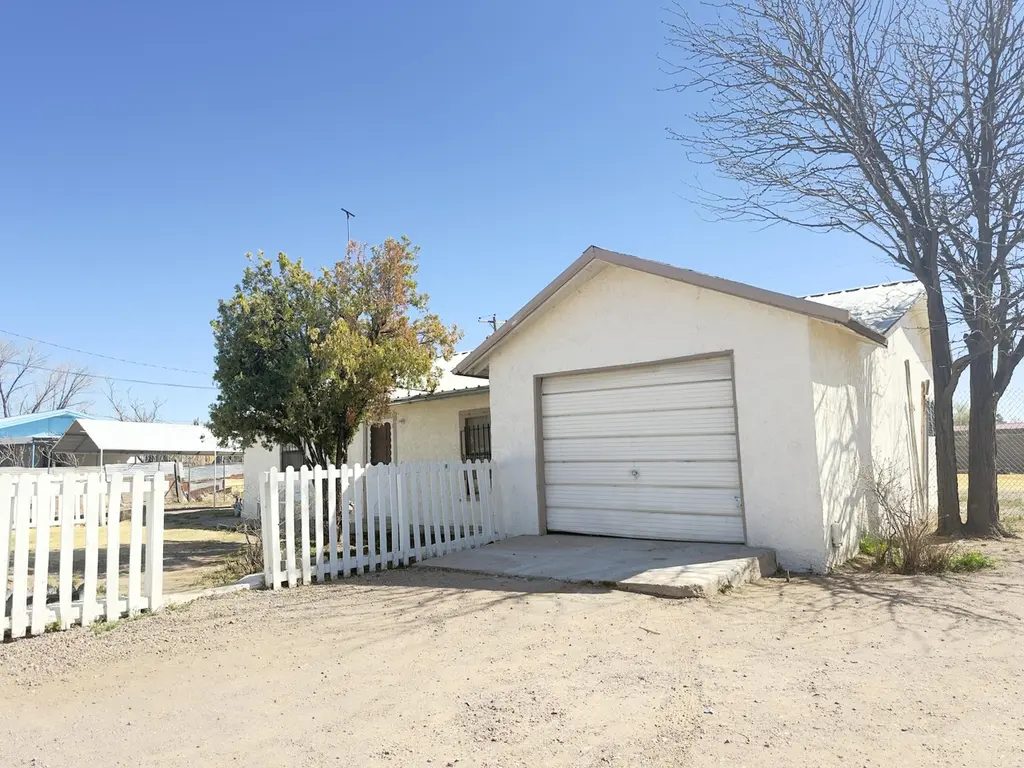
108 Faulkner Rd · Socorro, NM
Flood risk No data
- FEMA flood zone
- —
- Chance of flooding over 30 yrs
- —
- Est. flood insurance / yr
- —
Fire risk No data
- Est. fire insurance / yr
- —
Heat risk No data
- Hot days now (above threshold)
- —
- Hot days in 30 yrs
- —
Wind risk No data
- Chance of severe wind over 30 yrs
- —
Air-quality risk No data
- Unhealthy air days now
- —
- Unhealthy air days in 30 yrs
- —
Risk factors via First Street. Map © Google.
Why this score? — see what drove the D grade
The composite is a weighted blend of 9 inputs, each scored 0–100. Each bar is that input's sub-score; the figure is the points it added to the 100-point composite (weight × sub-score).
- ARV discount +15.0/15.0
- Cash flow +12.6/30.0
- DSCR +3.7/10.0
- Livability +3.2/5.0
- 1% rule +2.5/10.0
- Rent growth +2.5/5.0
- Condition / age +2.5/5.0
- Schools +1.7/10.0
- Appreciation +0.0/10.0
$150,000
🖨 Deal sheet (PDF) 📄 Offer letter ✓ Due diligence
Key facts
- 0.27 acre lot
- Garage
- Built 1953
Neighborhood map
What this means for you Summary
Snapshot
- This is a 3-bed/1.0-bath other listed at $150k.
Deal economics
- At list price, monthly cash flow is $-20 ($-241/yr) — negative.
- To cash-flow at today's rent, offer at most $146k (2.4% below list).
- To meet the 1% rule (rent ≥ 1% of price), the offer needs to be $112k (25.1% below list).
- Recommended offer: $112k (25.1% below list) — sets the bar for 1% rule.
- Cap rate 6.1% vs local median 2.9% in Socorro — top-decile yield for the area; either an underpriced asset or a hidden risk that comps aren't pricing in. Stress-test before assuming the spread holds.
Location & tenants
- Location reads 65/100 on livability (#59 in NM) — a middle-class / working-renter tenant base. Strengths: cost of living A+, housing A+, health & safety B; Watch: employment D+, crime F, commute F.
- Socorro Consolidated Schools (town): math 12% / reading 21% proficiency, ranked #76 of 95 in NM (top 80%) — low school quality limits family demand, transient renter base, plan for 1-2y turnover.
- Zoned schools: R. Sarracino Middle (254 students, 97% FRL); Socorro High (math 34% / reading 64%, grade D, #51 of 110 statewide, top 50%, 450 students, 98% FRL) — zoned schools average 98% FRL vs 60% district-wide (38 pts higher); higher-poverty schools than district average — tighter screening recommended.
- Zoned-school proficiency averages 50% at this address vs 16% district-wide (+33 pts) — the actual schools serving this property are materially stronger than the Socorro Consolidated Schools average implies; a family-tenant draw the district grade alone would hide.
- Market conditions: 100 active listings in the ZIP.
Forward outlook
- Local home prices are declining (-3.0%/yr); year-one equity from $1k of loan paydown is wiped out by about $4k of value loss. Plan a longer hold.
- Socorro County population projected at -22% by 2050 — secular population decline; favor cash flow + early exit over multi-decade hold.
Negotiation context
- It's been on market 100 days — a 9% lower offer ($136k) is reasonable based on typical stale-listing flexibility.
Risks & watch-outs
- Watch-outs: built in 1953 — expect roof / HVAC / electrical / plumbing capex.
Questions for the listing agent
- What do current leases actually rent for vs. the listed asking? Can we see a recent rent roll and the last 12 months of T-12 income?
- It's been on market 100 days. Have you received any prior offers? Is the seller open to a 25% concession, seller financing, or rate buy-down credit?
- Built in 1953 — when were the roof, HVAC, electrical panel, plumbing, and water heater last replaced?
- Why hasn't it sold? Are there any deal-killer items the seller is aware of (foundation, flood, title, zoning, code violations)?
- Is there a deadline driving the sale (1031 exchange, divorce, estate, relocation)? That informs how much negotiation room exists.
- Schools are F-rated, which usually means shorter tenancies and higher turnover. Who's the typical renter profile here, and what's been the actual vacancy rate?
- Crime grade is F in this area — have there been break-ins, vandalism, or insurance claims at this property in the last 3 years? What carrier currently insures it and at what premium?
- The area grade is low — what's the realistic commute time and amenity access for the typical tenant pool here? Any planned neighborhood developments (good or bad) we should know about?
- What's the average days-on-market for RENTAL listings here right now (not sales)? A rising rental-DOM trend means longer vacancies and softer asking-rent achievability than the comps imply.
- What's the recent tenant-quality profile in this submarket — average credit score on applications, eviction rate, late-payment / NSF rate, and stable-employment percentage? A property-management company in the area should have these aggregated.
- How much new for-sale + rental construction is in the pipeline within 1–3 miles? Heavy new supply typically softens prices + rents 12–24 months out; constrained supply supports both.
Investment metrics
- 1% rule
- 0.75% ✗
- Cap rate
- 6.13%
- Cash-on-cash
- -0.57%
- DSCR
- 0.97
- GRM
- 11.1
CMA / ARV
- ARV (median comp)
- $186,500
- List price
- $150,000
- Delta
- -19.57%
- Verdict
- UNDERPRICED
- Comps
- 7 within 1.0 mi
Projected returns pro-forma
-3.0% appreciation · 3.0% rent growth · sell at horizon
- IRR
- -17.3%
- Equity multiple
- 0.39×
- Total profit
- $-25,648
- Equity at exit
- $22,365
- IRR
- -9.4%
- Equity multiple
- 0.42×
- Total profit
- $-24,234
- Equity at exit
- $12,969
Cash invested: $42,000 (down + closing). Projections, not guarantees.
Landlord ↔ Tenant lean methodology
- Overall (STATE)
- 55 Moderately Landlord-Leaning
- State New Mexico
- 55 Moderately Landlord-Leaning · D+3
- County
- — inherits STATE
- City
- — inherits STATE
ZIP-level market 87801
- Active inventory
- 100
- Price-to-rent
- 11.1×
Monthly cashflow live
- Estimated rent
- $1,123 medium interval (Pro) →
- Mortgage (P&I)
- −$787
- Tax from tax record
- −$58 /mo · $700/yr
- Insurance
- −$62
- HOA
- −$0
- Vacancy / Maint / Mgmt
- −$236
- Net cashflow
- $-20
Break-even live
Sensitivity live
| Price | -10% $65 | -5% $22 | +0% $-20 | +5% $-63 | +10% $-105 |
|---|---|---|---|---|---|
| Rent | -10% $-109 | -5% $-64 | +0% $-20 | +5% $24 | +10% $69 |
| Rate | -1.0pp $55 | -0.5pp $18 | base $-20 | +0.5pp $-59 | +1.0pp $-98 |
UW: 25.0% down · 7.5% · 30yr · 1.5% tax · 5.0% vac · 8.0% maint · 8.0% mgmt
Financing live
Cash to close
- Down payment
- $37,500
- Closing costs
- $4,500
- Reserves months
- —
- Total cash needed
- —
Loan-product check · same deal, 3 products live
Conventional
25% down · 7.5% · 30yr
- Down + closing
- —
- Monthly P&I
- —
- Monthly cashflow
- —
- DSCR
- —
- Eligible?
- —
Personal DTI + credit; lowest rate.
DSCR
20% down · 8.5% · 30yr
- Down + closing
- —
- Monthly P&I
- —
- Monthly cashflow
- —
- DSCR
- —
- Eligible?
- —
No personal income docs; deal must DSCR.
Hard money
10% down · 12.0% · 12mo
- Down + closing
- —
- Monthly P&I
- —
- Monthly cashflow
- —
- DSCR
- —
- Eligible?
- —
Short-term bridge; refi at stabilization.
Listing history 17 events
-
2026-06-21days on market $150,000 Active 100 DOM
-
2026-06-21days on market $150,000 Active 99 DOM
-
2026-06-18days on market $150,000 Active 97 DOM
-
2026-06-17days on market $150,000 Active 96 DOM
-
2026-06-16days on market $150,000 Active 95 DOM
-
2026-06-15days on market $150,000 Active 94 DOM
-
2026-06-13days on market $150,000 Active 92 DOM
-
2026-06-12days on market $150,000 Active 91 DOM
-
2026-06-09days on market $150,000 Active 88 DOM
-
2026-06-08days on market $150,000 Active 87 DOM
-
2026-06-07days on market $150,000 Active 86 DOM
-
2026-06-07days on market $150,000 Active 85 DOM
-
2026-06-04days on market $150,000 Active 82 DOM
-
2026-06-02days on market $150,000 Active 81 DOM
-
2026-06-01days on market $150,000 Active 80 DOM
-
2026-05-31days on market $150,000 Active 79 DOM
-
2026-03-10$150,000 Active
ⓘ Source: listings_history table (triggers on properties + properties_extension) + one-shot
backfill from property_details.listing_events for pre-trigger history.
Tax reassessment forecast NM · Resets to sale price
- Current annual tax
- $700 · $58/mo
- Projected year-2 tax
- $1,200 · $100/mo
- Expected delta
- +$500/yr (+$42/mo · 71.5%)
ⓘ Screening estimate from a state-policy table — verify with the county assessor before closing.
Nearby sold comps map
Loading sold comps map…
Walkable amenities ~0.75 mi
Loading nearby amenities…
Taxation est. · year 1
- Rental income
- $13,479
- − Mortgage interest
- −$8,402
- − Property taxes
- −$700
- − Insurance
- −$750
- − Repairs & maintenance
- −$1,078
- − Management
- −$1,078
- − Depreciation
- −$4,364
- Taxable loss
- −$2,894
- Est. tax savings @ 24.0%
- +$694
- After-tax cash flow
- $454/yr
For passive investors: Depreciation is non-cash, so a rental often shows a tax loss while cash-flowing — sheltering income. Rental losses are passive: they offset passive income freely, and up to $25,000/yr can offset ordinary (W-2) income if you actively participate and your MAGI is under $100k (phasing out to $0 by $150k); unused losses carry forward. On sale, claimed depreciation is recaptured at up to 25%, and gains may owe capital-gains tax (a 1031 exchange can defer both). Figures are a year-1 estimate at your 24.0% rate — not tax advice; consult a CPA.
Schools (NCES district)
- District
- Socorro Consolidated Schools
- NCES district ID
- 3502460
- Math proficiency
- 12% —
- Reading proficiency
- 21% —
- Median HH income
- $35,586
- Composite
- 17.01/100
- National rank
- #14193
- State rank
- #76 of 95 in NM
Livability — Socorro
- Score
- 65/100
- State rank
- #59
- US rank
- #13325
Category grades
Schools grade is shown separately in the Schools card above.
Census & demographics
- Census place
- Socorro, NM
- Population (ZIP)
- 9,309
Population outlook (Socorro County) Hauer SSP2
- Today (2025)
- 16,091 people
- By 2030
- 15,334 · -4.7%
- By 2040
- 13,876 · -13.8%
- By 2050
- 12,542 · -22.1%
- By 2075
- 10,157 · -36.9%
- By 2100
- 8,116 · -49.6%
Race, ethnicity, and origin ACS 2023
- Neighborhood character
- Diverse neighborhood (Simpson 0.61)
- Race & ethnicity
- Hispanic / Latino 51% White 36% Two or more races 29% Native American 5% Asian 3%
- Hispanic origin (detail)
- Mexican 24%
- Common ancestry
- Portuguese 1% Italian 1% Slovak 1%
- Foreign-born
- 8% · Canada, South Korea, China
- Languages at home
- 67% English-only · Spanish 26% Other Indo-European 2%
Political lean MEDSL · Socorro
- 2024 margin
- Toss-up / Even · D 46.8% · R 50.5% · Other 2.7%
- 2008→2024 swing
- -24.8pp toward R · 2008: 21.1pp · 2024: -3.7pp
- All cycles
- 2024: R+3.7 2020: D+6.5 2016: D+10.1 2012: D+18.1 2008: D+21.1
Not yet ingested
- Civics
- —
Market trends
- HPI YoY
- ▼ -81.16%
- Current HPI
- 127.044
- Rent YoY
- —
- Metro
- —
- State GDP YoY
- —
- F500 in state
- 0
Price history
1 event — show timeline
- 2026-03-10 Listed $150,000 Southwest MLS
Property tax history
+3.9%/yrLatest (2025): $700 · +17.3% YoY. Source: county tax records.
Cash-flow waterfall
monthlySold comps — $/sqft
last 12 mo · ≤1 miLoading sold comps…