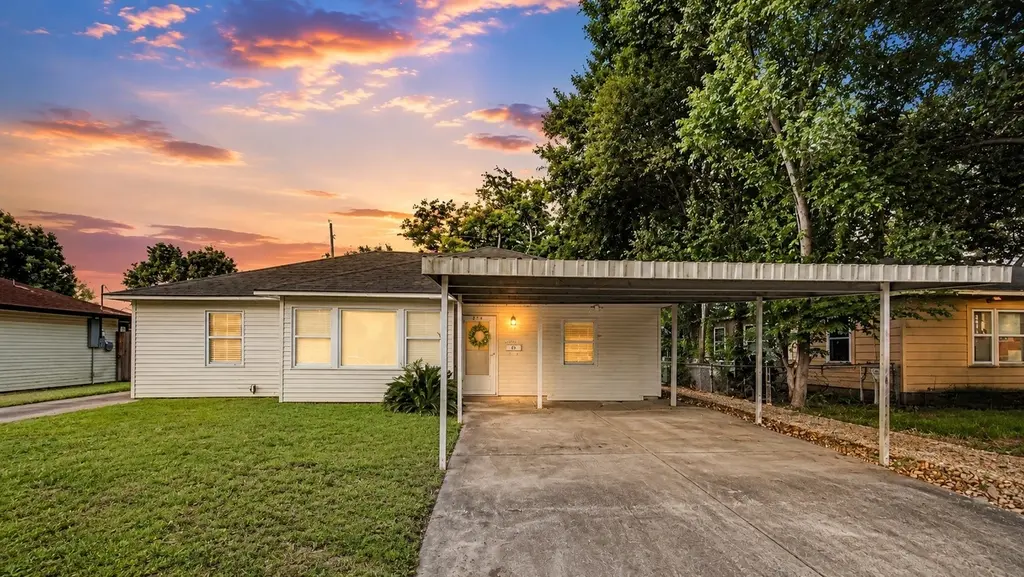
2016 Vince St · Pasadena, TX
Flood risk 6/10 · Moderate
- FEMA flood zone
- X (unshaded)
- Chance of flooding over 30 yrs
- 0.72%
- Est. flood insurance / yr
- $507 – $1,088
Fire risk 1/10 · Minimal
- Est. fire insurance / yr
- $1,222 – $2,270
Heat risk 9/10 · Severe
- Hot days now (above 109°F)
- 6 days/yr
- Hot days in 30 yrs
- 18 days/yr
Wind risk 9/10 · Severe
- Chance of severe wind over 30 yrs
- 99.0%
Air-quality risk 2/10 · Minimal
- Unhealthy air days now
- 2 days/yr
- Unhealthy air days in 30 yrs
- 2 days/yr
Risk factors via First Street. Map © Google.
Why this score? — see what drove the D grade
The composite is a weighted blend of 9 inputs, each scored 0–100. Each bar is that input's sub-score; the figure is the points it added to the 100-point composite (weight × sub-score).
- ARV discount +15.0/15.0
- Cash flow +11.3/30.0
- 1% rule +4.4/10.0
- DSCR +3.3/10.0
- Livability +3.3/5.0
- Schools +2.6/10.0
- Rent growth +2.5/5.0
- Condition / age +2.5/5.0
- Appreciation +0.0/10.0
$184,900
🖨 Deal sheet 📄 Offer letter ✓ Due diligence
Listing remarks
Spacious longtime-owner property with excellent potential, offering a main home PLUS a separate guest house! The main home features 4 bedrooms, 2 baths, a split-bedroom floor plan, large family room with brick fireplace and built-ins, formal living and dining area, spacious kitchen with sit-up breakfast bar, separate breakfast area, two driveways — including a long gated driveway plus a front double driveway with carport — and a covered patio. The guest house offers 2 bedrooms, 1 bath, kitchen, den, utility area + updated vinyl plank flooring in den, carpet in bedrooms, and fresh paint throughout. Recent improvements include 2024 roofs on both homes, main home central A/C replac
Key facts
- Brick fireplace
- Guest house
- Covered patio
Tags
Property features AI
Finance
- HOA & community: Curbs and gutters
Exterior
- Parking: Detached carport; Additional parking; Two carport spaces; Electric gate
- Security: Electric gate
- Utilities: Public water; Public sewer; Concrete road surface
- Home design: Residential property; Single-story (all main rooms on first floor); Slab foundation; Composition roof; Built in 1950
- Construction: Cement siding; Vinyl siding; Slab foundation; Composition roof; Year built: 1950
- Exterior features: Covered patio; Deck; Patio; Fully fenced backyard; Back yard fencing; Garage apartment; Subdivision lot
Interior
- Kitchen: Breakfast bar; Pantry; Kitchen/family room layout
- Bedrooms: Six bedrooms, all on the first floor (including primary bedroom)
- Flooring: Carpet; Tile; Vinyl; Wood
- Bathrooms: Three full bathrooms
- Heating & cooling: Central heating (gas); Central electric air conditioning
- Interior features: Breakfast bar; Kitchen and family room combo; Pantry; Tub with shower; Vanity; Window treatments; Ceiling fan(s); Wood-burning fireplace (1)
- Laundry & utility: Washer hookup; Electric dryer hookup
Neighborhood map
What this means for you Summary
Snapshot
- This is a 3-bed/1.5-bath single-family listed at $185k.
Deal economics
- At list price, monthly cash flow is $-69 ($-825/yr) — negative.
- To cash-flow at today's rent, offer at most $173k (6.6% below list).
- To meet the 1% rule (rent ≥ 1% of price), the offer needs to be $174k (5.8% below list).
- Recommended offer: $173k (6.6% below list) — sets the bar for cash-flow.
- Cap rate 5.8% vs local median 3.4% in Pasadena — top-decile yield for the area; either an underpriced asset or a hidden risk that comps aren't pricing in. Stress-test before assuming the spread holds.
Location & tenants
- Location reads 66/100 on livability (#600 in TX) — a middle-class / working-renter tenant base. Strengths: cost of living A+, housing A+; Watch: employment D+, crime F, amenities F.
- Pasadena ISD (suburban): math 29% / reading 32% proficiency, ranked #612 of 826 in TX (top 74%) — families likely to look elsewhere, expect single-tenant / working-renter base with shorter leases; 71% free/reduced lunch — lower-income household profile, screen leases tightly.
- Zoned schools: South Shaver El (math 23% / reading 28%, grade F, #2,982 of 4,322 statewide, top 70%, 500 students, 96% FRL); Nelda Sullivan Middle (math 21% / reading 23%, grade F, #1,360 of 1,662 statewide, top 83%, 553 students, 94% FRL); Pasadena H S (math 41% / reading 31%, grade F, #930 of 1,632 statewide, top 57%, 2,221 students, 90% FRL) — zoned schools average 93% FRL vs 71% district-wide (22 pts higher); higher-poverty schools than district average — tighter screening recommended.
- Market conditions: 99 active listings in the ZIP; 29,883 units permitted in Harris County in 2024 (8,621 in 5+ unit buildings).
- This rent runs 33% of the median local income ($62k/yr) — at the standard rent-burdened threshold; future hikes will face affordability resistance.
Forward outlook
- Local home prices are declining (-3.0%/yr); year-one equity from $1k of loan paydown is wiped out by about $6k of value loss. Plan a longer hold.
- Harris County population projected at +47% by 2050 — long-run rental-demand tailwind backs the buy-and-hold thesis.
Negotiation context
- Only 6 days on market — expect competitive offers; lowballing is unlikely to land.
Risks & watch-outs
- Watch-outs: property tax is 2.6% of price; built in 1950 — expect roof / HVAC / electrical / plumbing capex.
- Climate carrying-cost: major flood risk; severe wind risk, 99% chance of damaging wind over 30y; extreme-heat days projected 6→18/yr by 2055 (HVAC capex compounding) — expect insurance premiums to compound above CPI over the hold.
Questions for the listing agent
- What do current leases actually rent for vs. the listed asking? Can we see a recent rent roll and the last 12 months of T-12 income?
- Built in 1950 — when were the roof, HVAC, electrical panel, plumbing, and water heater last replaced?
- Property tax is high relative to price — has the assessment been appealed recently, and will the sale trigger a re-assessment?
- Is there a deadline driving the sale (1031 exchange, divorce, estate, relocation)? That informs how much negotiation room exists.
- Schools are D-rated, which usually means shorter tenancies and higher turnover. Who's the typical renter profile here, and what's been the actual vacancy rate?
- Crime grade is F in this area — have there been break-ins, vandalism, or insurance claims at this property in the last 3 years? What carrier currently insures it and at what premium?
- The area grade is low — what's the realistic commute time and amenity access for the typical tenant pool here? Any planned neighborhood developments (good or bad) we should know about?
- What's the average days-on-market for RENTAL listings here right now (not sales)? A rising rental-DOM trend means longer vacancies and softer asking-rent achievability than the comps imply.
- What's the recent tenant-quality profile in this submarket — average credit score on applications, eviction rate, late-payment / NSF rate, and stable-employment percentage? A property-management company in the area should have these aggregated.
- How much new for-sale + rental construction is in the pipeline within 1–3 miles? Heavy new supply typically softens prices + rents 12–24 months out; constrained supply supports both.
Investment metrics
- 1% rule
- 0.94% ✗
- Cap rate
- 5.85%
- Cash-on-cash
- -1.59%
- DSCR
- 0.93
- GRM
- 8.8
CMA / ARV
- ARV (on-the-fly)
- $298,885
- Comps found
- 3
Show comp detail 3 sales within ~0.75 mi
| Address | Dist | Beds/Ba | Sqft | Sold | Price | $/sf | Match |
|---|---|---|---|---|---|---|---|
| 2305 Redwinn Dr | 0.36mi | 4/2.0 (+1) | 2,639 (-0%) | 10mo | $329,000 | $125 | 68 |
| 1606 Oaks Dr | 0.50mi | 4/2.0 (+1) | 2,438 (-8%) | 2mo | $274,500 | $113 | 55 |
| 2102 Merle St | 0.53mi | 4/2.0 (+1) | 2,378 (-10%) | 20mo | $239,000 | $101 | 34 |
Match score weights: distance 35% · size 25% · config 20% · recency 20%. Top-matched comps best support the ARV.
Projected returns pro-forma
-3.0% appreciation · 3.0% rent growth · sell at horizon
- IRR
- -18.8%
- Equity multiple
- 0.34×
- Total profit
- $-34,212
- Equity at exit
- $27,569
- IRR
- -11.2%
- Equity multiple
- 0.33×
- Total profit
- $-34,905
- Equity at exit
- $15,987
Cash invested: $51,772 (down + closing). Projections, not guarantees.
Landlord ↔ Tenant lean methodology
- Overall (STATE)
- 87 Strongly Landlord-Friendly
- State Texas
- 87 Strongly Landlord-Friendly · R+5
- County
- — inherits STATE
- City
- — inherits STATE
ZIP-level market 77502
- Home prices YoY
- -14.2%
- Active inventory
- 99
- Price-to-rent
- 8.8×
Monthly cashflow live
- Estimated rent
- $1,743 medium interval (Pro) →
- Mortgage (P&I)
- −$970
- Tax from tax record
- −$399 /mo · $4,784/yr
- Insurance
- −$77
- HOA
- −$0
- Vacancy / Maint / Mgmt
- −$366
- Net cashflow
- $-69
Break-even live
UW: 25.0% down · 7.5% · 30yr · 1.5% tax · 5.0% vac · 8.0% maint · 8.0% mgmt
Financing live
Cash to close
- Down payment
- $46,225
- Closing costs
- $5,547
- Reserves months
- —
- Total cash needed
- —
Loan-product check · same deal, 3 products live
Conventional
25% down · 7.5% · 30yr
- Down + closing
- —
- Monthly P&I
- —
- Monthly cashflow
- —
- DSCR
- —
- Eligible?
- —
Personal DTI + credit; lowest rate.
DSCR
20% down · 8.5% · 30yr
- Down + closing
- —
- Monthly P&I
- —
- Monthly cashflow
- —
- DSCR
- —
- Eligible?
- —
No personal income docs; deal must DSCR.
Hard money
10% down · 12.0% · 12mo
- Down + closing
- —
- Monthly P&I
- —
- Monthly cashflow
- —
- DSCR
- —
- Eligible?
- —
Short-term bridge; refi at stabilization.
Listing history 6 events
-
2026-06-09status $184,900 Pending 6 DOM
-
2026-06-08days on market $184,900 Active 6 DOM
-
2026-06-07days on market $184,900 Active 5 DOM
-
2026-06-04days on market $184,900 Active 2 DOM
-
2026-06-02remarks 687-char remark
-
2026-06-02$184,900 Active 1 DOM
ⓘ Source: listings_history table (triggers on properties + properties_extension) + one-shot
backfill from property_details.listing_events for pre-trigger history.
Tax reassessment forecast TX · Resets to sale price
- Current annual tax
- $4,784 · $399/mo
- Projected year-2 tax
- $4,784 · $399/mo
- Expected delta
- $0/yr ($0/mo · 0.0%)
ⓘ Screening estimate from a state-policy table — verify with the county assessor before closing.
Climate risk First Street
- Flood 6/10 Major FEMA zone X (unshaded) · 72% chance over 30 yrs
- Wildfire 1/10 Low
- Heat 9/10 Extreme 6 d/yr ≥109°F today · 18 d/yr by 30 yrs out
- Wind 9/10 Extreme 99% chance of damaging wind over 30 yrs
- Air quality 2/10 Low 2 unhealthy d/yr today · 2 by 30 yrs out
Nearby sold comps map
Loading sold comps map…
Walkable amenities ~0.75 mi
Loading nearby amenities…
Taxation est. · year 1
- Rental income
- $20,911
- − Mortgage interest
- −$10,357
- − Property taxes
- −$4,784
- − Insurance
- −$924
- − Repairs & maintenance
- −$1,673
- − Management
- −$1,673
- − Depreciation
- −$5,379
- Taxable loss
- −$3,880
- Est. tax savings @ 24.0%
- +$931
- After-tax cash flow
- $106/yr
For passive investors: Depreciation is non-cash, so a rental often shows a tax loss while cash-flowing — sheltering income. Rental losses are passive: they offset passive income freely, and up to $25,000/yr can offset ordinary (W-2) income if you actively participate and your MAGI is under $100k (phasing out to $0 by $150k); unused losses carry forward. On sale, claimed depreciation is recaptured at up to 25%, and gains may owe capital-gains tax (a 1031 exchange can defer both). Figures are a year-1 estimate at your 24.0% rate — not tax advice; consult a CPA.
Schools (NCES district)
- District
- Pasadena ISD
- NCES district ID
- 4834320
- Math proficiency
- 29% ▼ -17.00%
- Reading proficiency
- 32% ▼ -9.00%
- Median HH income
- $45,163
- Composite
- 26.15/100
- National rank
- #7275
- State rank
- #612 of 826 in TX
Livability — Pasadena
- Score
- 66/100
- State rank
- #600
- US rank
- #11438
Category grades
Schools grade is shown separately in the Schools card above.
Census & demographics
- Census place
- Pasadena, TX
- County
- Harris County · 4,702,590 people
- City population
- 109,190
- Metro
- Houston-The Woodlands-Sugar Land, TX
- Population (ZIP)
- 36,371
- Household income
- $62,500
- Rent vs Own
- Severe rent burden
- 1285.0
Population outlook (Harris County) Hauer SSP2
- Today (2025)
- 5,571,493 people
- By 2030
- 6,089,821 · +9.3%
- By 2040
- 7,142,806 · +28.2%
- By 2050
- 8,185,864 · +46.9%
- By 2075
- 10,574,329 · +89.8%
- By 2100
- 12,109,958 · +117.4%
Race, ethnicity, and origin ACS 2023
- Neighborhood character
- Predominantly Hispanic (83%)
- Race & ethnicity
- Hispanic / Latino 83% Two or more races 37% White 12% Black 4%
- Hispanic origin (detail)
- Mexican 75% Puerto Rican 1% Cuban 2%
- Common ancestry
- Italian 1%
- Foreign-born
- 30% · Canada
- Languages at home
- 40% English-only · Spanish 60%
Political lean MEDSL · Harris
- 2024 margin
- Lean D (+5.5) · D 52.0% · R 46.4% · Other 1.6%
- 2008→2024 swing
- +3.9pp toward D · 2008: 1.6pp · 2024: 5.5pp
- All cycles
- 2024: D+5.5 2020: D+13.3 2016: D+12.4 2012: D+0.1 2008: D+1.6
Not yet ingested
- Civics
- —
Market trends
- HPI YoY
- ▼ -46.12%
- Current HPI
- 278.9293
- Rent YoY
- —
- Metro
- Houston-The Woodlands-Sugar Land, TX
- State GDP YoY
- ▲ 3.95%
- F500 in state
- 110
Industry mix (Fortune 500 HQ in TX)
| Industry | F500 HQs | Revenue |
|---|---|---|
| Energy | 16 | $1,198B |
|
||
| Technology | 5 | $198B |
|
||
| Engineering / Construction | 4 | $72B |
|
||
| Energy Services | 3 | $60B |
|
||
| Utilities | 3 | $41B |
|
||
| Healthcare | 2 | $330B |
|
||
Price history
2 events — show timeline
- 2026-06-02 Listed $184,900 HARMLS
- 1989-06-29 Sold (Public Records) — Public Records
Property tax history
+6.0%/yrLatest (2025): $4,784 · +1.9% YoY. Source: county tax records.
Cash-flow waterfall
monthlySold comps — $/sqft
last 12 mo · ≤1 miLoading sold comps…