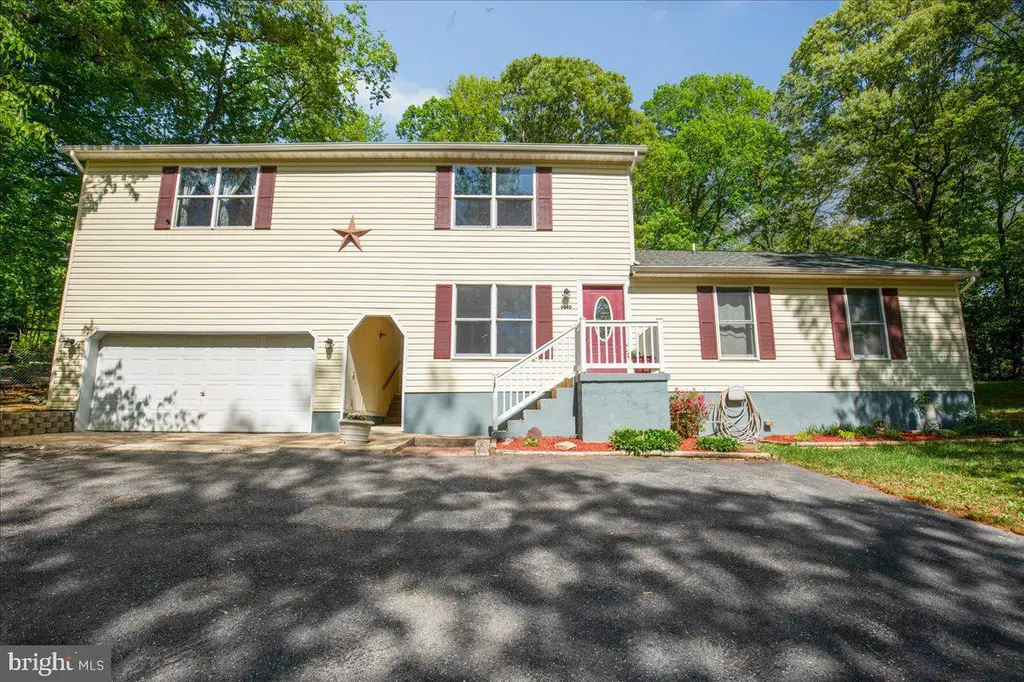
4040 Saint Leonard Rd · St. Leonard, MD
Flood risk 1/10 · Minimal
- FEMA flood zone
- X (unshaded)
- Chance of flooding over 30 yrs
- 0.0%
- Est. flood insurance / yr
- $507 – $1,088
Fire risk 4/10 · Minor
- Est. fire insurance / yr
- $755 – $1,403
Heat risk 8/10 · Major
- Hot days now (above 102°F)
- 7 days/yr
- Hot days in 30 yrs
- 17 days/yr
Wind risk 7/10 · Major
- Chance of severe wind over 30 yrs
- 77.0%
Air-quality risk 3/10 · Minor
- Unhealthy air days now
- 2 days/yr
- Unhealthy air days in 30 yrs
- 3 days/yr
Risk factors via First Street. Map © Google.
Why this score? — see what drove the F grade
The composite is a weighted blend of 9 inputs, each scored 0–100. Each bar is that input's sub-score; the figure is the points it added to the 100-point composite (weight × sub-score).
- ARV discount +11.8/15.0
- Cash flow +5.9/30.0
- Schools +3.3/10.0
- Rent growth +2.5/5.0
- Livability +2.5/5.0
- Condition / age +2.5/5.0
- 1% rule +0.5/10.0
- DSCR +0.3/10.0
- Appreciation +0.0/10.0
$409,900
🖨 Deal sheet 📄 Offer letter ✓ Due diligence
Listing remarks
Tucked away in a peaceful St. Leonard setting, this beautiful 4 bedroom, 2 bath home offers a blend of privacy and comfort on a one acre lot. Modern kitchen with stainless steel appliances. Entertain with ease on a large deck overlooking the backyard. Need space for hobbies or cars? This property is great for that, boasting an attached 2-car garage with lots of cabinets for organization, PLUS a detached 1 car garage/shop perfect for projects or extra storage. Don't miss the huge game room which can be used for home office, or entertaining. and yes it comes with a pool table.
Key facts
- 1 acre lot
- 2 garage spots
- Built 1987
Property features AI
Finance
- Other: Fee simple ownership; Pets allowed with no pet restrictions; Lease not considered
Exterior
- Parking: Front-entry attached garage with 2 garage spaces; Driveway with about 3 spaces; Total of approximately 5 parking spaces
- Utilities: Well water; On-site septic; Electric hot water
- Home design: Detached home; Estimated 2,700 finished square feet; Built (year source: assessor); Property condition: Very good
- Construction: Vinyl siding; Crawl space foundation
- Exterior features: Deck(s); 2nd garage; Gazebo; Shed; Not in a federal flood zone
Interior
- Kitchen: Dishwasher; Microwave; Electric oven/range; Refrigerator; Stainless steel appliances; Extra refrigerator/freezer
- Bedrooms: One bedroom on the main level; Three bedrooms on the lower level
- Flooring: Hardwood; Luxury vinyl tile; Carpet
- Bathrooms: Two full bathrooms (one on main level, one on lower level)
- Heating & cooling: Central heating (electric); Central air conditioning (electric)
- Interior features: Breakfast area; Ceiling fans; Chair railings; Sound system; Walk-in closets; Wood floors
- Laundry & utility: Washer; Dryer; Electric water heater
Neighborhood map
What this means for you Summary
Snapshot
- This is a 4-bed/1.0-bath single-family listed at $410k.
Deal economics
- At list price, monthly cash flow is $-796 ($-10k/yr) — negative.
- To cash-flow at today's rent, offer at most $269k (34.3% below list).
- To meet the 1% rule (rent ≥ 1% of price), the offer needs to be $226k (44.9% below list).
- Recommended offer: $226k (44.9% below list) — sets the bar for 1% rule.
- Cap rate 4.0% vs local median 2.8% in St. Leonard — top-decile yield for the area; either an underpriced asset or a hidden risk that comps aren't pricing in. Stress-test before assuming the spread holds.
Location & tenants
- Location reads: area grade F — affects rentability + tenant quality, not the cash-flow math above.
- Calvert County Public Schools (rural): math 23% / reading 44% proficiency, ranked #5 of 24 in MD (top 21%) — families likely to look elsewhere, expect single-tenant / working-renter base with shorter leases; only 19% free/reduced lunch — higher-income household profile.
- Market conditions: 42 active listings in the ZIP; 101 units permitted in Calvert County in 2024 (0 in 5+ unit buildings).
Forward outlook
- Local home prices are declining (-3.0%/yr); year-one equity from $3k of loan paydown is wiped out by about $12k of value loss. Plan a longer hold.
Negotiation context
- Only 5 days on market — expect competitive offers; lowballing is unlikely to land.
Risks & watch-outs
- Climate carrying-cost: major wind risk, 77% chance of damaging wind over 30y; extreme-heat days projected 7→17/yr by 2055 (HVAC capex compounding) — expect insurance premiums to compound above CPI over the hold.
Questions for the listing agent
- What do current leases actually rent for vs. the listed asking? Can we see a recent rent roll and the last 12 months of T-12 income?
- Is there a deadline driving the sale (1031 exchange, divorce, estate, relocation)? That informs how much negotiation room exists.
- The area grade is low — what's the realistic commute time and amenity access for the typical tenant pool here? Any planned neighborhood developments (good or bad) we should know about?
- What's the average days-on-market for RENTAL listings here right now (not sales)? A rising rental-DOM trend means longer vacancies and softer asking-rent achievability than the comps imply.
- What's the recent tenant-quality profile in this submarket — average credit score on applications, eviction rate, late-payment / NSF rate, and stable-employment percentage? A property-management company in the area should have these aggregated.
- How much new for-sale + rental construction is in the pipeline within 1–3 miles? Heavy new supply typically softens prices + rents 12–24 months out; constrained supply supports both.
Investment metrics
- 1% rule
- 0.55% ✗
- Cap rate
- 3.96%
- Cash-on-cash
- -8.32%
- DSCR
- 0.63
- GRM
- 15.1
CMA / ARV
- ARV (median comp)
- $453,691
- List price
- $409,900
- Delta
- -9.65%
- Verdict
- FAIR
- Comps
- 20 within 1.0 mi
Show comp detail 6 sales within ~0.75 mi
| Address | Dist | Beds/Ba | Sqft | Sold | Price | $/sf | Match |
|---|---|---|---|---|---|---|---|
| 4450 Lancaster Dr | 0.53mi | 4/2.0 | 1,591 (+4%) | 2mo | $390,000 | $245 | 64 |
| 3620 Pine Tree Dr | 0.74mi | 4/2.0 | 1,512 (-2%) | 8mo | $450,000 | $298 | 53 |
| 4789 Calvert Dr | 0.59mi | 3/3.0 (-1) | 1,540 (+0%) | 12mo | $375,000 | $244 | 49 |
| 1650 Walnut Rd | 0.73mi | 3/2.0 (-1) | 1,428 (-7%) | 10mo | $438,000 | $307 | 37 |
| 3650 Poplar Ct | 0.57mi | 3/1.0 (-1) | 1,344 (-12%) | 15mo | $352,900 | $263 | 36 |
| 3570 Hilltop Dr | 0.75mi | 3/2.0 (-1) | 1,352 (-12%) | 13mo | $360,000 | $266 | 25 |
Match score weights: distance 35% · size 25% · config 20% · recency 20%. Top-matched comps best support the ARV.
Projected returns pro-forma
-3.0% appreciation · 3.0% rent growth · sell at horizon
- IRR
- -31.0%
- Equity multiple
- -0.02×
- Total profit
- $-117,240
- Equity at exit
- $61,117
- IRR
- -34.3%
- Equity multiple
- -0.46×
- Total profit
- $-167,862
- Equity at exit
- $35,441
Cash invested: $114,772 (down + closing). Projections, not guarantees.
Landlord ↔ Tenant lean methodology
- Overall (STATE)
- 27 Tenant-Leaning
- State Maryland
- 27 Tenant-Leaning · D+14
- County
- — inherits STATE
- City
- — inherits STATE
ZIP-level market 20685
- Home prices YoY
- -8.1%
- Active inventory
- 42
- Price-to-rent
- 15.1×
Monthly cashflow live
- Estimated rent
- $2,259 medium interval (Pro) →
- Mortgage (P&I)
- −$2,150
- Tax from tax record
- −$260 /mo · $3,125/yr
- Insurance
- −$171
- HOA
- −$0
- Vacancy / Maint / Mgmt
- −$474
- Net cashflow
- $-796
Break-even live
UW: 25.0% down · 7.5% · 30yr · 1.5% tax · 5.0% vac · 8.0% maint · 8.0% mgmt
Financing live
Cash to close
- Down payment
- $102,475
- Closing costs
- $12,297
- Reserves months
- —
- Total cash needed
- —
Loan-product check · same deal, 3 products live
Conventional
25% down · 7.5% · 30yr
- Down + closing
- —
- Monthly P&I
- —
- Monthly cashflow
- —
- DSCR
- —
- Eligible?
- —
Personal DTI + credit; lowest rate.
DSCR
20% down · 8.5% · 30yr
- Down + closing
- —
- Monthly P&I
- —
- Monthly cashflow
- —
- DSCR
- —
- Eligible?
- —
No personal income docs; deal must DSCR.
Hard money
10% down · 12.0% · 12mo
- Down + closing
- —
- Monthly P&I
- —
- Monthly cashflow
- —
- DSCR
- —
- Eligible?
- —
Short-term bridge; refi at stabilization.
Listing history 3 events
-
2026-05-06historical Active Under Contract 584-char remark
-
2026-05-02$409,900 Active 584-char remark
-
2026-04-29historical $409,900 584-char remark
ⓘ Source: listings_history table (triggers on properties + properties_extension) + one-shot
backfill from property_details.listing_events for pre-trigger history.
Tax reassessment forecast MD · Partial reset (capped growth)
- Current annual tax
- $3,125 · $260/mo
- Projected year-2 tax
- $3,797 · $316/mo
- Expected delta
- +$671/yr (+$56/mo · 21.5%)
ⓘ Screening estimate from a state-policy table — verify with the county assessor before closing.
Climate risk First Street
- Flood 1/10 Low FEMA zone X (unshaded) · 0% chance over 30 yrs
- Wildfire 4/10 Moderate
- Heat 8/10 Severe 7 d/yr ≥102°F today · 17 d/yr by 30 yrs out
- Wind 7/10 Severe 77% chance of damaging wind over 30 yrs
- Air quality 3/10 Moderate 2 unhealthy d/yr today · 3 by 30 yrs out
Nearby sold comps map
Loading sold comps map…
Walkable amenities ~0.75 mi
Loading nearby amenities…
Taxation est. · year 1
- Rental income
- $27,111
- − Mortgage interest
- −$22,961
- − Property taxes
- −$3,125
- − Insurance
- −$2,050
- − Repairs & maintenance
- −$2,169
- − Management
- −$2,169
- − Depreciation
- −$11,924
- Taxable loss
- −$17,287
- Est. tax savings @ 24.0%
- +$4,149
- After-tax cash flow
- $-5,403/yr
For passive investors: Depreciation is non-cash, so a rental often shows a tax loss while cash-flowing — sheltering income. Rental losses are passive: they offset passive income freely, and up to $25,000/yr can offset ordinary (W-2) income if you actively participate and your MAGI is under $100k (phasing out to $0 by $150k); unused losses carry forward. On sale, claimed depreciation is recaptured at up to 25%, and gains may owe capital-gains tax (a 1031 exchange can defer both). Figures are a year-1 estimate at your 24.0% rate — not tax advice; consult a CPA.
Schools (NCES district)
- District
- Calvert County Public Schools
- NCES district ID
- 2400150
- Math proficiency
- 23% ▼ -29.00%
- Reading proficiency
- 44% ▼ -15.00%
- Median HH income
- $94,392
- Composite
- 33.27/100
- National rank
- #5511
- State rank
- #5 of 24 in MD
Livability — St. Leonard
No livability data for this city. (Only ~50 U.S. cities are tracked.)
Census & demographics
- Census place
- St. Leonard, MD
- Population (ZIP)
- 6,481
Population outlook (Calvert County) Hauer SSP2
- Today (2025)
- 94,825 people
- By 2030
- 96,197 · +1.4%
- By 2040
- 96,954 · +2.2%
- By 2050
- 94,628 · -0.2%
- By 2075
- 91,576 · -3.4%
- By 2100
- 83,431 · -12.0%
Race, ethnicity, and origin ACS 2023
- Neighborhood character
- Predominantly White (77%)
- Race & ethnicity
- White 77% Black 14% Two or more races 7% Hispanic / Latino 2%
- Common ancestry
- Slovak 3% Iranian 3% Romanian 2%
- Foreign-born
- 2% · Canada, Dominican Republic, South Korea
- Languages at home
- 97% English-only · Spanish 2%
Political lean MEDSL · Calvert
- 2024 margin
- R (+11.0) · D 43.5% · R 54.5% · Other 2.0%
- 2008→2024 swing
- -4.6pp toward R · 2008: -6.3pp · 2024: -11.0pp
- All cycles
- 2024: R+11.0 2020: R+5.6 2016: R+18.4 2012: R+8.2 2008: R+6.3
Not yet ingested
- Civics
- —
Market trends
- HPI YoY
- ▼ -24.36%
- Current HPI
- 277.3103
- Rent YoY
- —
- Metro
- —
- State GDP YoY
- ▲ 2.97%
- F500 in state
- 12
Industry mix (Fortune 500 HQ in MD)
| Industry | F500 HQs | Revenue |
|---|---|---|
| Aerospace / Defense | 1 | $71B |
|
||
| Utilities | 1 | $25B |
|
||
| Hotels | 1 | $24B |
|
||
| Consumer Goods | 1 | $7B |
|
||
| Real Estate | 1 | $6B |
|
||
| Chemicals | 1 | $2B |
|
||
Price history
+0.0% since first listed5 events — show timeline
- 2026-06-09 Sold (MLS) $410,000 BRIGHT MLS
- 2026-05-27 Pending — BRIGHT MLS
- 2026-05-06 Contingent — BRIGHT MLS
- 2026-05-02 Listed $409,900 BRIGHT MLS
- 2026-04-29 Coming Soon $409,900 BRIGHT MLS
Property tax history
+4.5%/yrLatest (2025): $3,125 · +5.6% YoY. Source: county tax records.
Cash-flow waterfall
monthlySold comps — $/sqft
last 12 mo · ≤1 miLoading sold comps…