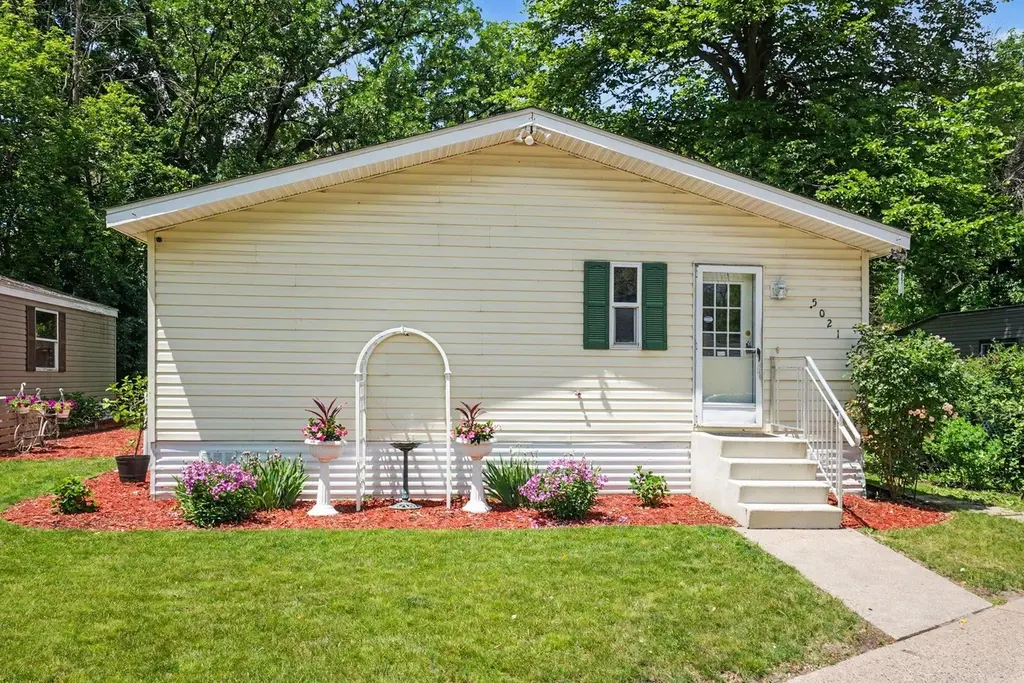
5021 Wellington Ave · Mounds View, MN
Flood risk 1/10 · Minimal
- FEMA flood zone
- X (unshaded)
- Chance of flooding over 30 yrs
- 0.0%
- Est. flood insurance / yr
- $507 – $1,088
Fire risk 2/10 · Minimal
- Est. fire insurance / yr
- $888 – $1,650
Heat risk 2/10 · Minimal
- Hot days now (above 101°F)
- 7 days/yr
- Hot days in 30 yrs
- 13 days/yr
Wind risk 2/10 · Minimal
- Chance of severe wind over 30 yrs
- —
Air-quality risk 2/10 · Minimal
- Unhealthy air days now
- 1 days/yr
- Unhealthy air days in 30 yrs
- 1 days/yr
Risk factors via First Street. Map © Google.
Why this score? — see what drove the D grade
The composite is a weighted blend of 9 inputs, each scored 0–100. Each bar is that input's sub-score; the figure is the points it added to the 100-point composite (weight × sub-score).
- 1% rule +9.3/10.0
- ARV discount +7.5/15.0
- Cash flow +6.1/30.0
- Schools +5.4/10.0
- Livability +4.1/5.0
- Condition / age +3.8/5.0
- Rent growth +3.5/5.0
- DSCR +0.4/10.0
- Appreciation +0.0/10.0
$85,000
🖨 Deal sheet (PDF) 📄 Offer letter ✓ Due diligence
Listing remarks
Fantastic opportunity to own an affordable 3-bedroom, 2-bath manufactured home in the Townsedge Terrace community of Mounds View! Built in 1999 and offering 1,161 finished square feet, this home features all living facilities on one level, vaulted ceilings, central air, an inviting eat-in kitchen, and a spacious primary suite with a private full bath. Two additional bedrooms and a second full bath provide flexibility for family, guests, or a home office. Additional highlights include main-level laundry with washer and dryer included, an exterior storage shed, a recent asphalt shingle roof (per MLS), new furnace, and A/C. The monthly lot lease of $530 includes water, sewer, sanitation, snow
Key facts
- Built 1999
- Listed 4 days
Property features AI
Finance
- Financial info: Land is leased with a land lease amount of $530/month
- HOA & community: Townsedge Terrace HOA; Monthly association fee of $530; HOA covers maintenance of grounds, professional management, sewer, shared amenities, snow removal, and water
Exterior
- Parking: Assigned parking; Guest parking
- Security: Security system; Security lights
- Utilities: City water connected; City sewer connected; Natural gas; Electric with circuit breakers
- Home design: Manufactured home; One level
- Construction: Asphalt roof (age 8 years or less); Other foundation
- Exterior features: Vinyl exterior; Storage shed; No fencing; Light tree coverage; Public transit within about 6 blocks; Paved streets with private road; road is privately maintained
Interior
- Kitchen: Dishwasher; Range; Refrigerator; Exhaust fan
- Bedrooms: 3 bedrooms (all on the main level); Primary bedroom with private full bath and walk-through layout
- Bathrooms: 2 full bathrooms; Main floor full bath
- Heating & cooling: Forced air heating; Central air conditioning
- Interior features: All living facilities on one level; Vaulted ceilings; Ceiling fan(s); Kitchen window; Door lever handles (accessible); Security system; Security lights; Eat-in kitchen / kitchen-dining room
- Laundry & utility: Washer hookup on main level; Washer; Dryer; Gas water heater
Neighborhood map
What this means for you Summary
Snapshot
- This is a 3-bed/2.0-bath manufactured listed at $85k. Condition is rated good.
Deal economics
- At list price, monthly cash flow is $-159 ($-2k/yr) — negative.
- To cash-flow at today's rent, offer at most $62k (27.1% below list).
- Meets the 1% rule at list price ($1k rent vs $85k).
- Recommended offer: $62k (27.1% below list) — sets the bar for cash-flow.
- Cap rate 4.0% vs local median 3.1% in Mounds View — meaningfully above typical; check what's discounted (condition, days-on-market, listing class) to confirm the premium yield is real.
Location & tenants
- Location reads 82/100 on livability (#44 in MN, #1,223 nationally) — a professional / high-income tenant draw. Strengths: commute A+, housing A+, employment A; Watch: amenities F.
- Mounds View Public School District (suburban): math 58% / reading 64% proficiency, ranked #30 of 301 in MN (top 10%) — acceptable for families but not a draw, mixed tenant base, ~2y average lease.
- Zoned schools: Pike Lake Kindergarten Center (595 students, 54% FRL); Edgewood Middle School (math 41% / reading 50%, grade D+, #106 of 258 statewide, top 43%, 699 students, 54% FRL); Irondale Senior High (math 47% / reading 66%, grade C, #77 of 471 statewide, top 17%, 1,706 students, 48% FRL) — zoned schools average 52% FRL vs 24% district-wide (28 pts higher); higher-poverty schools than district average — tighter screening recommended.
- Market conditions: Rents rising fast (+4.1%/yr); 171 active listings in the ZIP; 8 comparable units currently listed for rent nearby; rentals lingering (median 46d on market — plan ~5-8 weeks vacancy on turnover, expect pricing pressure); 50% of comp listings sitting > 30 days — soft ceiling on asking rent; solid renter incomes; 1,202 units permitted in Ramsey County in 2024 (880 in 5+ unit buildings).
- This rent is only 16% of the median local income ($94k/yr) — well below the 30% rent-burden line; pricing power to push rent on renewal without tenant pushback.
Forward outlook
- Local home prices are declining (-3.0%/yr); year-one equity from $588 of loan paydown is wiped out by about $3k of value loss. Plan a longer hold.
- Ramsey County population projected at +27% by 2050 — long-run rental-demand tailwind backs the buy-and-hold thesis.
Negotiation context
- Only 4 days on market — expect competitive offers; lowballing is unlikely to land.
Risks & watch-outs
- Watch-outs: HOA is 44% of rent.
Questions for the listing agent
- What do current leases actually rent for vs. the listed asking? Can we see a recent rent roll and the last 12 months of T-12 income?
- What does the HOA fee cover, when was the last increase, and are there any pending special assessments or reserve-fund shortfalls?
- Is there a deadline driving the sale (1031 exchange, divorce, estate, relocation)? That informs how much negotiation room exists.
- Schools are B-rated — typically a magnet for longer-tenancy family renters. What's the average tenant stay here, and is there a school-zone premium baked into asking?
- The area grade is low — what's the realistic commute time and amenity access for the typical tenant pool here? Any planned neighborhood developments (good or bad) we should know about?
- What's the average days-on-market for RENTAL listings here right now (not sales)? A rising rental-DOM trend means longer vacancies and softer asking-rent achievability than the comps imply.
- What's the recent tenant-quality profile in this submarket — average credit score on applications, eviction rate, late-payment / NSF rate, and stable-employment percentage? A property-management company in the area should have these aggregated.
- How much new for-sale + rental construction is in the pipeline within 1–3 miles? Heavy new supply typically softens prices + rents 12–24 months out; constrained supply supports both.
Investment metrics
- 1% rule
- 1.43% ✓
- Cap rate
- 4.05%
- Cash-on-cash
- -8.03%
- DSCR
- 0.64
- GRM
- 5.8
CMA / ARV
No comps found within radius.
Projected returns pro-forma
-3.0% appreciation · 4.07% rent growth · sell at horizon
- IRR
- -27.2%
- Equity multiple
- 0.07×
- Total profit
- $-22,251
- Equity at exit
- $12,674
- IRR
- -17.6%
- Equity multiple
- -0.07×
- Total profit
- $-25,501
- Equity at exit
- $7,349
Cash invested: $23,800 (down + closing). Projections, not guarantees.
Landlord ↔ Tenant lean methodology
- Overall (STATE)
- 46 Balanced
- State Minnesota
- 46 Balanced · D+2
- County
- — inherits STATE
- City
- — inherits STATE
ZIP-level market 55112
- Rents YoY
- 4.1%
- Active inventory
- 171
- Price-to-rent
- 5.8×
Monthly cashflow live
- Estimated rent
- $1,213 high interval (Pro) →
- Mortgage (P&I)
- −$446
- Tax est. 1.5%
- −$106 /mo · $1,275/yr
- Insurance
- −$35
- HOA
- −$530
- Lot rent leased land?
- −$0
- Vacancy / Maint / Mgmt
- −$255
- Net cashflow
- $-159
Break-even live
Sensitivity live
| Price | -10% $-100 | -5% $-130 | +0% $-159 | +5% $-189 | +10% $-218 |
|---|---|---|---|---|---|
| Rent | -10% $-255 | -5% $-207 | +0% $-159 | +5% $-111 | +10% $-63 |
| Rate | -1.0pp $-116 | -0.5pp $-138 | base $-159 | +0.5pp $-181 | +1.0pp $-204 |
UW: 25.0% down · 7.5% · 30yr · 1.5% tax · 5.0% vac · 8.0% maint · 8.0% mgmt
Financing live
Cash to close
- Down payment
- $21,250
- Closing costs
- $2,550
- Reserves months
- —
- Total cash needed
- —
Loan-product check · same deal, 3 products live
Conventional
25% down · 7.5% · 30yr
- Down + closing
- —
- Monthly P&I
- —
- Monthly cashflow
- —
- DSCR
- —
- Eligible?
- —
Personal DTI + credit; lowest rate.
DSCR
20% down · 8.5% · 30yr
- Down + closing
- —
- Monthly P&I
- —
- Monthly cashflow
- —
- DSCR
- —
- Eligible?
- —
No personal income docs; deal must DSCR.
Hard money
10% down · 12.0% · 12mo
- Down + closing
- —
- Monthly P&I
- —
- Monthly cashflow
- —
- DSCR
- —
- Eligible?
- —
Short-term bridge; refi at stabilization.
Rent comps 8 comps
| Address | Beds | Baths | Sqft | Rent | $/sqft | DOM | Units | Dist |
|---|---|---|---|---|---|---|---|---|
| 7501 Greenfield Ave Saint Paul, MN | 2.0 | 1.0 | 900 | $1,497 | $1.66 | 26d | 1 | 0.90mi |
| 2659 County Road H2 Mounds View, MN | 1.0–2.0 | 1.0 | 825 | $1,489 | $1.80 | 6d | 5 | 0.93mi |
| 7635 Greenfield Ave St Paul, MN | 1.0–2.0 | 1.0 | 925 | $1,600 | $1.73 | 46d | 1 | 1.02mi |
| 7639 Woodlawn Dr New Brighton, MN | 1.0–2.0 | 1.0 | 900 | $1,475 | $1.64 | 46d | 1 | 1.09mi |
| 2300 County Road I Saint Paul, MN | 1.0–2.0 | 1.0 | 950 | $1,497 | $1.58 | 12d | 15 | 1.09mi |
| 7664 Woodlawn Dr Unit 5 Mounds View, MN | 2.0 | 1.0 | 900 | $1,300 | $1.44 | 46d | 1 | 1.13mi |
| 2657 Rice Creek Rd New Brighton, MN | 2.0 | 1.0 | 967 | $1,375 | $1.42 | 6d | 1 | 1.33mi |
| 2651 Mounds View Blvd Unit 2665308 Mounds View, MN | 2.0 | 1.0 | 861 | $1,350 | $1.57 | 46d | 1 | 1.42mi |
HOA detail
- Monthly dues
- $530 · $6,360/yr
- Likely covers
- watersewer
Listing history 4 events
-
2026-06-22days on market $85,000 Active 4 DOM
-
2026-06-21remarks 699-char remark
-
2026-06-21days on market $85,000 Active 3 DOM
-
2026-06-18$85,000 Active 1 DOM
ⓘ Source: listings_history table (triggers on properties + properties_extension) + one-shot
backfill from property_details.listing_events for pre-trigger history.
Climate risk First Street
- Flood 1/10 Low FEMA zone X (unshaded) · 0% chance over 30 yrs
- Wildfire 2/10 Low
- Heat 2/10 Low 7 d/yr ≥101°F today · 13 d/yr by 30 yrs out
- Wind 2/10 Low
- Air quality 2/10 Low 1 unhealthy d/yr today · 1 by 30 yrs out
Nearby sold comps map
Loading sold comps map…
Walkable amenities ~0.75 mi
Loading nearby amenities…
Taxation est. · year 1
- Rental income
- $14,555
- − Mortgage interest
- −$4,761
- − Property taxes
- −$1,275
- − Insurance
- −$425
- − Repairs & maintenance
- −$1,164
- − Management
- −$1,164
- − HOA
- −$6,360
- − Depreciation
- −$2,473
- Taxable loss
- −$3,068
- Est. tax savings @ 24.0%
- +$736
- After-tax cash flow
- $-1,174/yr
For passive investors: Depreciation is non-cash, so a rental often shows a tax loss while cash-flowing — sheltering income. Rental losses are passive: they offset passive income freely, and up to $25,000/yr can offset ordinary (W-2) income if you actively participate and your MAGI is under $100k (phasing out to $0 by $150k); unused losses carry forward. On sale, claimed depreciation is recaptured at up to 25%, and gains may owe capital-gains tax (a 1031 exchange can defer both). Figures are a year-1 estimate at your 24.0% rate — not tax advice; consult a CPA.
Condition & rehab AI · 12 photos
This single-family home is in good condition with a good condition score of 75. It has a cosmetic rehab level and requires minor maintenance and updates to enhance its resale and rental value.
Value-add opportunities
- Resale Paint exterior siding — Fresh paint can enhance curb appeal and property value.
- Resale Replace carpet in living room — New carpet can improve the living room's appearance and comfort.
- Resale Clean and organize kitchen cabinets — A clean and organized kitchen can make the space more appealing to potential buyers.
- Rental Landscaping improvements — Well-maintained landscaping can attract more renters and increase rental value.
- Both Update kitchen appliances — Modern appliances can improve the kitchen's functionality and appeal to both buyers and renters.
- Both Paint interior walls — Fresh paint can improve the overall appearance of the interior and make the home more appealing to both buyers and renters.
Renovation cost estimate screening
Value-add ROI direction
- Resale Paint exterior siding — Fresh paint can enhance curb appeal and property value. ↑
- Resale Replace carpet in living room — New carpet can improve the living room's appearance and comfort. ↑
- Resale Clean and organize kitchen cabinets — A clean and organized kitchen can make the space more appealing to potential buyers. ↑
- Rental Landscaping improvements — Well-maintained landscaping can attract more renters and increase rental value. ↑
- Both Update kitchen appliances — Modern appliances can improve the kitchen's functionality and appeal to both buyers and renters. ↑
- Both Paint interior walls — Fresh paint can improve the overall appearance of the interior and make the home more appealing to both buyers and renters. ↑
ⓘ Cost ranges are severity-bucket heuristics (US national rule-of-thumb). Get contractor quotes + a written scope before underwriting a rehab budget.
Schools (NCES district)
- District
- Mounds View Public School District
- NCES district ID
- 2722950
- Math proficiency
- 58% ▼ -9.00%
- Reading proficiency
- 64% ▼ -3.00%
- Median HH income
- $72,492
- Composite
- 54.04/100
- National rank
- #1390
- State rank
- #30 of 301 in MN
Livability — Mounds View
- Score
- 82/100
- State rank
- #44
- US rank
- #1223
Category grades
Schools grade is shown separately in the Schools card above.
Census & demographics
- Census place
- Mounds View, MN
- County
- Ramsey County · 542,837 people
- Metro
- Minneapolis-St. Paul-Bloomington, MN-WI
- Population (ZIP)
- 45,346
- Household income
- $93,838
- Rent vs Own
- Severe rent burden
- 1134.0
Population outlook (Ramsey County) Hauer SSP2
- Today (2025)
- 603,431 people
- By 2030
- 636,459 · +5.5%
- By 2040
- 700,596 · +16.1%
- By 2050
- 765,819 · +26.9%
- By 2075
- 929,297 · +54.0%
- By 2100
- 1,053,924 · +74.7%
Race, ethnicity, and origin ACS 2023
- Neighborhood character
- Predominantly White (70%)
- Race & ethnicity
- White 70% Black 9% Hispanic / Latino 9% Two or more races 8% Asian 7%
- Hispanic origin (detail)
- Mexican 5%
- Common ancestry
- Portuguese 12% Romanian 5% Scottish 3%
- Foreign-born
- 12% · Canada, China, Vietnam
- Languages at home
- 84% English-only · Spanish 6% Other Asian/Pacific 3% Other Indo-European 1%
Political lean MEDSL · Ramsey
- 2024 margin
- Solid D (+43.3) · D 70.5% · R 27.2% · Other 2.3%
- 2008→2024 swing
- +9.4pp toward D · 2008: 33.9pp · 2024: 43.3pp
- All cycles
- 2024: D+43.3 2020: D+45.4 2016: D+39.4 2012: D+35.3 2008: D+33.9
Not yet ingested
- Civics
- —
Market trends
- HPI YoY
- ▼ -312.77%
- Current HPI
- 254.5083
- Rent YoY
- ▲ 4.07%
- Metro
- Minneapolis-St. Paul-Bloomington, MN-WI
- State GDP YoY
- ▲ 2.41%
- F500 in state
- 34
Industry mix (Fortune 500 HQ in MN)
| Industry | F500 HQs | Revenue |
|---|---|---|
| Healthcare | 2 | $407B |
|
||
| Retail | 2 | $150B |
|
||
| Consumer Goods | 2 | $32B |
|
||
| Industrial Machinery | 2 | $6B |
|
||
| Agriculture | 1 | $40B |
|
||
| Healthcare / Medical Devices | 1 | $32B |
|
||
Price history
1 event — show timeline
- 2026-06-18 Listed $85,000 NORTHSTARMLS as Distributed by MLS Grid
Cash-flow waterfall
monthlySold comps — $/sqft
last 12 mo · ≤1 miLoading sold comps…