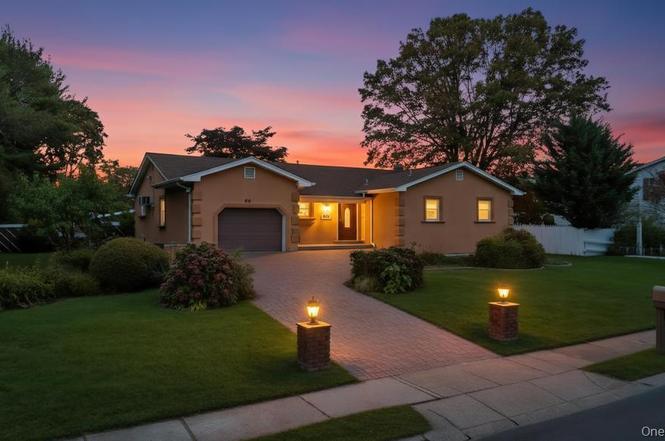
53 Stevenson Pl · Deer Park, NY
Flood risk 1/10 · Minimal
- FEMA flood zone
- X (unshaded)
- Chance of flooding over 30 yrs
- 0.0%
- Est. flood insurance / yr
- $473 – $860
Fire risk 1/10 · Minimal
- Est. fire insurance / yr
- $691 – $1,283
Heat risk 5/10 · Moderate
- Hot days now (above 94°F)
- 7 days/yr
- Hot days in 30 yrs
- 16 days/yr
Wind risk 6/10 · Moderate
- Chance of severe wind over 30 yrs
- 63.0%
Air-quality risk 4/10 · Minor
- Unhealthy air days now
- 4 days/yr
- Unhealthy air days in 30 yrs
- 6 days/yr
Risk factors via First Street. Map © Google.
Why this score? — see what drove the F grade
The composite is a weighted blend of 9 inputs, each scored 0–100. Each bar is that input's sub-score; the figure is the points it added to the 100-point composite (weight × sub-score).
- ARV discount +6.5/15.0
- Schools +5.5/10.0
- Livability +3.8/5.0
- Cash flow +3.5/30.0
- Rent growth +2.5/5.0
- Condition / age +2.5/5.0
- 1% rule +0.5/10.0
- DSCR +0.0/10.0
- Appreciation +0.0/10.0
$674,999
🖨 Deal sheet 📄 Offer letter ✓ Due diligence
Listing remarks
Welcome to 53 Stephenson Place, Deer Park. This beautifully maintained home offers generous space, modern updates, and exceptional functionality. This residence features three spacious bedrooms and three full bathrooms, including a primary suite with a private en-suite bath. The main level provides a comfortable living area, a dedicated dining area, and a den with a wood-burning fireplace. The eat-in kitchen offers excellent workspace and storage, complemented by pantries, hardwood floors throughout, and marble-finish ceilings. Enjoy peace of mind with updated 200-amp electrical service, two heating zones, central AC, and a roof approximately seven years old. The fully finished basement exp
Key facts
- 0.24 acre lot
- Garage
- Built 1968
Neighborhood map
What this means for you Summary
Snapshot
- This is a 3-bed/2.5-bath single-family listed at $675k.
Deal economics
- At list price, monthly cash flow is $-2k ($-25k/yr) — negative.
- To cash-flow at today's rent, offer at most $314k (53.4% below list).
- To meet the 1% rule (rent ≥ 1% of price), the offer needs to be $374k (44.6% below list).
- Recommended offer: $314k (53.4% below list) — sets the bar for cash-flow.
Location & tenants
- Location reads 76/100 on livability (#216 in NY, #3,358 nationally) — a middle-class / working-renter tenant base. Strengths: employment A+, housing A+, health & safety A+; Watch: amenities D, commute F, cost of living F.
- Deer Park Union Free School District (suburban): math 63% / reading 60% proficiency, ranked #181 of 590 in NY (top 31%) — acceptable for families but not a draw, mixed tenant base, ~2y average lease.
- Zoned schools: John Quincy Adams Primary School (484 students, 47% FRL); Robert Frost Middle School (math 30% / reading 60%, grade D, #342 of 729 statewide, top 48%, 903 students, 49% FRL); Deer Park High School (math 95% / reading 57%, grade A-, #616 of 1,100 statewide, top 57%, 1,314 students, 45% FRL) — zoned schools average 47% FRL vs 28% district-wide (19 pts higher); higher-poverty schools than district average — tighter screening recommended.
- Market conditions: 117 active listings in the ZIP; 4 comparable units currently listed for rent nearby; rentals leasing fast (median 11d on market — plan ~1-2 weeks tenant-placement turnaround); 1,366 units permitted in Suffolk County in 2024 (216 in 5+ unit buildings).
Forward outlook
- Local home prices are declining (-3.0%/yr); year-one equity from $5k of loan paydown is wiped out by about $20k of value loss. Plan a longer hold.
- Suffolk County population projected to shrink 5% by 2050 — rents likely to lag national; underwrite the cash flow, not the appreciation.
Negotiation context
- Only 13 days on market — expect competitive offers; lowballing is unlikely to land.
- 9 sale attempts since 14y ago with the ask held roughly flat each time — persistent listings suggest the price (not the market) is what's stuck; bring a comps-based counter.
- Current owner paid $220k; list at $675k implies a 207% gain — meaningful room to come down on a strong offer.
Risks & watch-outs
- Climate carrying-cost: major wind risk, 63% chance of damaging wind over 30y; extreme-heat days projected 7→16/yr by 2055 (HVAC capex compounding) — expect insurance premiums to compound above CPI over the hold.
Questions for the listing agent
- What do current leases actually rent for vs. the listed asking? Can we see a recent rent roll and the last 12 months of T-12 income?
- Built in 1968 — when were the roof, HVAC, electrical panel, plumbing, and water heater last replaced?
- Is there a deadline driving the sale (1031 exchange, divorce, estate, relocation)? That informs how much negotiation room exists.
- Schools are A-rated — typically a magnet for longer-tenancy family renters. What's the average tenant stay here, and is there a school-zone premium baked into asking?
- The area grade is low — what's the realistic commute time and amenity access for the typical tenant pool here? Any planned neighborhood developments (good or bad) we should know about?
- What's the average days-on-market for RENTAL listings here right now (not sales)? A rising rental-DOM trend means longer vacancies and softer asking-rent achievability than the comps imply.
- What's the recent tenant-quality profile in this submarket — average credit score on applications, eviction rate, late-payment / NSF rate, and stable-employment percentage? A property-management company in the area should have these aggregated.
- How much new for-sale + rental construction is in the pipeline within 1–3 miles? Heavy new supply typically softens prices + rents 12–24 months out; constrained supply supports both.
Investment metrics
- 1% rule
- 0.55% ✗
- Cap rate
- 2.66%
- Cash-on-cash
- -12.97%
- DSCR
- 0.42
- GRM
- 15.0
CMA / ARV
- ARV (on-the-fly)
- $659,776
- Comps found
- 12
Show comp detail 12 sales within ~0.75 mi
| Address | Dist | Beds/Ba | Sqft | Sold | Price | $/sf | Match |
|---|---|---|---|---|---|---|---|
| 47 Pearsall Pl | 0.11mi | 3/3.0 | 1,738 (+10%) | 4mo | $704,000 | $405 | 74 |
| 2091 Deer Park Ave | 0.21mi | 4/2.5 (+1) | 1,650 (+4%) | 11mo | $899,000 | $545 | 70 |
| 1 Warwick St | 0.36mi | 3/1.0 | 1,600 (+1%) | 9mo | $675,000 | $422 | 68 |
| 20 Kossuth St | 0.30mi | 2/1.5 (-1) | 1,600 (+1%) | 11mo | $625,000 | $391 | 67 |
| 9 Westwood Ave | 0.43mi | 3/2.0 | 1,528 (-4%) | 11mo | $620,000 | $406 | 62 |
| 640 Carlls Path | 0.47mi | 4/2.0 (+1) | 1,530 (-4%) | 4mo | $715,200 | $467 | 62 |
| 532 Nicolls Rd | 0.66mi | 3/2.0 | 1,498 (-6%) | 0mo | $485,000 | $324 | 58 |
| 27 Taca Blvd | 0.64mi | 4/2.0 (+1) | 1,641 (+4%) | 3mo | $685,000 | $417 | 55 |
| 163 Albany St | 0.40mi | 4/2.5 (+1) | 1,746 (+10%) | 8mo | $718,000 | $411 | 53 |
| 115 Wright Ave | 0.35mi | 4/2.0 (+1) | 1,726 (+9%) | 12mo | $675,000 | $391 | 52 |
| 689 Nicolls Rd | 0.45mi | 4/3.0 (+1) | 1,714 (+8%) | 10mo | $713,000 | $416 | 51 |
| 34 Arcadia Dr | 0.70mi | 4/2.5 (+1) | 1,700 (+7%) | 10mo | $760,000 | $447 | 42 |
Match score weights: distance 35% · size 25% · config 20% · recency 20%. Top-matched comps best support the ARV.
Projected returns pro-forma
-3.0% appreciation · 3.0% rent growth · sell at horizon
- IRR
- -40.4%
- Equity multiple
- -0.27×
- Total profit
- $-239,186
- Equity at exit
- $100,645
- IRR
- -64.9%
- Equity multiple
- -0.98×
- Total profit
- $-374,707
- Equity at exit
- $58,362
Cash invested: $189,000 (down + closing). Projections, not guarantees.
Landlord ↔ Tenant lean methodology
- Overall (STATE)
- 15 Strongly Tenant-Friendly
- State New York
- 15 Strongly Tenant-Friendly · D+10
- County
- — inherits STATE
- City
- — inherits STATE
ZIP-level market 11729
- Active inventory
- 117
- Price-to-rent
- 15.0×
Monthly cashflow live
- Estimated rent
- $3,738 medium interval (Pro) →
- Mortgage (P&I)
- −$3,540
- Tax from tax record
- −$1,174 /mo · $14,086/yr
- Insurance
- −$281
- HOA
- −$0
- Vacancy / Maint / Mgmt
- −$785
- Net cashflow
- $-2,042
Break-even live
UW: 25.0% down · 7.5% · 30yr · 1.5% tax · 5.0% vac · 8.0% maint · 8.0% mgmt
Financing live
Cash to close
- Down payment
- $168,750
- Closing costs
- $20,250
- Reserves months
- —
- Total cash needed
- —
Loan-product check · same deal, 3 products live
Conventional
25% down · 7.5% · 30yr
- Down + closing
- —
- Monthly P&I
- —
- Monthly cashflow
- —
- DSCR
- —
- Eligible?
- —
Personal DTI + credit; lowest rate.
DSCR
20% down · 8.5% · 30yr
- Down + closing
- —
- Monthly P&I
- —
- Monthly cashflow
- —
- DSCR
- —
- Eligible?
- —
No personal income docs; deal must DSCR.
Hard money
10% down · 12.0% · 12mo
- Down + closing
- —
- Monthly P&I
- —
- Monthly cashflow
- —
- DSCR
- —
- Eligible?
- —
Short-term bridge; refi at stabilization.
Rent comps 4 comps
| Address | Beds | Baths | Sqft | Rent | $/sqft | DOM | Units | Dist |
|---|---|---|---|---|---|---|---|---|
| 70 Burlington Ave Deer Park, NY | 3.0 | 1.0 | 1200 | $3,500 | $2.92 | 1d | 1 | 0.74mi |
| 335 Gillette St Dix Hills, NY | 3.0 | 1.0 | 1400 | $3,650 | $2.61 | 11d | 1 | 0.78mi |
| 601 Old Country Rd Deer Park, NY | 4.0 | 1.0 | 1945 | $4,000 | $2.06 | 15d | 1 | 0.78mi |
| 23 Seaman Neck Rd Dix Hills, NY | 3.0 | 1.0 | 1400 | $3,800 | $2.71 | 1d | 1 | 0.79mi |
Listing history 25 events
-
2026-01-07status Pending
-
2025-11-13$674,999 Active
-
2025-11-09historical $674,999
-
2020-01-25historical
-
2019-12-12$459,000 New
-
2019-12-06historical
-
2019-11-10price $469,000
-
2019-10-02price $475,000
-
2019-09-25price $474,000
-
2019-09-11price $474,999
-
2019-08-21$485,000 New
-
2019-05-31historical
-
2019-02-08$499,000 New
-
2018-12-13historical
-
2018-04-27$540,000 New
-
2018-03-04historical
-
2018-03-04price $459,000
-
2018-01-23$439,000 New
-
2017-12-31historical
-
2017-03-20$439,000 New
-
2013-02-02historical
-
2012-03-16historical
-
2012-02-02$389,000
-
2012-02-02$359,000
-
2000-06-20soldstatus $220,000
ⓘ Source: listings_history table (triggers on properties + properties_extension) + one-shot
backfill from property_details.listing_events for pre-trigger history.
Tax reassessment forecast NY · Partial reset (capped growth)
- Current annual tax
- $14,086 · $1,174/mo
- Projected year-2 tax
- $14,086 · $1,174/mo
- Expected delta
- $0/yr ($0/mo · 0.0%)
ⓘ Screening estimate from a state-policy table — verify with the county assessor before closing.
Climate risk First Street
- Flood 1/10 Low FEMA zone X (unshaded) · 0% chance over 30 yrs
- Wildfire 1/10 Low
- Heat 5/10 Major 7 d/yr ≥94°F today · 16 d/yr by 30 yrs out
- Wind 6/10 Major 63% chance of damaging wind over 30 yrs
- Air quality 4/10 Moderate 4 unhealthy d/yr today · 6 by 30 yrs out
Nearby sold comps map
Loading sold comps map…
Walkable amenities ~0.75 mi
Loading nearby amenities…
Taxation est. · year 1
- Rental income
- $44,851
- − Mortgage interest
- −$37,810
- − Property taxes
- −$14,086
- − Insurance
- −$3,375
- − Repairs & maintenance
- −$3,588
- − Management
- −$3,588
- − Depreciation
- −$19,636
- Taxable loss
- −$37,233
- Est. tax savings @ 24.0%
- +$8,936
- After-tax cash flow
- $-15,570/yr
For passive investors: Depreciation is non-cash, so a rental often shows a tax loss while cash-flowing — sheltering income. Rental losses are passive: they offset passive income freely, and up to $25,000/yr can offset ordinary (W-2) income if you actively participate and your MAGI is under $100k (phasing out to $0 by $150k); unused losses carry forward. On sale, claimed depreciation is recaptured at up to 25%, and gains may owe capital-gains tax (a 1031 exchange can defer both). Figures are a year-1 estimate at your 24.0% rate — not tax advice; consult a CPA.
Schools (NCES district)
- District
- Deer Park Union Free School District
- NCES district ID
- 3608880
- Math proficiency
- 63% ▼ -3.00%
- Reading proficiency
- 60% ▼ -5.00%
- Median HH income
- $80,561
- Composite
- 55.26/100
- National rank
- #1268
- State rank
- #181 of 590 in NY
Livability — Deer Park
- Score
- 76/100
- State rank
- #216
- US rank
- #3358
Category grades
Schools grade is shown separately in the Schools card above.
Census & demographics
- Census place
- Deer Park, NY
- City population
- 26,647
- Population (ZIP)
- 26,647
Population outlook (Suffolk County) Hauer SSP2
- Today (2025)
- 1,505,262 people
- By 2030
- 1,498,318 · -0.5%
- By 2040
- 1,471,101 · -2.3%
- By 2050
- 1,424,848 · -5.3%
- By 2075
- 1,337,157 · -11.2%
- By 2100
- 1,217,720 · -19.1%
Race, ethnicity, and origin ACS 2023
- Neighborhood character
- Diverse neighborhood (Simpson 0.67)
- Race & ethnicity
- White 51% Hispanic / Latino 23% Two or more races 13% Black 12% Asian 11%
- Hispanic origin (detail)
- Mexican 1% Puerto Rican 7% Dominican 4%
- Common ancestry
- Hispanic 4% Romanian 3% Armenian 1%
- Foreign-born
- 21% · Canada, China, Jamaica
- Languages at home
- 72% English-only · Spanish 13% Other Indo-European 7% Chinese 3%
Political lean MEDSL · Suffolk
- 2024 margin
- Lean R (+10.0) · D 45.0% · R 55.0%
- 2008→2024 swing
- -16.0pp toward R · 2008: 6.0pp · 2024: -10.0pp
- All cycles
- 2024: R+10.0 2020: R+0.0 2016: R+8.2 2012: D+2.9 2008: D+6.0
Not yet ingested
- Civics
- —
Market trends
- HPI YoY
- ▼ -669.80%
- Current HPI
- 285.3175
- Rent YoY
- —
- Metro
- —
- State GDP YoY
- ▲ 2.60%
- F500 in state
- 92
Industry mix (Fortune 500 HQ in NY)
| Industry | F500 HQs | Revenue |
|---|---|---|
| Financial Services | 10 | $950B |
|
||
| Consumer Goods | 9 | $162B |
|
||
| Insurance | 4 | $225B |
|
||
| Telecommunications | 2 | $144B |
|
||
| Pharmaceuticals | 2 | $112B |
|
||
| Media / Entertainment | 2 | $69B |
|
||
Price history
+206.8% since first listed25 events — show timeline
- 2026-01-07 Pending — OneKey® MLS as Distributed by MLS Grid
- 2025-11-13 Listed $674,999 OneKey® MLS as Distributed by MLS Grid
- 2025-11-09 Coming Soon $674,999 OneKey® MLS as Distributed by MLS Grid
- 2020-01-25 Listing Removed — OneKey® MLS as Distributed by MLS Grid
- 2019-12-12 Listed $459,000 OneKey® MLS as Distributed by MLS Grid
- 2019-12-06 Listing Removed — OneKey® MLS as Distributed by MLS Grid
- 2019-11-10 Price Changed $469,000 OneKey® MLS as Distributed by MLS Grid
- 2019-10-02 Price Changed $475,000 OneKey® MLS as Distributed by MLS Grid
- 2019-09-25 Price Changed $474,000 OneKey® MLS as Distributed by MLS Grid
- 2019-09-11 Price Changed $474,999 OneKey® MLS as Distributed by MLS Grid
- 2019-08-21 Listed $485,000 OneKey® MLS as Distributed by MLS Grid
- 2019-05-31 Listing Removed — OneKey® MLS as Distributed by MLS Grid
- 2019-02-08 Listed $499,000 OneKey® MLS as Distributed by MLS Grid
- 2018-12-13 Listing Removed — OneKey® MLS as Distributed by MLS Grid
- 2018-04-27 Listed $540,000 OneKey® MLS as Distributed by MLS Grid
- 2018-03-04 Listing Removed — OneKey® MLS as Distributed by MLS Grid
- 2018-03-04 Price Changed $459,000 OneKey® MLS as Distributed by MLS Grid
- 2018-01-23 Listed $439,000 OneKey® MLS as Distributed by MLS Grid
- 2017-12-31 Listing Removed — OneKey® MLS as Distributed by MLS Grid
- 2017-03-20 Listed $439,000 OneKey® MLS as Distributed by MLS Grid
- 2013-02-02 Listing Removed — OneKey® MLS as Distributed by MLS Grid
- 2012-03-16 Listing Removed — OneKey® MLS as Distributed by MLS Grid
- 2012-02-02 Listed $359,000 OneKey® MLS as Distributed by MLS Grid
- 2012-02-02 Listed $389,000 OneKey® MLS as Distributed by MLS Grid
- 2000-06-20 Sold (Public Records) $220,000 Public Records
Property tax history
+3.1%/yrLatest (2025): $14,086 · +0.0% YoY. Source: county tax records.
Cash-flow waterfall
monthlySold comps — $/sqft
last 12 mo · ≤1 miLoading sold comps…