3688 Smugglers Cove Rd · Freeland, WA
Flood risk 1/10 · Minimal
- FEMA flood zone
- X (unshaded)
- Chance of flooding over 30 yrs
- 0.0%
- Est. flood insurance / yr
- $507 – $1,088
Fire risk 3/10 · Minor
- Est. fire insurance / yr
- $604 – $1,122
Heat risk 2/10 · Minimal
- Hot days now (above 82°F)
- 8 days/yr
- Hot days in 30 yrs
- 18 days/yr
Wind risk 1/10 · Minimal
- Chance of severe wind over 30 yrs
- —
Air-quality risk 6/10 · Moderate
- Unhealthy air days now
- 8 days/yr
- Unhealthy air days in 30 yrs
- 9 days/yr
Risk factors via First Street. Map © Google.
Why this score? — see what drove the C- grade
The composite is a weighted blend of 9 inputs, each scored 0–100. Each bar is that input's sub-score; the figure is the points it added to the 100-point composite (weight × sub-score).
- Cash flow +16.3/30.0
- ARV discount +7.5/15.0
- Appreciation +6.8/10.0
- Schools +5.6/10.0
- DSCR +5.0/10.0
- 1% rule +3.5/10.0
- Livability +3.2/5.0
- Rent growth +2.5/5.0
- Condition / age +2.5/5.0
$370,000
🖨 Deal sheet (PDF) 📄 Offer letter ✓ Due diligence
Listing remarks MLS
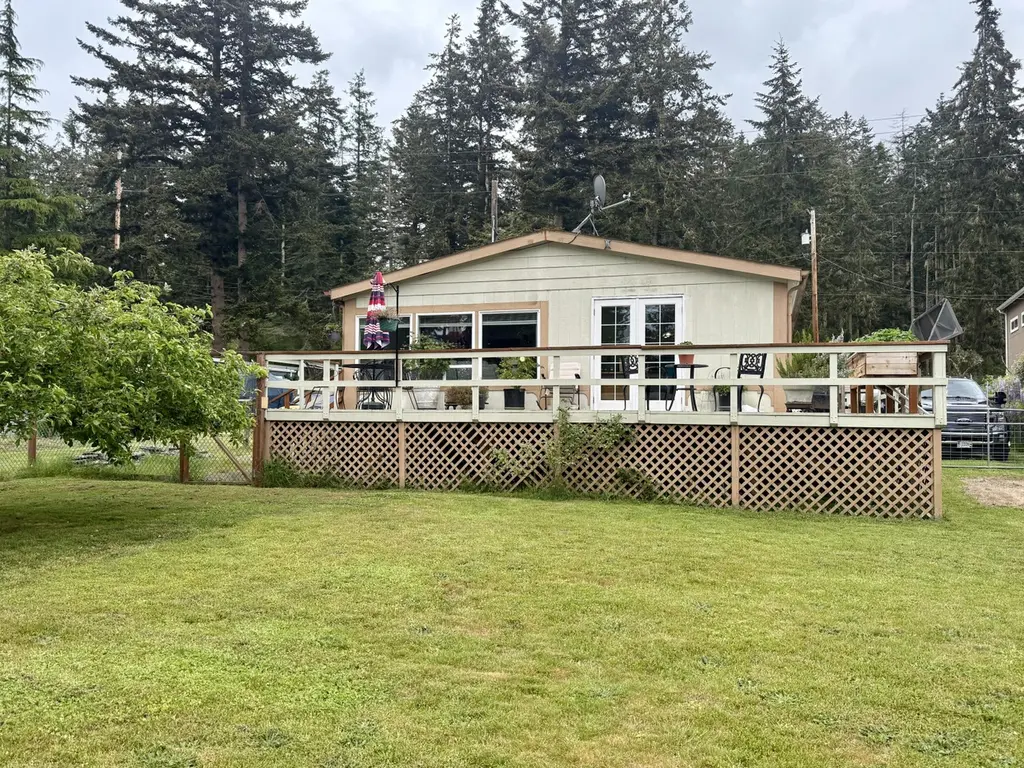
Tucked into the sought-after Lagoon Point community, this 1988 doublewide manufactured home offers established landscaping and peekaboo views of Puget Sound. Enjoy access to the community boat launch, fishing, and beaches just minutes away. Whether you're looking for a full-time residence or the perfect weekend retreat, this home captures the charm of laid-back island living with fresh saltwater air and peaceful surroundings. Inside, you'll find new flooring and stainless steel appliances, making it move-in ready and easy to enjoy from day one.
Key facts
- Large windows
- Private beach access
- Beach access
Tags
Property features AI
Finance
- Other: Lot identified as Lot 3 with dimensions 60 x 177 x 60 x 174; Zoned: County jurisdiction; Located in the Lagoon Point community
- Financial info: Listing terms: Cash or Conventional
- HOA & community: Has HOA; annual fee of $680 (includes water; see remarks); Association contact: Bev Chan
Exterior
- Parking: Detached garage with 2 covered spaces
- Security: Fully fenced
- Utilities: Electric and propane energy sources; Community water; Septic tank sewer; Electric water heater; Puget Sound Energy power; Comcast internet
- Home design: Manufactured home (double wide) on land; One story; Main entry level; Marlet make; Average condition
- Construction: Cement plank (fiber cement) siding; Composition roof; Slab foundation; Effective year built 1988; Manufactured house structure type
- Exterior features: Deck; Fully fenced yard; High-speed internet available; Propane on site; Cement planked exterior; Views; Fruit trees and garden space; Partial slope topography; Beach rights and community waterfront/private beach access; Boat launch available in community; CCRs
Interior
- Kitchen: Kitchen with eating space; Dishwasher; Microwave; Refrigerator; Stove/Range
- Bedrooms: 2 bedrooms (both on the main level); Primary bedroom (main level); Second bedroom (main level)
- Flooring: Vinyl; Vinyl plank
- Bathrooms: 2 full bathrooms (both on the main level); 1 bathtub, 1 shower
- Heating & cooling: Forced air heating; No central cooling
- Interior features: Water heater; Entry hall; Living room; Den/office; Utility room; Primary bath closet water heater location
- Laundry & utility: Utility room (main level)
Neighborhood map
What this means for you Summary
Snapshot
- This is a 2-bed/2.0-bath single-family listed at $370k.
Deal economics
- At list price, monthly cash flow is $203 ($2k/yr) — positive.
- The deal already cash-flows at list — no discount required.
- To meet the 1% rule (rent ≥ 1% of price), the offer needs to be $316k (14.7% below list).
- Recommended offer: $316k (14.7% below list) — sets the bar for 1% rule.
- Cap rate 7.0% vs local median 1.9% in Freeland — top-decile yield for the area; either an underpriced asset or a hidden risk that comps aren't pricing in. Stress-test before assuming the spread holds.
Location & tenants
- Location reads 64/100 on livability (#367 in WA) — a middle-class / working-renter tenant base. Strengths: crime A+, employment A+, housing A; Watch: health & safety C-, amenities F, commute F.
- Coupeville School District (rural): math 54% / reading 73% proficiency, ranked #40 of 291 in WA (top 14%) — acceptable for families but not a draw, mixed tenant base, ~2y average lease.
- Zoned schools: Coupeville Elementary School (491 students, 47% FRL); Coupeville Middle School (216 students, 38% FRL); Coupeville High School (289 students, 36% FRL).
- Market conditions: 37 active listings in the ZIP; 402 units permitted in Island County in 2024 (54 in 5+ unit buildings).
Forward outlook
- In year one you build about $16k of equity ($3k loan paydown + $13k appreciation (3.6% local appreciation)).
- Island County population projected to shrink 6% by 2050 — rents likely to lag national; underwrite the cash flow, not the appreciation.
- At projected returns (3.6% appreciation + 3.0% rent growth), your $104k cash investment doubles in ~5 years — after that, you're playing with house money.
- By year 3, paydown + projected appreciation supports a ~$39k cash-out refi (75% LTV) — recoverable capital for the next deal without selling this one.
Negotiation context
- It's been on market 30 days — a 2% lower offer ($364k) is reasonable based on typical stale-listing flexibility.
- 2 sale attempts; this cycle's ask has dropped $29k (7%) from the opening price — seller is motivated, your offer sets the floor, not the list.
- Current owner paid $150k; list at $370k implies a 147% gain — meaningful room to come down on a strong offer.
Questions for the listing agent
- What does the HOA fee cover, when was the last increase, and are there any pending special assessments or reserve-fund shortfalls?
- Is there a deadline driving the sale (1031 exchange, divorce, estate, relocation)? That informs how much negotiation room exists.
- Schools are F-rated, which usually means shorter tenancies and higher turnover. Who's the typical renter profile here, and what's been the actual vacancy rate?
- What's the average days-on-market for RENTAL listings here right now (not sales)? A rising rental-DOM trend means longer vacancies and softer asking-rent achievability than the comps imply.
- What's the recent tenant-quality profile in this submarket — average credit score on applications, eviction rate, late-payment / NSF rate, and stable-employment percentage? A property-management company in the area should have these aggregated.
- How much new for-sale + rental construction is in the pipeline within 1–3 miles? Heavy new supply typically softens prices + rents 12–24 months out; constrained supply supports both.
Investment metrics
- 1% rule
- 0.85% ✗
- Cap rate
- 6.95%
- Cash-on-cash
- 2.35%
- DSCR
- 1.10
- GRM
- 9.8
CMA / ARV
- ARV (on-the-fly)
- $911,736
- Comps found
- 3
Show comp detail 3 sales within ~0.75 mi
| Address | Dist | Beds/Ba | Sqft | Sold | Price | $/sf | Match |
|---|---|---|---|---|---|---|---|
| 3675 Steelhead Dr | 0.21mi | 2/2.0 | 1,573 (+4%) | 10mo | $825,000 | $524 | 75 |
| 3642 Shorewood Ave | 0.20mi | 2/2.0 | 1,481 (-2%) | 22mo | $938,888 | $634 | 69 |
| 3720 Shorewood Ave | 0.20mi | 3/2.0 (+1) | 1,440 (-5%) | 22mo | $869,000 | $603 | 59 |
Match score weights: distance 35% · size 25% · config 20% · recency 20%. Top-matched comps best support the ARV.
Projected returns pro-forma
3.59% appreciation · 3.0% rent growth · sell at horizon
- IRR
- 11.3%
- Equity multiple
- 1.67×
- Total profit
- $69,045
- Equity at exit
- $178,784
- IRR
- 13.1%
- Equity multiple
- 3.06×
- Total profit
- $213,491
- Equity at exit
- $285,596
Cash invested: $103,600 (down + closing). Projections, not guarantees.
Landlord ↔ Tenant lean methodology
- Overall (STATE)
- 28 Tenant-Leaning
- State Washington
- 28 Tenant-Leaning · D+8
- County
- — inherits STATE
- City
- — inherits STATE
ZIP-level market 98253
- Home prices YoY
- 1.6%
- Active inventory
- 37
- Price-to-rent
- 9.8×
Monthly cashflow live
- Estimated rent
- $3,156 medium interval (Pro) →
- Mortgage (P&I)
- −$1,940
- Tax from tax record
- −$139 /mo · $1,662/yr
- Insurance
- −$154
- HOA
- −$57
- Vacancy / Maint / Mgmt
- −$663
- Net cashflow
- $203
Break-even live
Sensitivity live
| Price | -10% $412 | -5% $308 | +0% $203 | +5% $98 | +10% $-7 |
|---|---|---|---|---|---|
| Rent | -10% $-46 | -5% $78 | +0% $203 | +5% $327 | +10% $452 |
| Rate | -1.0pp $389 | -0.5pp $297 | base $203 | +0.5pp $107 | +1.0pp $9 |
UW: 25.0% down · 7.5% · 30yr · 1.5% tax · 5.0% vac · 8.0% maint · 8.0% mgmt
Financing live
Cash to close
- Down payment
- $92,500
- Closing costs
- $11,100
- Reserves months
- —
- Total cash needed
- —
Loan-product check · same deal, 3 products live
Conventional
25% down · 7.5% · 30yr
- Down + closing
- —
- Monthly P&I
- —
- Monthly cashflow
- —
- DSCR
- —
- Eligible?
- —
Personal DTI + credit; lowest rate.
DSCR
20% down · 8.5% · 30yr
- Down + closing
- —
- Monthly P&I
- —
- Monthly cashflow
- —
- DSCR
- —
- Eligible?
- —
No personal income docs; deal must DSCR.
Hard money
10% down · 12.0% · 12mo
- Down + closing
- —
- Monthly P&I
- —
- Monthly cashflow
- —
- DSCR
- —
- Eligible?
- —
Short-term bridge; refi at stabilization.
HOA detail
- Monthly dues
- $57 · $684/yr
- Likely covers
- waterlandscaping
Listing history 22 events
-
2026-06-21days on market $370,000 Active 30 DOM
-
2026-06-19days on market $370,000 Active 28 DOM
-
2026-06-18days on market $370,000 Active 27 DOM
-
2026-06-17days on market $370,000 Active 26 DOM
-
2026-06-16days on market $370,000 Active 25 DOM
-
2026-06-15days on market $370,000 Active 24 DOM
-
2026-06-14days on market $370,000 Active 22 DOM
-
2026-06-13days on market $370,000 Active 21 DOM
-
2026-06-10days on market $370,000 Active 19 DOM
-
2026-06-09days on market $370,000 Active 18 DOM
-
2026-06-08days on market $370,000 Active 17 DOM
-
2026-06-07days on market $370,000 Active 16 DOM
-
2026-06-05pricedays on market $370,000 Active 13 DOM
-
2026-06-03days on market $399,000 Active 12 DOM
-
2026-06-02days on market $399,000 Active 11 DOM
-
2026-06-01days on market $399,000 Active 10 DOM
-
2026-05-31days on market $399,000 Active 9 DOM
-
2026-05-30days on market $399,000 Active 8 DOM
-
2026-05-14$399,000 Active 550-char remark
Show marketing remark (550 chars)
Tucked into the sought-after Lagoon Point community, this 1988 doublewide manufactured home offers established landscaping and peekaboo views of Puget Sound. Enjoy access to the community boat launch, fishing, and beaches just minutes away. Whether you're looking for a full-time residence or the perfect weekend retreat, this home captures the charm of laid-back island living with fresh saltwater air and peaceful surroundings. Inside, you'll find new flooring and stainless steel appliances, making it move-in ready and easy to enjoy from day one.
-
2006-04-04soldstatus $150,000
-
1988-02-01soldstatus $35,900
-
1987-10-01soldstatus $17,500
ⓘ Source: listings_history table (triggers on properties + properties_extension) + one-shot
backfill from property_details.listing_events for pre-trigger history.
Tax reassessment forecast WA · Resets to sale price
- Current annual tax
- $1,662 · $139/mo
- Projected year-2 tax
- $3,626 · $302/mo
- Expected delta
- +$1,964/yr (+$164/mo · 118.1%)
ⓘ Screening estimate from a state-policy table — verify with the county assessor before closing.
Climate risk First Street
- Flood 1/10 Low FEMA zone X (unshaded) · 0% chance over 30 yrs
- Wildfire 3/10 Moderate
- Heat 2/10 Low 8 d/yr ≥82°F today · 18 d/yr by 30 yrs out
- Wind 1/10 Low
- Air quality 6/10 Major 8 unhealthy d/yr today · 9 by 30 yrs out
Nearby sold comps map
Loading sold comps map…
Walkable amenities ~0.75 mi
Loading nearby amenities…
Taxation est. · year 1
- Rental income
- $37,866
- − Mortgage interest
- −$20,726
- − Property taxes
- −$1,662
- − Insurance
- −$1,850
- − Repairs & maintenance
- −$3,029
- − Management
- −$3,029
- − HOA
- −$684
- − Depreciation
- −$10,764
- Taxable loss
- −$3,878
- Est. tax savings @ 24.0%
- +$931
- After-tax cash flow
- $3,365/yr
For passive investors: Depreciation is non-cash, so a rental often shows a tax loss while cash-flowing — sheltering income. Rental losses are passive: they offset passive income freely, and up to $25,000/yr can offset ordinary (W-2) income if you actively participate and your MAGI is under $100k (phasing out to $0 by $150k); unused losses carry forward. On sale, claimed depreciation is recaptured at up to 25%, and gains may owe capital-gains tax (a 1031 exchange can defer both). Figures are a year-1 estimate at your 24.0% rate — not tax advice; consult a CPA.
Schools (NCES district)
- District
- Coupeville School District
- NCES district ID
- 5301800
- Math proficiency
- 54% ▲ 4.00%
- Reading proficiency
- 73% ▲ 1.00%
- Median HH income
- $57,404
- Composite
- 56.12/100
- National rank
- #2536
- State rank
- #40 of 291 in WA
Livability — Freeland
- Score
- 64/100
- State rank
- #367
- US rank
- #13986
Category grades
Schools grade is shown separately in the Schools card above.
Census & demographics
- City population
- 4,531
- Population (ZIP)
- 2,141
Population outlook (Island County) Hauer SSP2
- Today (2025)
- 82,019 people
- By 2030
- 81,329 · -0.8%
- By 2040
- 78,552 · -4.2%
- By 2050
- 77,042 · -6.1%
- By 2075
- 80,799 · -1.5%
- By 2100
- 84,451 · +3.0%
Race, ethnicity, and origin ACS 2023
- Neighborhood character
- Predominantly White (87%)
- Race & ethnicity
- White 87% Two or more races 10% Hispanic / Latino 5%
- Hispanic origin (detail)
- Mexican 4%
- Common ancestry
- Portuguese 5% Slovak 4% Italian 4%
- Foreign-born
- 6% · Canada
- Languages at home
- 97% English-only · German/W. Germanic 1% Other Asian/Pacific 1%
Political lean MEDSL · Island
- 2024 margin
- D (+16.6) · D 56.8% · R 40.3% · Other 2.9%
- 2008→2024 swing
- +10.3pp toward D · 2008: 6.2pp · 2024: 16.6pp
- All cycles
- 2024: D+16.6 2020: D+12.0 2016: D+5.9 2012: D+4.4 2008: D+6.2
Not yet ingested
- Civics
- —
Market trends
- HPI YoY
- ▲ 3.59%
- Current HPI
- 227.7902
- Rent YoY
- —
- Metro
- —
- State GDP YoY
- ▲ 4.65%
- F500 in state
- 22
Industry mix (Fortune 500 HQ in WA)
| Industry | F500 HQs | Revenue |
|---|---|---|
| Retail | 2 | $269B |
|
||
| Technology / Retail | 1 | $638B |
|
||
| Technology | 1 | $245B |
|
||
| Telecommunications | 1 | $38B |
|
||
| Food / Beverage | 1 | $36B |
|
||
| Automotive / Trucks | 1 | $34B |
|
||
Price history
+2014.3% since first listed7 events — show timeline
- 2026-06-04 Price Changed $370,000 NWMLS as Distributed by MLS Grid
- 2026-06-04 Price Changed $370,000 NEWMLS
- 2026-05-22 Listed $399,000 NWMLS as Distributed by MLS Grid
- 2026-05-14 Listed $399,000 NEWMLS
- 2006-04-04 Sold (Public Records) $150,000 Public Records
- 1988-02-01 Sold (Public Records) $35,900 Public Records
- 1987-10-01 Sold (Public Records) $17,500 Public Records
Property tax history
+2.1%/yrLatest (2026): $1,662 · -2.6% YoY. Source: county tax records.
Cash-flow waterfall
monthlySold comps — $/sqft
last 12 mo · ≤1 miLoading sold comps…