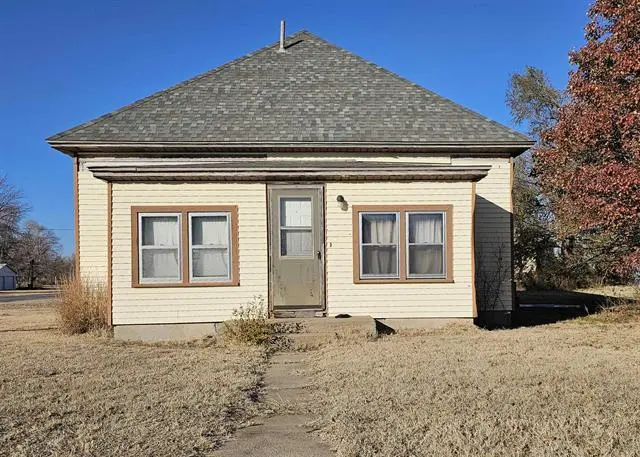
102 E Pennsylvania Ave · Greensburg, KS
Flood risk 1/10 · Minimal
- FEMA flood zone
- —
- Chance of flooding over 30 yrs
- 0.0%
- Est. flood insurance / yr
- —
Fire risk 7/10 · Major
- Est. fire insurance / yr
- $1,154 – $2,142
Heat risk 5/10 · Moderate
- Hot days now (above 104°F)
- 7 days/yr
- Hot days in 30 yrs
- 18 days/yr
Wind risk 2/10 · Minimal
- Chance of severe wind over 30 yrs
- —
Air-quality risk 1/10 · Minimal
- Unhealthy air days now
- 0 days/yr
- Unhealthy air days in 30 yrs
- 0 days/yr
Risk factors via First Street. Map © Google.
Why this score? — see what drove the D+ grade
The composite is a weighted blend of 9 inputs, each scored 0–100. Each bar is that input's sub-score; the figure is the points it added to the 100-point composite (weight × sub-score).
- Cash flow +15.0/30.0
- ARV discount +7.5/15.0
- 1% rule +5.0/10.0
- DSCR +5.0/10.0
- Appreciation +4.7/10.0
- Livability +3.6/5.0
- Schools +3.0/10.0
- Rent growth +2.5/5.0
- Condition / age +2.5/5.0
$19,000
🖨 Deal sheet (PDF) 📄 Offer letter ✓ Due diligence
Key facts
- 6,000 sq ft lot
- Parking
- Built 1907
Property features AI
Exterior
- Parking: 1 parking space
- Utilities: Public water; Public sewer
- Home design: Single-family residence; One story
- Construction: Frame construction with vinyl siding; Composition roof; Concrete perimeter foundation; Built area above grade: 896
- Exterior features: Porch
Interior
- Kitchen: Dishwasher; Electric oven; Refrigerator; Gas water heater
- Bedrooms: Bedrooms on one level
- Flooring: Carpet
- Bathrooms: 1 full bathroom
- Heating & cooling: Wood heating; Ceiling fans; Window air conditioning units
- Interior features: Double-pane and storm windows; Wood burning stove
- Laundry & utility: Main level laundry
Neighborhood map
What this means for you Summary
Snapshot
- This is a 1-bed/1.0-bath single-family listed at $19k.
Deal economics
- At list price, monthly cash flow is $543 ($7k/yr) — positive.
- The deal already cash-flows at list — no discount required.
- Meets the 1% rule at list price ($854 rent vs $19k).
- Recommended offer: $18k (3.0% below list) — sets the bar for market timing.
Location & tenants
- Location reads 72/100 on livability (#122 in KS) — a middle-class / working-renter tenant base. Strengths: cost of living A+, health & safety A+, housing B+; Watch: schools C-, crime D-, amenities F.
- Kiowa County (rural): math 30% / reading 35% proficiency, ranked #145 of 280 in KS (top 52%) — families likely to look elsewhere, expect single-tenant / working-renter base with shorter leases.
- Market conditions: 2 active listings in the ZIP; 5 units permitted in Kiowa County in 2024 (0 in 5+ unit buildings).
Forward outlook
- In year one you build about $6 of equity ($131 loan paydown + $-125 appreciation (-0.7% local appreciation)).
- Kiowa County population projected at +5% by 2050 — modest demand growth; plan on rents tracking national, not racing it.
- At projected returns (-0.7% appreciation + 3.0% rent growth), your $5k cash investment doubles in ~1 year — after that, you're playing with house money.
Negotiation context
- It's been on market 45 days — a 3% lower offer ($18k) is reasonable based on typical stale-listing flexibility.
- Current owner paid $10k; list at $19k implies a 90% gain — meaningful room to come down on a strong offer.
Risks & watch-outs
- Watch-outs: built in 1907 — expect roof / HVAC / electrical / plumbing capex.
- Climate carrying-cost: major wildfire risk; extreme-heat days projected 7→18/yr by 2055 (HVAC capex compounding) — expect insurance premiums to compound above CPI over the hold.
Questions for the listing agent
- It's been on market 45 days. Have you received any prior offers? Is the seller open to a 3% concession, seller financing, or rate buy-down credit?
- Built in 1907 — when were the roof, HVAC, electrical panel, plumbing, and water heater last replaced?
- Is there a deadline driving the sale (1031 exchange, divorce, estate, relocation)? That informs how much negotiation room exists.
- Crime grade is D in this area — have there been break-ins, vandalism, or insurance claims at this property in the last 3 years? What carrier currently insures it and at what premium?
- The area grade is low — what's the realistic commute time and amenity access for the typical tenant pool here? Any planned neighborhood developments (good or bad) we should know about?
- What's the average days-on-market for RENTAL listings here right now (not sales)? A rising rental-DOM trend means longer vacancies and softer asking-rent achievability than the comps imply.
- What's the recent tenant-quality profile in this submarket — average credit score on applications, eviction rate, late-payment / NSF rate, and stable-employment percentage? A property-management company in the area should have these aggregated.
- How much new for-sale + rental construction is in the pipeline within 1–3 miles? Heavy new supply typically softens prices + rents 12–24 months out; constrained supply supports both.
Investment metrics
- 1% rule
- 4.49% ✓
- Cap rate
- 40.59%
- Cash-on-cash
- 122.51%
- DSCR
- 6.45
- GRM
- 1.9
CMA / ARV
No comps found within radius.
Projected returns pro-forma
-0.66% appreciation · 3.0% rent growth · sell at horizon
- IRR
- —
- Equity multiple
- 7.29×
- Total profit
- $33,468
- Equity at exit
- $4,900
- IRR
- —
- Equity multiple
- 15.21×
- Total profit
- $75,593
- Equity at exit
- $5,417
Cash invested: $5,320 (down + closing). Projections, not guarantees.
Landlord ↔ Tenant lean methodology
- Overall (STATE)
- 83 Strongly Landlord-Friendly
- State Kansas
- 83 Strongly Landlord-Friendly · R+10
- County
- — inherits STATE
- City
- — inherits STATE
ZIP-level market 67054
- Home prices YoY
- -0.4%
- Active inventory
- 2
- Price-to-rent
- 1.9×
Monthly cashflow live
- Estimated rent
- $854 medium interval (Pro) →
- Mortgage (P&I)
- −$100
- Tax est. 1.5%
- −$24 /mo · $285/yr
- Insurance
- −$8
- HOA
- −$0
- Vacancy / Maint / Mgmt
- −$179
- Net cashflow
- $543
Break-even live
Sensitivity live
| Price | -10% $556 | -5% $550 | +0% $543 | +5% $537 | +10% $530 |
|---|---|---|---|---|---|
| Rent | -10% $476 | -5% $509 | +0% $543 | +5% $577 | +10% $611 |
| Rate | -1.0pp $553 | -0.5pp $548 | base $543 | +0.5pp $538 | +1.0pp $533 |
UW: 25.0% down · 7.5% · 30yr · 1.5% tax · 5.0% vac · 8.0% maint · 8.0% mgmt
Financing live
Cash to close
- Down payment
- $4,750
- Closing costs
- $570
- Reserves months
- —
- Total cash needed
- —
Loan-product check · same deal, 3 products live
Conventional
25% down · 7.5% · 30yr
- Down + closing
- —
- Monthly P&I
- —
- Monthly cashflow
- —
- DSCR
- —
- Eligible?
- —
Personal DTI + credit; lowest rate.
DSCR
20% down · 8.5% · 30yr
- Down + closing
- —
- Monthly P&I
- —
- Monthly cashflow
- —
- DSCR
- —
- Eligible?
- —
No personal income docs; deal must DSCR.
Hard money
10% down · 12.0% · 12mo
- Down + closing
- —
- Monthly P&I
- —
- Monthly cashflow
- —
- DSCR
- —
- Eligible?
- —
Short-term bridge; refi at stabilization.
Listing history 14 events
-
2026-06-13status $19,000 Pending 45 DOM
-
2026-06-12days on market $19,000 Active 45 DOM
-
2026-06-09days on market $19,000 Active 42 DOM
-
2026-06-08days on market $19,000 Active 41 DOM
-
2026-06-07days on market $19,000 Active 40 DOM
-
2026-06-05days on market $19,000 Active 38 DOM
-
2026-06-04days on market $19,000 Active 36 DOM
-
2026-06-03price $19,000 Active 35 DOM
-
2026-06-02days on market $35,000 Active 35 DOM
-
2026-06-01days on market $35,000 Active 34 DOM
-
2026-05-31days on market $35,000 Active 33 DOM
-
2026-05-31days on market $35,000 Active 32 DOM
-
2024-12-02$35,000 Active
-
2000-02-01soldstatus $10,000
ⓘ Source: listings_history table (triggers on properties + properties_extension) + one-shot
backfill from property_details.listing_events for pre-trigger history.
Climate risk First Street
- Flood 1/10 Low 0% chance over 30 yrs
- Wildfire 7/10 Severe
- Heat 5/10 Major 7 d/yr ≥104°F today · 18 d/yr by 30 yrs out
- Wind 2/10 Low
- Air quality 1/10 Low 0 unhealthy d/yr today · 0 by 30 yrs out
Nearby sold comps map
Loading sold comps map…
Walkable amenities ~0.75 mi
Loading nearby amenities…
Taxation est. · year 1
- Rental income
- $10,244
- − Mortgage interest
- −$1,064
- − Property taxes
- −$285
- − Insurance
- −$95
- − Repairs & maintenance
- −$820
- − Management
- −$820
- − Depreciation
- −$553
- Taxable income
- $6,608
- Est. tax owed @ 24.0%
- −$1,586
- After-tax cash flow
- $4,931/yr
For passive investors: Depreciation is non-cash, so a rental often shows a tax loss while cash-flowing — sheltering income. Rental losses are passive: they offset passive income freely, and up to $25,000/yr can offset ordinary (W-2) income if you actively participate and your MAGI is under $100k (phasing out to $0 by $150k); unused losses carry forward. On sale, claimed depreciation is recaptured at up to 25%, and gains may owe capital-gains tax (a 1031 exchange can defer both). Figures are a year-1 estimate at your 24.0% rate — not tax advice; consult a CPA.
Schools (NCES district)
- District
- Kiowa County
- NCES district ID
- 2006720
- Math proficiency
- 30% ▲ 5.00%
- Reading proficiency
- 35% ▬ 0.00%
- Median HH income
- $43,375
- Composite
- 30.36/100
- National rank
- #11529
- State rank
- #145 of 280 in KS
Livability — Greensburg
- Score
- 72/100
- State rank
- #122
- US rank
- #6402
Category grades
Schools grade is shown separately in the Schools card above.
Census & demographics
- Census place
- Greensburg, KS
- Population (ZIP)
- 1,272
Population outlook (Kiowa County) Hauer SSP2
- Today (2025)
- 2,544 people
- By 2030
- 2,553 · +0.4%
- By 2040
- 2,570 · +1.0%
- By 2050
- 2,660 · +4.6%
- By 2075
- 3,149 · +23.8%
- By 2100
- 3,651 · +43.5%
Race, ethnicity, and origin ACS 2023
- Neighborhood character
- Predominantly White (90%)
- Race & ethnicity
- White 90% Two or more races 6% Hispanic / Latino 4%
- Common ancestry
- Italian 2% Polish 2% Slovak 2%
- Foreign-born
- 3% · Canada, South Korea
- Languages at home
- 92% English-only · Spanish 4% German/W. Germanic 2% Korean 1%
Political lean MEDSL · Kiowa
- 2024 margin
- Solid R (+71.4) · D 13.6% · R 85.0% · Other 1.4%
- 2008→2024 swing
- -8.6pp toward R · 2008: -62.7pp · 2024: -71.4pp
- All cycles
- 2024: R+71.4 2020: R+70.6 2016: R+72.7 2012: R+71.5 2008: R+62.7
Not yet ingested
- Civics
- —
Market trends
- HPI YoY
- ▼ -0.66%
- Current HPI
- 155.3603
- Rent YoY
- —
- Metro
- —
- State GDP YoY
- —
- F500 in state
- 0
Price history
+250.0% since first listed2 events — show timeline
- 2024-12-02 Listed $35,000 GardenMLS
- 2000-02-01 Sold (Public Records) $10,000 Public Records
Cash-flow waterfall
monthlySold comps — $/sqft
last 12 mo · ≤1 miLoading sold comps…