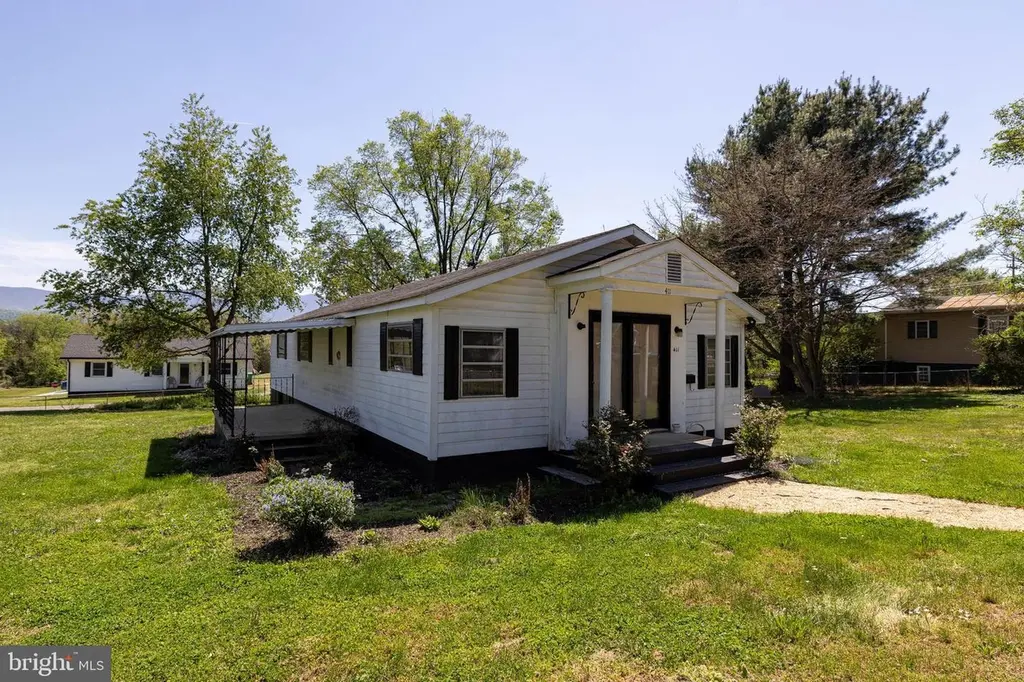
411 Fourth St · Luray, VA
Flood risk No data
- FEMA flood zone
- —
- Chance of flooding over 30 yrs
- —
- Est. flood insurance / yr
- —
Fire risk No data
- Est. fire insurance / yr
- —
Heat risk No data
- Hot days now (above threshold)
- —
- Hot days in 30 yrs
- —
Wind risk No data
- Chance of severe wind over 30 yrs
- —
Air-quality risk No data
- Unhealthy air days now
- —
- Unhealthy air days in 30 yrs
- —
Risk factors via First Street. Map © Google.
Why this score? — see what drove the C grade
The composite is a weighted blend of 9 inputs, each scored 0–100. Each bar is that input's sub-score; the figure is the points it added to the 100-point composite (weight × sub-score).
- Cash flow +19.9/30.0
- ARV discount +15.0/15.0
- DSCR +6.3/10.0
- 1% rule +4.4/10.0
- Schools +4.4/10.0
- Livability +3.9/5.0
- Rent growth +2.5/5.0
- Condition / age +2.5/5.0
- Appreciation +0.0/10.0
$179,900
🖨 Deal sheet 📄 Offer letter ✓ Due diligence
Listing remarks MLS
Home Ownership Awaits! 3 BR 1 BA manufactured home in the heart of Luray! Enjoy mountain views from this large , level, .4 acre in-town lot! This property has been well maintained and updated by current owner! Updates include: new flooring, interior paint, updates to kitchen and shiplap ceilings. Walk to shopping, restaurants, parks and schools! Location location location and this property has a tremendous location!
Key facts
- Level lot
- Walk to restaurants
- Updated kitchen
Tags
Neighborhood map
What this means for you Summary
Snapshot
- This is a 3-bed/1.5-bath single-family listed at $180k.
Deal economics
- At list price, monthly cash flow is $217 ($3k/yr) — positive.
- The deal already cash-flows at list — no discount required.
- To meet the 1% rule (rent ≥ 1% of price), the offer needs to be $168k (6.3% below list).
- Recommended offer: $168k (6.3% below list) — sets the bar for 1% rule.
- Cap rate 7.7% vs local median 3.2% in Luray — top-decile yield for the area; either an underpriced asset or a hidden risk that comps aren't pricing in. Stress-test before assuming the spread holds.
Location & tenants
- Location reads 77/100 on livability (#93 in VA, #3,012 nationally) — a middle-class / working-renter tenant base. Strengths: crime A+, cost of living A+, health & safety A+; Watch: employment C-, commute F.
- Page County Public School District (rural): math 42% / reading 62% proficiency, ranked #96 of 131 in VA (top 73%) — acceptable for families but not a draw, mixed tenant base, ~2y average lease.
- Market conditions: 112 active listings in the ZIP; 164 units permitted in Page County in 2024 (0 in 5+ unit buildings).
Forward outlook
- Local home prices are declining (-3.0%/yr); year-one equity from $1k of loan paydown is wiped out by about $5k of value loss. Plan a longer hold.
- Page County population projected at -19% by 2050 — secular population decline; favor cash flow + early exit over multi-decade hold.
Negotiation context
- It's been on market 60 days — a 3% lower offer ($175k) is reasonable based on typical stale-listing flexibility.
- 5 sale attempts since 4y ago with the ask held roughly flat each time — persistent listings suggest the price (not the market) is what's stuck; bring a comps-based counter.
- Current owner paid $140k; 28% above their basis — modest negotiation headroom, anchor on the comps not their cost.
Questions for the listing agent
- It's been on market 60 days. Have you received any prior offers? Is the seller open to a 6% concession, seller financing, or rate buy-down credit?
- Built in 1962 — when were the roof, HVAC, electrical panel, plumbing, and water heater last replaced?
- Is there a deadline driving the sale (1031 exchange, divorce, estate, relocation)? That informs how much negotiation room exists.
- Schools are B-rated — typically a magnet for longer-tenancy family renters. What's the average tenant stay here, and is there a school-zone premium baked into asking?
- What's the average days-on-market for RENTAL listings here right now (not sales)? A rising rental-DOM trend means longer vacancies and softer asking-rent achievability than the comps imply.
- What's the recent tenant-quality profile in this submarket — average credit score on applications, eviction rate, late-payment / NSF rate, and stable-employment percentage? A property-management company in the area should have these aggregated.
- How much new for-sale + rental construction is in the pipeline within 1–3 miles? Heavy new supply typically softens prices + rents 12–24 months out; constrained supply supports both.
Investment metrics
- 1% rule
- 0.94% ✗
- Cap rate
- 7.74%
- Cash-on-cash
- 5.18%
- DSCR
- 1.23
- GRM
- 8.9
CMA / ARV
- ARV (on-the-fly)
- $328,500
- Comps found
- 12
Show comp detail 12 sales within ~0.75 mi
| Address | Dist | Beds/Ba | Sqft | Sold | Price | $/sf | Match |
|---|---|---|---|---|---|---|---|
| 514 Sixth St | 0.17mi | 3/2.0 | 1,344 (-10%) | 13mo | $284,000 | $211 | 62 |
| 514 6th St | 0.17mi | 3/2.0 | 1,344 (-10%) | 13mo | $284,000 | $211 | 62 |
| 320 8th Ave | 0.19mi | 3/2.0 | 1,284 (-14%) | 5mo | $329,000 | $256 | 61 |
| 11 Bristol Ave | 0.42mi | 3/2.0 | 1,693 (+13%) | 2mo | $120,000 | $71 | 55 |
| 26 O'flinn St | 0.59mi | 3/2.0 | 1,347 (-10%) | 3mo | $295,000 | $219 | 51 |
| 174 Reservoir Ave | 0.70mi | 3/2.0 | 1,392 (-7%) | 8mo | $375,000 | $269 | 47 |
| 42 Oakcrest Dr | 0.44mi | 3/2.0 | 1,717 (+14%) | 9mo | $335,000 | $195 | 46 |
| 302 Woodland Ave | 0.70mi | 2/1.0 (-1) | 1,625 (+8%) | 1mo | $221,500 | $136 | 46 |
| 182 Reservoir Ave | 0.73mi | 3/2.0 | 1,344 (-10%) | 4mo | $340,000 | $253 | 43 |
| 6 Wilson Ave | 0.45mi | 2/2.5 (-1) | 1,336 (-11%) | 12mo | $345,000 | $258 | 41 |
| 184 Reservoir Ave | 0.74mi | 3/2.0 | 1,344 (-10%) | 10mo | $320,000 | $238 | 38 |
| 66 N Broad St | 0.75mi | 4/2.0 (+1) | 1,654 (+10%) | 9mo | $234,000 | $141 | 34 |
Match score weights: distance 35% · size 25% · config 20% · recency 20%. Top-matched comps best support the ARV.
Projected returns pro-forma
-3.0% appreciation · 3.0% rent growth · sell at horizon
- IRR
- -8.3%
- Equity multiple
- 0.70×
- Total profit
- $-15,354
- Equity at exit
- $26,824
- IRR
- 1.2%
- Equity multiple
- 1.08×
- Total profit
- $4,245
- Equity at exit
- $15,554
Cash invested: $50,372 (down + closing). Projections, not guarantees.
Landlord ↔ Tenant lean methodology
- Overall (STATE)
- 55 Moderately Landlord-Leaning
- State Virginia
- 55 Moderately Landlord-Leaning · D+2
- County
- — inherits STATE
- City
- — inherits STATE
ZIP-level market 22835
- Home prices YoY
- -3.7%
- Active inventory
- 112
- Price-to-rent
- 8.9×
Monthly cashflow live
- Estimated rent
- $1,685 medium interval (Pro) →
- Mortgage (P&I)
- −$943
- Tax from tax record
- −$95 /mo · $1,142/yr
- Insurance
- −$75
- HOA
- −$0
- Vacancy / Maint / Mgmt
- −$354
- Net cashflow
- $217
Break-even live
UW: 25.0% down · 7.5% · 30yr · 1.5% tax · 5.0% vac · 8.0% maint · 8.0% mgmt
Financing live
Cash to close
- Down payment
- $44,975
- Closing costs
- $5,397
- Reserves months
- —
- Total cash needed
- —
Loan-product check · same deal, 3 products live
Conventional
25% down · 7.5% · 30yr
- Down + closing
- —
- Monthly P&I
- —
- Monthly cashflow
- —
- DSCR
- —
- Eligible?
- —
Personal DTI + credit; lowest rate.
DSCR
20% down · 8.5% · 30yr
- Down + closing
- —
- Monthly P&I
- —
- Monthly cashflow
- —
- DSCR
- —
- Eligible?
- —
No personal income docs; deal must DSCR.
Hard money
10% down · 12.0% · 12mo
- Down + closing
- —
- Monthly P&I
- —
- Monthly cashflow
- —
- DSCR
- —
- Eligible?
- —
Short-term bridge; refi at stabilization.
Listing history 29 events
-
2026-06-19days on market $179,900 Active 60 DOM
-
2026-06-18days on market $179,900 Active 59 DOM
-
2026-06-17days on market $179,900 Active 58 DOM
-
2026-06-16days on market $179,900 Active 57 DOM
-
2026-06-15days on market $179,900 Active 56 DOM
-
2026-06-14days on market $179,900 Active 54 DOM
-
2026-06-13days on market $179,900 Active 53 DOM
-
2026-06-10days on market $179,900 Active 51 DOM
-
2026-06-09days on market $179,900 Active 50 DOM
-
2026-06-08days on market $179,900 Active 49 DOM
-
2026-06-07days on market $179,900 Active 48 DOM
-
2026-06-02days on market $179,900 Active 43 DOM
-
2026-06-01days on market $179,900 Active 42 DOM
-
2026-05-31days on market $179,900 Active 41 DOM
-
2026-05-30days on market $179,900 Active 40 DOM
-
2026-04-20$179,900 Active 419-char remark
Show marketing remark (419 chars)
Home Ownership Awaits! 3 BR 1 BA manufactured home in the heart of Luray! Enjoy mountain views from this large , level, .4 acre in-town lot! This property has been well maintained and updated by current owner! Updates include: new flooring, interior paint, updates to kitchen and shiplap ceilings. Walk to shopping, restaurants, parks and schools! Location location location and this property has a tremendous location!
-
2026-03-30historical
-
2025-11-03price $180,000
-
2025-11-03price $180,000
-
2025-08-21$199,900 Active
-
2025-08-21$199,900 Active
-
2023-01-23historical
-
2023-01-20soldstatus $140,000 Sold
-
2023-01-20soldstatus $140,000 Closed
-
2023-01-06status Pending
-
2023-01-06status Pending
-
2022-11-30$169,000 Active
-
2022-11-30$169,000 Active
-
2021-08-27soldstatus $81,900
ⓘ Source: listings_history table (triggers on properties + properties_extension) + one-shot
backfill from property_details.listing_events for pre-trigger history.
Tax reassessment forecast VA · Resets to sale price
- Current annual tax
- $1,142 · $95/mo
- Projected year-2 tax
- $1,475 · $123/mo
- Expected delta
- +$333/yr (+$28/mo · 29.2%)
ⓘ Screening estimate from a state-policy table — verify with the county assessor before closing.
Nearby sold comps map
Loading sold comps map…
Walkable amenities ~0.75 mi
Loading nearby amenities…
Taxation est. · year 1
- Rental income
- $20,218
- − Mortgage interest
- −$10,077
- − Property taxes
- −$1,142
- − Insurance
- −$900
- − Repairs & maintenance
- −$1,617
- − Management
- −$1,617
- − Depreciation
- −$5,233
- Taxable loss
- −$369
- Est. tax savings @ 24.0%
- +$89
- After-tax cash flow
- $2,698/yr
For passive investors: Depreciation is non-cash, so a rental often shows a tax loss while cash-flowing — sheltering income. Rental losses are passive: they offset passive income freely, and up to $25,000/yr can offset ordinary (W-2) income if you actively participate and your MAGI is under $100k (phasing out to $0 by $150k); unused losses carry forward. On sale, claimed depreciation is recaptured at up to 25%, and gains may owe capital-gains tax (a 1031 exchange can defer both). Figures are a year-1 estimate at your 24.0% rate — not tax advice; consult a CPA.
Schools (NCES district)
- District
- Page County Public School District
- NCES district ID
- 5102850
- Math proficiency
- 42% ▼ -35.00%
- Reading proficiency
- 62% ▼ -10.00%
- Median HH income
- $43,808
- Composite
- 43.77/100
- National rank
- #2943
- State rank
- #96 of 131 in VA
Livability — Luray
- Score
- 77/100
- State rank
- #93
- US rank
- #3012
Category grades
Schools grade is shown separately in the Schools card above.
Census & demographics
- Census place
- Luray, VA
- City population
- 11,358
- Population (ZIP)
- 11,358
Population outlook (Page County) Hauer SSP2
- Today (2025)
- 22,843 people
- By 2030
- 22,147 · -3.0%
- By 2040
- 20,427 · -10.6%
- By 2050
- 18,461 · -19.2%
- By 2075
- 14,363 · -37.1%
- By 2100
- 10,678 · -53.3%
Race, ethnicity, and origin ACS 2023
- Neighborhood character
- Predominantly White (92%)
- Race & ethnicity
- White 92% Black 4% Two or more races 3%
- Common ancestry
- Slovak 1% Lithuanian 1% Portuguese 1%
- Foreign-born
- 1%
- Languages at home
- 97% English-only · Arabic 1% Spanish 1%
Political lean MEDSL · Page
- 2024 margin
- Solid R (+54.1) · D 22.5% · R 76.6%
- 2008→2024 swing
- -36.7pp toward R · 2008: -17.4pp · 2024: -54.1pp
- All cycles
- 2024: R+54.1 2020: R+50.6 2016: R+49.8 2012: R+25.7 2008: R+17.4
Not yet ingested
- Civics
- —
Market trends
- HPI YoY
- ▼ -11.88%
- Current HPI
- 312.1156
- Rent YoY
- —
- Metro
- —
- State GDP YoY
- ▲ 2.40%
- F500 in state
- 50
Industry mix (Fortune 500 HQ in VA)
| Industry | F500 HQs | Revenue |
|---|---|---|
| Aerospace / Defense | 4 | $236B |
|
||
| Technology / Defense | 3 | $32B |
|
||
| Financial Services | 2 | $176B |
|
||
| Utilities | 2 | $27B |
|
||
| Insurance | 2 | $25B |
|
||
| Technology | 2 | $15B |
|
||
Price history
+119.7% since first listed14 events — show timeline
- 2026-04-20 Listed $179,900 BRIGHT MLS
- 2026-03-30 Listing Removed — BRIGHT MLS
- 2025-11-03 Price Changed $180,000 BRIGHT MLS
- 2025-11-03 Price Changed $180,000 HRAR
- 2025-08-21 Listed $199,900 BRIGHT MLS
- 2025-08-21 Listed $199,900 HRAR
- 2023-01-23 Listing Removed — BRIGHT MLS
- 2023-01-20 Sold (MLS) $140,000 BRIGHT MLS
- 2023-01-20 Sold (MLS) $140,000 HRAR
- 2023-01-06 Pending — BRIGHT MLS
- 2023-01-06 Pending — HRAR
- 2022-11-30 Listed $169,000 BRIGHT MLS
- 2022-11-30 Listed $169,000 HRAR
- 2021-08-27 Sold (Public Records) $81,900 Public Records
Property tax history
+17.6%/yrLatest (2025): $1,142 · +0.0% YoY. Source: county tax records.
Cash-flow waterfall
monthlySold comps — $/sqft
last 12 mo · ≤1 miLoading sold comps…