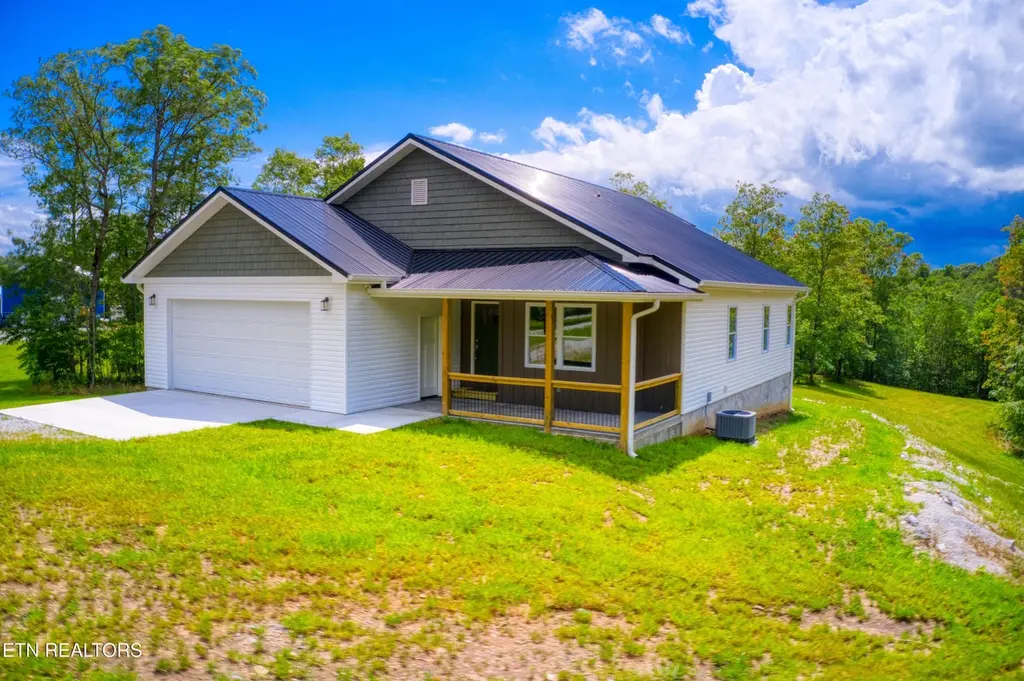
760 Rockview Rd · Allardt, TN
Flood risk 1/10 · Minimal
- FEMA flood zone
- X (unshaded)
- Chance of flooding over 30 yrs
- 0.0%
- Est. flood insurance / yr
- $507 – $1,088
Fire risk 5/10 · Moderate
- Est. fire insurance / yr
- $949 – $1,763
Heat risk 3/10 · Minor
- Hot days now (above 101°F)
- 7 days/yr
- Hot days in 30 yrs
- 20 days/yr
Wind risk 3/10 · Minor
- Chance of severe wind over 30 yrs
- 5.0%
Air-quality risk 2/10 · Minimal
- Unhealthy air days now
- 2 days/yr
- Unhealthy air days in 30 yrs
- 2 days/yr
Risk factors via First Street. Map © Google.
Why this score? — see what drove the D- grade
The composite is a weighted blend of 9 inputs, each scored 0–100. Each bar is that input's sub-score; the figure is the points it added to the 100-point composite (weight × sub-score).
- ARV discount +15.0/15.0
- Appreciation +10.0/10.0
- Livability +3.2/5.0
- Cash flow +2.6/30.0
- Rent growth +2.5/5.0
- Condition / age +2.5/5.0
- Schools +2.1/10.0
- 1% rule +0.0/10.0
- DSCR +0.0/10.0
$498,000
🖨 Deal sheet (PDF) 📄 Offer letter ✓ Due diligence
Listing remarks MLS
Brand NEW BUILD / NEVER OCCUPIED. Designer touches all thru-out the home. Located in the Equestrian community of RIDGE TOP ACRES which features 8 TO 10 miles of community trails & a trail that will take you DIRECTLY into the BIG SOUTH FORK NATIONAL PARK with 225 miles of dedicated horse trails. 9 foot ceilings. Excellent use of small eyeball inset lighting with adjustable COLOR temperature control. Kitchen features Custom Cabinets with soft close drawers, Granite counters, Center ISLAND with electric & CABINETS and a STAINLESS STEEL APRON DEEP SINK also a gas stove all appliances are purchased in September 2025. HOUSE WIRED for CAT 6. Open Concept / Split Living. EXTRA WIDE HALLWAYS. Water Proof LVT Flooring thru-out. Separate laundry room with cabinets and a built in pantry and a pocket door. Your Cinder Block foundation IS concrete filled with an exterior skim coat. Crawl Space FULLY ENCAPSULATED. Propane tank is leased. OVERSIZED encapsulated unfinished garage with a side door & TANKLESS WATER HEATER. The back decking with railing is ARCHITECTURALLY Designed. 2 beautiful mature pastures in place. Master Bathroom has a custom tiled shower, a separate bath tub, twin sink cabinet with granite counter top AND auto lit base cabinet lighting. A LARGE Master walk in closet. Stamped concrete on the covered front porch. EXCELLENT AIR B&B OPPORTUNITY. 4 STALL BARN included.
Key facts
- Custom cabinets
- Gas stove
- Granite counters
Tags
Neighborhood map
What this means for you Summary
Snapshot
- This is a 3-bed/2.0-bath single-family listed at $498k.
Deal economics
- At list price, monthly cash flow is $-2k ($-20k/yr) — negative.
- To cash-flow at today's rent, offer at most $196k (60.6% below list).
- To meet the 1% rule (rent ≥ 1% of price), the offer needs to be $156k (68.7% below list).
- Recommended offer: $156k (68.7% below list) — sets the bar for 1% rule.
Location & tenants
- Location reads 63/100 on livability (#194 in TN) — a middle-class / working-renter tenant base. Strengths: cost of living A+, housing A+; Watch: crime F, amenities F, commute F.
- Fentress County (rural): math 24% / reading 27% proficiency, ranked #91 of 139 in TN (top 66%) — low school quality limits family demand, transient renter base, plan for 1-2y turnover; 65% free/reduced lunch — lower-income household profile, screen leases tightly.
- Zoned schools: South Fentress Elementary School (math 19% / reading 25%, grade F, #601 of 952 statewide, top 66%, 632 students, 0% FRL); Clarkrange High School (math 17% / reading 44%, grade F, #73 of 332 statewide, top 22%, 260 students, 0% FRL) — zoned schools average 0% FRL vs 65% district-wide (65 pts lower); this property's tenant base skews higher-income than the district average.
- Market conditions: 325 active listings in the ZIP.
Forward outlook
- In year one you build about $53k of equity ($3k loan paydown + $50k appreciation (10.0% local appreciation)).
- Fentress County population projected at -19% by 2050 — secular population decline; favor cash flow + early exit over multi-decade hold.
- By year 2, paydown + projected appreciation supports a ~$86k cash-out refi (75% LTV) — recoverable capital for the next deal without selling this one.
Negotiation context
- It's been on market 111 days — a 9% lower offer ($453k) is reasonable based on typical stale-listing flexibility.
- 3 sale attempts with the ask held roughly flat each time — persistent listings suggest the price (not the market) is what's stuck; bring a comps-based counter.
- Current owner paid $90k; list at $498k implies a 453% gain — meaningful room to come down on a strong offer.
Risks & watch-outs
- Climate carrying-cost: moderate wildfire risk — expect insurance premiums to compound above CPI over the hold.
Questions for the listing agent
- What do current leases actually rent for vs. the listed asking? Can we see a recent rent roll and the last 12 months of T-12 income?
- It's been on market 111 days. Have you received any prior offers? Is the seller open to a 69% concession, seller financing, or rate buy-down credit?
- Why hasn't it sold? Are there any deal-killer items the seller is aware of (foundation, flood, title, zoning, code violations)?
- Is there a deadline driving the sale (1031 exchange, divorce, estate, relocation)? That informs how much negotiation room exists.
- Schools are D-rated, which usually means shorter tenancies and higher turnover. Who's the typical renter profile here, and what's been the actual vacancy rate?
- Crime grade is F in this area — have there been break-ins, vandalism, or insurance claims at this property in the last 3 years? What carrier currently insures it and at what premium?
- The area grade is low — what's the realistic commute time and amenity access for the typical tenant pool here? Any planned neighborhood developments (good or bad) we should know about?
- What's the average days-on-market for RENTAL listings here right now (not sales)? A rising rental-DOM trend means longer vacancies and softer asking-rent achievability than the comps imply.
- What's the recent tenant-quality profile in this submarket — average credit score on applications, eviction rate, late-payment / NSF rate, and stable-employment percentage? A property-management company in the area should have these aggregated.
- How much new for-sale + rental construction is in the pipeline within 1–3 miles? Heavy new supply typically softens prices + rents 12–24 months out; constrained supply supports both.
Investment metrics
- 1% rule
- 0.31% ✗
- Cap rate
- 2.18%
- Cash-on-cash
- -14.69%
- DSCR
- 0.35
- GRM
- 26.6
CMA / ARV
- ARV (median comp)
- $628,059
- List price
- $498,000
- Delta
- -20.71%
- Verdict
- UNDERPRICED
- Comps
- 4 within 1.0 mi
Projected returns pro-forma
10.0% appreciation · 3.0% rent growth · sell at horizon
- IRR
- 14.0%
- Equity multiple
- 2.16×
- Total profit
- $162,190
- Equity at exit
- $448,638
- IRR
- 14.0%
- Equity multiple
- 5.03×
- Total profit
- $562,573
- Equity at exit
- $967,504
Cash invested: $139,440 (down + closing). Projections, not guarantees.
Landlord ↔ Tenant lean methodology
- Overall (STATE)
- 87 Strongly Landlord-Friendly
- State Tennessee
- 87 Strongly Landlord-Friendly · R+13
- County
- — inherits STATE
- City
- — inherits STATE
ZIP-level market 38556
- Home prices YoY
- 13.5%
- Active inventory
- 325
- Price-to-rent
- 26.6×
Monthly cashflow live
- Estimated rent
- $1,558 medium interval (Pro) →
- Mortgage (P&I)
- −$2,612
- Tax from tax record
- −$119 /mo · $1,428/yr
- Insurance
- −$208
- HOA
- −$0
- Vacancy / Maint / Mgmt
- −$327
- Net cashflow
- $-1,707
Break-even live
Sensitivity live
| Price | -10% $-1,426 | -5% $-1,566 | +0% $-1,707 | +5% $-1,848 | +10% $-1,989 |
|---|---|---|---|---|---|
| Rent | -10% $-1,831 | -5% $-1,769 | +0% $-1,707 | +5% $-1,646 | +10% $-1,584 |
| Rate | -1.0pp $-1,457 | -0.5pp $-1,581 | base $-1,707 | +0.5pp $-1,836 | +1.0pp $-1,968 |
UW: 25.0% down · 7.5% · 30yr · 1.5% tax · 5.0% vac · 8.0% maint · 8.0% mgmt
Financing live
Cash to close
- Down payment
- $124,500
- Closing costs
- $14,940
- Reserves months
- —
- Total cash needed
- —
Loan-product check · same deal, 3 products live
Conventional
25% down · 7.5% · 30yr
- Down + closing
- —
- Monthly P&I
- —
- Monthly cashflow
- —
- DSCR
- —
- Eligible?
- —
Personal DTI + credit; lowest rate.
DSCR
20% down · 8.5% · 30yr
- Down + closing
- —
- Monthly P&I
- —
- Monthly cashflow
- —
- DSCR
- —
- Eligible?
- —
No personal income docs; deal must DSCR.
Hard money
10% down · 12.0% · 12mo
- Down + closing
- —
- Monthly P&I
- —
- Monthly cashflow
- —
- DSCR
- —
- Eligible?
- —
Short-term bridge; refi at stabilization.
Listing history 24 events
-
2026-06-21days on market $498,000 Active 111 DOM
-
2026-06-21days on market $498,000 Active 110 DOM
-
2026-06-18days on market $498,000 Active 108 DOM
-
2026-06-17days on market $498,000 Active 107 DOM
-
2026-06-16days on market $498,000 Active 106 DOM
-
2026-06-15days on market $498,000 Active 105 DOM
-
2026-06-13days on market $498,000 Active 103 DOM
-
2026-06-12days on market $498,000 Active 102 DOM
-
2026-06-09days on market $498,000 Active 99 DOM
-
2026-06-08days on market $498,000 Active 98 DOM
-
2026-06-08days on market $498,000 Active 97 DOM
-
2026-06-07days on market $498,000 Active 96 DOM
-
2026-06-03days on market $498,000 Active 93 DOM
-
2026-06-02days on market $498,000 Active 92 DOM
-
2026-06-01days on market $498,000 Active 91 DOM
-
2026-05-31days on market $498,000 Active 90 DOM
-
2026-03-02$498,000 Active 1406-char remark
Show marketing remark (1406 chars)
Brand NEW BUILD / NEVER OCCUPIED. Designer touches all thru-out the home. Located in the Equestrian community of RIDGE TOP ACRES which features 8 TO 10 miles of community trails & a trail that will take you DIRECTLY into the BIG SOUTH FORK NATIONAL PARK with 225 miles of dedicated horse trails. 9 foot ceilings. Excellent use of small eyeball inset lighting with adjustable COLOR temperature control. Kitchen features Custom Cabinets with soft close drawers, Granite counters, Center ISLAND with electric & CABINETS and a STAINLESS STEEL APRON DEEP SINK also a gas stove all appliances are purchased in September 2025. HOUSE WIRED for CAT 6. Open Concept / Split Living. EXTRA WIDE HALLWAYS. Water Proof LVT Flooring thru-out. Separate laundry room with cabinets and a built in pantry and a pocket door. Your Cinder Block foundation IS concrete filled with an exterior skim coat. Crawl Space FULLY ENCAPSULATED. Propane tank is leased. OVERSIZED encapsulated unfinished garage with a side door & TANKLESS WATER HEATER. The back decking with railing is ARCHITECTURALLY Designed. 2 beautiful mature pastures in place. Master Bathroom has a custom tiled shower, a separate bath tub, twin sink cabinet with granite counter top AND auto lit base cabinet lighting. A LARGE Master walk in closet. Stamped concrete on the covered front porch. EXCELLENT AIR B&B OPPORTUNITY. 4 STALL BARN included.
-
2026-01-31historical
-
2025-09-05price $549,000
-
2025-06-16$560,000 Active
-
2025-06-12historical
-
2025-06-01price $549,900
-
2025-03-16$575,000 Active
-
2023-07-24soldstatus $90,000
ⓘ Source: listings_history table (triggers on properties + properties_extension) + one-shot
backfill from property_details.listing_events for pre-trigger history.
Tax reassessment forecast TN · Resets to sale price
- Current annual tax
- $1,428 · $119/mo
- Projected year-2 tax
- $3,536 · $295/mo
- Expected delta
- +$2,108/yr (+$176/mo · 147.6%)
ⓘ Screening estimate from a state-policy table — verify with the county assessor before closing.
Climate risk First Street
- Flood 1/10 Low FEMA zone X (unshaded) · 0% chance over 30 yrs
- Wildfire 5/10 Major
- Heat 3/10 Moderate 7 d/yr ≥101°F today · 20 d/yr by 30 yrs out
- Wind 3/10 Moderate 5% chance of damaging wind over 30 yrs
- Air quality 2/10 Low 2 unhealthy d/yr today · 2 by 30 yrs out
Nearby sold comps map
Loading sold comps map…
Walkable amenities ~0.75 mi
Loading nearby amenities…
Taxation est. · year 1
- Rental income
- $18,693
- − Mortgage interest
- −$27,896
- − Property taxes
- −$1,428
- − Insurance
- −$2,490
- − Repairs & maintenance
- −$1,495
- − Management
- −$1,495
- − Depreciation
- −$14,487
- Taxable loss
- −$30,599
- Est. tax savings @ 24.0%
- +$7,344
- After-tax cash flow
- $-13,146/yr
For passive investors: Depreciation is non-cash, so a rental often shows a tax loss while cash-flowing — sheltering income. Rental losses are passive: they offset passive income freely, and up to $25,000/yr can offset ordinary (W-2) income if you actively participate and your MAGI is under $100k (phasing out to $0 by $150k); unused losses carry forward. On sale, claimed depreciation is recaptured at up to 25%, and gains may owe capital-gains tax (a 1031 exchange can defer both). Figures are a year-1 estimate at your 24.0% rate — not tax advice; consult a CPA.
Schools (NCES district)
- District
- Fentress County
- NCES district ID
- 4701230
- Math proficiency
- 24% ▼ -13.00%
- Reading proficiency
- 27% ▼ -8.00%
- Median HH income
- $30,419
- Composite
- 20.6/100
- National rank
- #8552
- State rank
- #91 of 139 in TN
Livability — Allardt
- Score
- 63/100
- State rank
- #194
- US rank
- #15311
Category grades
Schools grade is shown separately in the Schools card above.
Census & demographics
- Population (ZIP)
- 12,531
Population outlook (Fentress County) Hauer SSP2
- Today (2025)
- 17,295 people
- By 2030
- 16,749 · -3.2%
- By 2040
- 15,443 · -10.7%
- By 2050
- 14,077 · -18.6%
- By 2075
- 11,482 · -33.6%
- By 2100
- 9,658 · -44.2%
Race, ethnicity, and origin ACS 2023
- Neighborhood character
- Predominantly White (96%)
- Race & ethnicity
- White 96% Two or more races 3% Hispanic / Latino 1%
- Common ancestry
- Serbian 3% Lithuanian 2% Iranian 1%
- Foreign-born
- 1% · Canada
- Languages at home
- 99% English-only · Spanish 1%
Political lean MEDSL · Fentress
- 2024 margin
- Solid R (+75.8) · D 11.8% · R 87.6%
- 2008→2024 swing
- -31.9pp toward R · 2008: -43.9pp · 2024: -75.8pp
- All cycles
- 2024: R+75.8 2020: R+71.3 2016: R+67.5 2012: R+53.4 2008: R+43.9
Not yet ingested
- Civics
- —
Market trends
- HPI YoY
- ▲ 44.31%
- Current HPI
- 372.5676
- Rent YoY
- —
- Metro
- —
- State GDP YoY
- ▲ 2.78%
- F500 in state
- 22
Industry mix (Fortune 500 HQ in TN)
| Industry | F500 HQs | Revenue |
|---|---|---|
| Healthcare | 3 | $91B |
|
||
| Retail | 3 | $72B |
|
||
| Transportation / Logistics | 1 | $88B |
|
||
| Paper / Packaging | 1 | $19B |
|
||
| Insurance | 1 | $13B |
|
||
| Energy | 1 | $12B |
|
||
Price history
+453.3% since first listed8 events — show timeline
- 2026-03-02 Listed $498,000 Knoxville MLS
- 2026-01-31 Listing Removed — Knoxville MLS
- 2025-09-05 Price Changed $549,000 Knoxville MLS
- 2025-06-16 Listed $560,000 Knoxville MLS
- 2025-06-12 Listing Removed — Knoxville MLS
- 2025-06-01 Price Changed $549,900 Knoxville MLS
- 2025-03-16 Listed $575,000 Knoxville MLS
- 2023-07-24 Sold (Public Records) $90,000 Public Records
Property tax history
+16.8%/yrLatest (2025): $1,428 · +711.4% YoY. Source: county tax records.
Cash-flow waterfall
monthlySold comps — $/sqft
last 12 mo · ≤1 miLoading sold comps…