 🏗️ New Construction
GREGORY Plan · Mundelein, IL
Flood risk 1/10 · Minimal
- FEMA flood zone
- X (unshaded)
- Chance of flooding over 30 yrs
- 0.0%
- Est. flood insurance / yr
- $507 – $1,088
Fire risk 1/10 · Minimal
- Est. fire insurance / yr
- $804 – $1,492
Heat risk 2/10 · Minimal
- Hot days now (above 100°F)
- 7 days/yr
- Hot days in 30 yrs
- 14 days/yr
Wind risk 2/10 · Minimal
- Chance of severe wind over 30 yrs
- —
Air-quality risk 3/10 · Minor
- Unhealthy air days now
- 3 days/yr
- Unhealthy air days in 30 yrs
- 4 days/yr
Risk factors via First Street. Map © Google.
Why this score? — see what drove the D- grade
The composite is a weighted blend of 9 inputs, each scored 0–100. Each bar is that input's sub-score; the figure is the points it added to the 100-point composite (weight × sub-score).
- Cash flow +8.1/30.0
- ARV discount +7.5/15.0
- Schools +7.1/10.0
- Livability +4.4/5.0
- Condition / age +3.8/5.0
- Rent growth +3.2/5.0
- 1% rule +2.5/10.0
- DSCR +2.2/10.0
- Appreciation +0.0/10.0
$411,990
🖨 Deal sheet (PDF) 📄 Offer letter ✓ Due diligence
Listing remarks
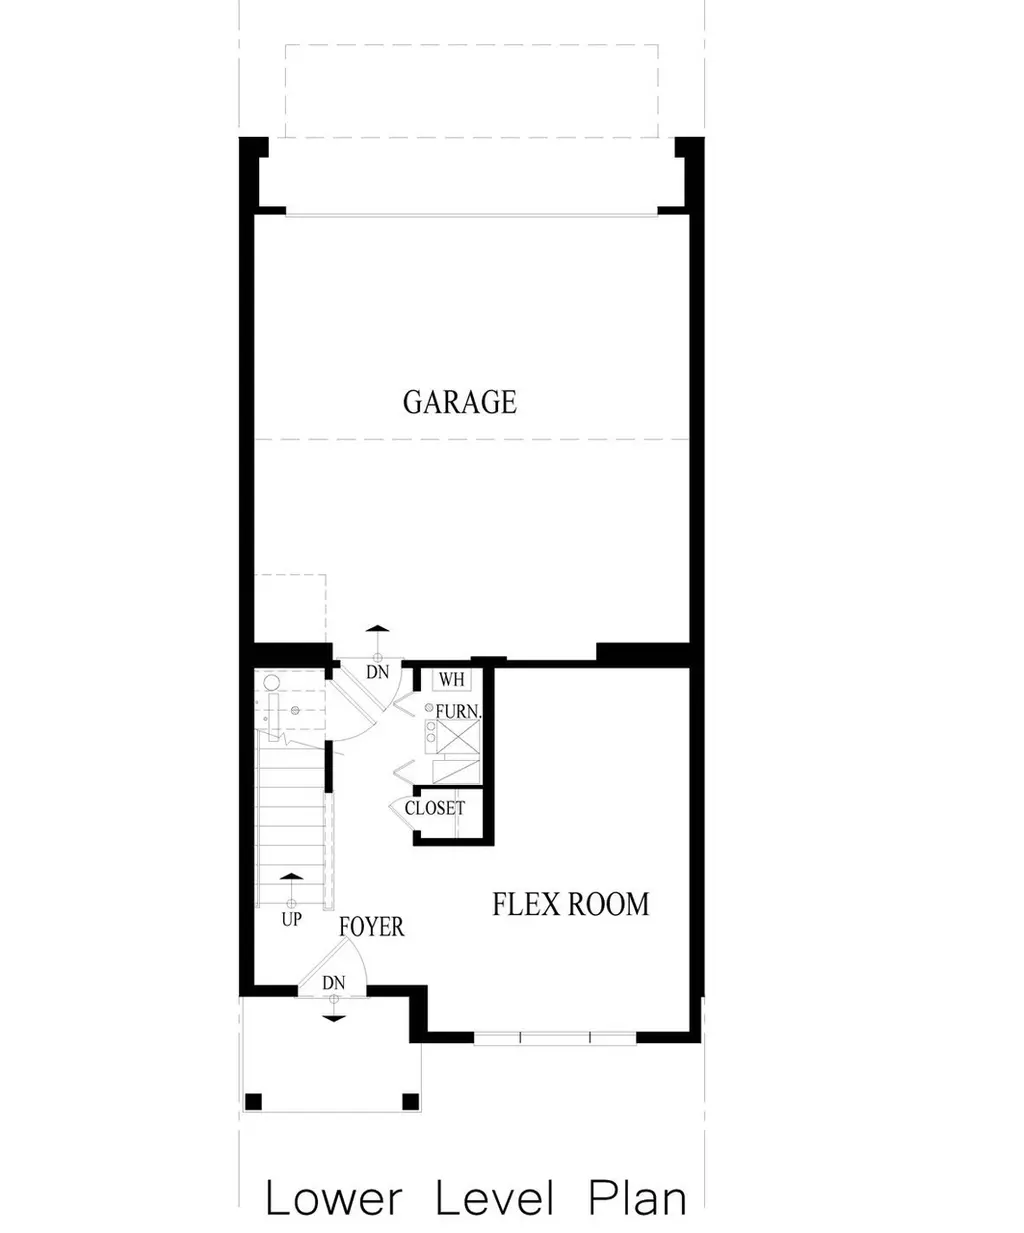
Introducing the Gregory townhome plan at The Townes of Oak Creek. This captivating open floor plan includes 3 bedrooms, 2.5 baths, and a finished bonus room off of the garage area! This modern floor plan is flooded with natural light from the large windows, and shows off a spacious, open concept great room which leads out to an elongated deck. Designed with plenty of space to entertain family and friends, the chef's kitchen includes a large island with seating space, designer cabinetry, quartz countertops, and stainless steel appliances. The kitchen overlooks both the front dining room and back great room area. Retreat upstairs to the primary bedroom which includes a private en suite bathro
Key facts
- Large windows
- Spacious great room
- Finished bonus room
Tags
Property features AI
Finance
- Financial info: List price $411,990
Exterior
- Parking: 2 garage spaces (2 total parking spaces)
- Home design: GREGORY plan (new construction plan); Address: Mundelein, IL
Interior
- Bedrooms: 3 bedrooms
- Bathrooms: 2 full baths and 1 half bath (2.5 total)
- Interior features: Living area approximately 1,798
Neighborhood map
What this means for you Summary
Snapshot
- This is a 3-bed/2.5-bath townhouse listed at $412k. Condition is rated good.
Deal economics
- At list price, monthly cash flow is $-426 ($-5k/yr) — negative.
- To cash-flow at today's rent, offer at most $384k (6.7% below list).
- To meet the 1% rule (rent ≥ 1% of price), the offer needs to be $336k (18.4% below list).
- Recommended offer: $336k (18.4% below list) — sets the bar for 1% rule.
- Cap rate 5.1% vs local median 3.1% in Mundelein — top-decile yield for the area; either an underpriced asset or a hidden risk that comps aren't pricing in. Stress-test before assuming the spread holds.
Location & tenants
- Location reads 87/100 on livability (#12 in IL, #274 nationally) — a professional / high-income tenant draw. Strengths: crime A+, commute A+, employment A+; Watch: amenities F.
- Adlai E Stevenson Hsd 125 (suburban): math 72% / reading 73% proficiency, ranked #3 of 620 in IL (top 0%) — strong family-tenant draw, lease renewals of 3-5y typical.
- Zoned schools: Diamond Lake School (321 students, 0% FRL); West Oak Middle School (math 17% / reading 17%, grade F, #460 of 665 statewide, top 72%, 302 students, 0% FRL); Adlai E Stevenson High School (math 72% / reading 73%, grade B+, #7 of 693 statewide, top 1%, 4,489 students, 0% FRL).
- Zoned-school proficiency averages 45% at this address vs 72% district-wide (-28 pts) — the specific schools serving this property underperform the Adlai E Stevenson Hsd 125 average; the district grade overstates school quality for this exact location.
- Market conditions: Rents rising (+2.7%/yr); 33 active listings in the ZIP; 14 comparable units currently listed for rent nearby; rentals at typical pace (median 24d on market — plan ~3-4 weeks tenant-placement turnaround); high-income renter base; 948 units permitted in Lake County in 2024 (424 in 5+ unit buildings).
- This rent runs 37% of the median local income ($110k/yr) — at the standard rent-burdened threshold; future hikes will face affordability resistance.
Forward outlook
- Local home prices are declining (-3.0%/yr); year-one equity from $3k of loan paydown is wiped out by about $13k of value loss. Plan a longer hold.
- Lake County population projected to shrink 8% by 2050 — rents likely to lag national; underwrite the cash flow, not the appreciation.
Negotiation context
- It's been on market 17 days — a 2% lower offer ($406k) is reasonable based on typical stale-listing flexibility.
Questions for the listing agent
- What do current leases actually rent for vs. the listed asking? Can we see a recent rent roll and the last 12 months of T-12 income?
- Is there a deadline driving the sale (1031 exchange, divorce, estate, relocation)? That informs how much negotiation room exists.
- The area grade is low — what's the realistic commute time and amenity access for the typical tenant pool here? Any planned neighborhood developments (good or bad) we should know about?
- What's the average days-on-market for RENTAL listings here right now (not sales)? A rising rental-DOM trend means longer vacancies and softer asking-rent achievability than the comps imply.
- What's the recent tenant-quality profile in this submarket — average credit score on applications, eviction rate, late-payment / NSF rate, and stable-employment percentage? A property-management company in the area should have these aggregated.
- How much new for-sale + rental construction is in the pipeline within 1–3 miles? Heavy new supply typically softens prices + rents 12–24 months out; constrained supply supports both.
Investment metrics
- 1% rule
- 0.75% ✗
- Cap rate
- 5.15%
- Cash-on-cash
- -4.10%
- DSCR
- 0.82
- GRM
- 11.1
CMA / ARV
- ARV (on-the-fly)
- $445,904
- Comps found
- 12
Show comp detail 12 sales within ~0.75 mi
| Address | Dist | Beds/Ba | Sqft | Sold | Price | $/sf | Match |
|---|---|---|---|---|---|---|---|
| 2011 Sequoia Ave | 0.05mi | 3/2.5 | 1,773 (-1%) | 0mo | $450,000 | $254 | 95 |
| 549 Yosemite Way | 0.12mi | 3/2.5 | 1,798 (0%) | 1mo | $448,990 | $250 | 93 |
| 551 Yosemite Way | 0.14mi | 3/2.5 | 1,798 (0%) | 2mo | $459,990 | $256 | 92 |
| 559 Yosemite Way | 0.15mi | 3/2.5 | 1,798 (0%) | 2mo | $450,990 | $251 | 91 |
| 2170 Glacier St | 0.14mi | 3/2.5 | 1,752 (-3%) | 2mo | $438,990 | $251 | 88 |
| 1452 Lakeridge Ct | 0.46mi | 3/2.5 | 1,756 (-2%) | 1mo | $355,000 | $202 | 74 |
| 545 Yosemite Way | 0.15mi | 2/2.5 (-1) | 1,630 (-9%) | 1mo | $404,990 | $248 | 72 |
| 555 Yosemite Way | 0.15mi | 2/2.5 (-1) | 1,630 (-9%) | 1mo | $398,490 | $244 | 72 |
| 565 Yosemite Way | 0.15mi | 2/2.5 (-1) | 1,630 (-9%) | 2mo | $398,990 | $245 | 70 |
| 575 Yosemite Way | 0.16mi | 2/2.5 (-1) | 1,630 (-9%) | 3mo | $398,990 | $245 | 70 |
| 567 Yosemite Way | 0.16mi | 2/2.5 (-1) | 1,630 (-9%) | 3mo | $398,990 | $245 | 70 |
| 1367 Orleans Dr | 0.68mi | 3/2.5 | 1,640 (-9%) | 1mo | $355,000 | $216 | 53 |
Match score weights: distance 35% · size 25% · config 20% · recency 20%. Top-matched comps best support the ARV.
Projected returns pro-forma
-3.0% appreciation · 2.67% rent growth · sell at horizon
- IRR
- -23.6%
- Equity multiple
- 0.20×
- Total profit
- $-100,454
- Equity at exit
- $66,486
- IRR
- -19.3%
- Equity multiple
- -0.02×
- Total profit
- $-126,746
- Equity at exit
- $38,554
Cash invested: $124,853 (down + closing). Projections, not guarantees.
Landlord ↔ Tenant lean methodology
- Overall (STATE)
- 43 Moderately Tenant-Leaning
- State Illinois
- 43 Moderately Tenant-Leaning · D+7
- County
- — inherits STATE
- City
- — inherits STATE
ZIP-level market 60060
- Rents YoY
- 2.7%
- Active inventory
- 33
- Price-to-rent
- 10.2×
Monthly cashflow live
- Estimated rent
- $3,361 high interval (Pro) →
- Mortgage (P&I)
- −$2,338
- Tax est. 1.5%
- −$557 /mo · $6,689/yr
- Insurance
- −$186
- HOA
- −$0
- Vacancy / Maint / Mgmt
- −$706
- Net cashflow
- $-426
Break-even live
Sensitivity live
| Price | -10% $-118 | -5% $-272 | +0% $-426 | +5% $-580 | +10% $-734 |
|---|---|---|---|---|---|
| Rent | -10% $-692 | -5% $-559 | +0% $-426 | +5% $-293 | +10% $-161 |
| Rate | -1.0pp $-202 | -0.5pp $-313 | base $-426 | +0.5pp $-542 | +1.0pp $-659 |
UW: 25.0% down · 7.5% · 30yr · 1.5% tax · 5.0% vac · 8.0% maint · 8.0% mgmt
Financing live
Cash to close
- Down payment
- $111,476
- Closing costs
- $13,377
- Reserves months
- —
- Total cash needed
- —
Loan-product check · same deal, 3 products live
Conventional
25% down · 7.5% · 30yr
- Down + closing
- —
- Monthly P&I
- —
- Monthly cashflow
- —
- DSCR
- —
- Eligible?
- —
Personal DTI + credit; lowest rate.
DSCR
20% down · 8.5% · 30yr
- Down + closing
- —
- Monthly P&I
- —
- Monthly cashflow
- —
- DSCR
- —
- Eligible?
- —
No personal income docs; deal must DSCR.
Hard money
10% down · 12.0% · 12mo
- Down + closing
- —
- Monthly P&I
- —
- Monthly cashflow
- —
- DSCR
- —
- Eligible?
- —
Short-term bridge; refi at stabilization.
Rent comps 14 comps
| Address | Beds | Baths | Sqft | Rent | $/sqft | DOM | Units | Dist |
|---|---|---|---|---|---|---|---|---|
| 2141 Yellowstone Blvd Mundelein, IL | 3.0 | 2.5 | 1798 | $3,500 | $1.95 | 26d | 1 | 0.06mi |
| 2227 Glacier St Mundelein, IL | 3.0 | 2.5 | 1800 | $3,500 | $1.94 | 26d | 1 | 0.07mi |
| 2267 Glacier St Mundelein, IL | 3.0 | 2.5 | 1752 | $3,800 | $2.17 | 2d | 1 | 0.11mi |
| 545 Yosemite Way Mundelein, IL | 2.0 | 2.5 | 1630 | $3,150 | $1.93 | 7d | 1 | 0.12mi |
| 384 W Pointe Dr Vernon Hills, IL | 3.0 | 2.5 | 1790 | $3,500 | $1.96 | 0d | 1 | 0.45mi |
| 409 Alpine Springs Dr Vernon Hills, IL | 3.0 | 2.5 | 2352 | $3,600 | $1.53 | 14d | 1 | 0.81mi |
| 717 Keystone Ln Vernon Hills, IL | 3.0 | 2.5 | 2352 | $3,399 | $1.45 | 26d | 1 | 0.89mi |
| 263 Aspen Pointe Rd Vernon Hills, IL | 3.0 | 2.5 | 2087 | $3,300 | $1.58 | 26d | 1 | 0.93mi |
| 136 Brookwood Ct Vernon Hills, IL | 2.0 | 1.5 | 1248 | $2,400 | $1.92 | 3d | 1 | 1.00mi |
| 136 Brookwood Ct Vernon Hills, IL | 2.0 | 1.5 | 1248 | $2,300 | $1.84 | 0d | 1 | 1.00mi |
| 410 Ashwood Ct Unit 410 Vernon Hills, IL | 2.0 | 1.5 | 1248 | $2,300 | $1.84 | 23d | 1 | 1.16mi |
| 36 Constitution Ct Vernon Hills, IL | 3.0 | 2.5 | 1525 | $3,000 | $1.97 | 26d | 1 | 1.29mi |
| 10 Mayflower Rd Vernon Hills, IL | 3.0 | 2.5 | 2000 | $3,800 | $1.90 | 0d | 1 | 1.43mi |
| 26821 N Oakdale Ln Mundelein, IL | 3.0 | 2.0 | 1710 | $3,800 | $2.22 | 26d | 1 | 1.47mi |
Listing history 12 events
-
2026-06-21days on market $411,990 Active 17 DOM
-
2026-06-18days on market $411,990 Active 14 DOM
-
2026-06-17days on market $411,990 Active 13 DOM
-
2026-06-16days on market $411,990 Active 12 DOM
-
2026-06-15days on market $411,990 Active 11 DOM
-
2026-06-13days on market $411,990 Active 9 DOM
-
2026-06-13days on market $411,990 Active 8 DOM
-
2026-06-09days on market $411,990 Active 5 DOM
-
2026-06-08days on market $411,990 Active 4 DOM
-
2026-06-07days on market $411,990 Active 3 DOM
-
2026-06-04remarks 699-char remark
-
2026-06-04$411,990 Active 1 DOM
ⓘ Source: listings_history table (triggers on properties + properties_extension) + one-shot
backfill from property_details.listing_events for pre-trigger history.
Climate risk First Street
- Flood 1/10 Low FEMA zone X (unshaded) · 0% chance over 30 yrs
- Wildfire 1/10 Low
- Heat 2/10 Low 7 d/yr ≥100°F today · 14 d/yr by 30 yrs out
- Wind 2/10 Low
- Air quality 3/10 Moderate 3 unhealthy d/yr today · 4 by 30 yrs out
Nearby sold comps map
Loading sold comps map…
Walkable amenities ~0.75 mi
Loading nearby amenities…
Taxation est. · year 1
- Rental income
- $40,336
- − Mortgage interest
- −$24,978
- − Property taxes
- −$6,689
- − Insurance
- −$2,230
- − Repairs & maintenance
- −$3,227
- − Management
- −$3,227
- − Depreciation
- −$12,972
- Taxable loss
- −$12,985
- Est. tax savings @ 24.0%
- +$3,116
- After-tax cash flow
- $-1,997/yr
For passive investors: Depreciation is non-cash, so a rental often shows a tax loss while cash-flowing — sheltering income. Rental losses are passive: they offset passive income freely, and up to $25,000/yr can offset ordinary (W-2) income if you actively participate and your MAGI is under $100k (phasing out to $0 by $150k); unused losses carry forward. On sale, claimed depreciation is recaptured at up to 25%, and gains may owe capital-gains tax (a 1031 exchange can defer both). Figures are a year-1 estimate at your 24.0% rate — not tax advice; consult a CPA.
Condition & rehab AI · 3 photos
This Gregory townhome presents as move-in ready with a good condition score and a modern floor plan. It offers a spacious layout with a chef's kitchen and 2.5 bathrooms. The property has a good curb appeal and minimal maintenance needs.
Value-add opportunities
- Both Painting exterior and interior walls — Fresh paint enhances curb appeal and interior aesthetics.
- Both Landscaping improvements — Enhances curb appeal and adds value to the property.
- Resale Kitchen backsplash — A backsplash can add visual interest and functionality to the kitchen.
Renovation cost estimate screening
Value-add ROI direction
- Both Painting exterior and interior walls — Fresh paint enhances curb appeal and interior aesthetics. ↑
- Both Landscaping improvements — Enhances curb appeal and adds value to the property. ↑
- Resale Kitchen backsplash — A backsplash can add visual interest and functionality to the kitchen. ↑
ⓘ Cost ranges are severity-bucket heuristics (US national rule-of-thumb). Get contractor quotes + a written scope before underwriting a rehab budget.
Schools (NCES district)
- District
- Adlai E Stevenson Hsd 125
- NCES district ID
- 1732580
- Math proficiency
- 72% ▼ -4.00%
- Reading proficiency
- 73% ▼ -2.00%
- Median HH income
- $146,434
- Composite
- 70.66/100
- National rank
- #253
- State rank
- #3 of 620 in IL
Livability — Mundelein
- Score
- 87/100
- State rank
- #12
- US rank
- #274
Category grades
Schools grade is shown separately in the Schools card above.
Census & demographics
- Census place
- Mundelein, IL
- County
- Lake County · 591,991 people
- City population
- 37,344
- Metro
- Chicago-Naperville-Elgin, IL-IN-WI
- Population (ZIP)
- 37,344
- Household income
- $110,335
- Rent vs Own
- Severe rent burden
- 750.0
Population outlook (Lake County) Hauer SSP2
- Today (2025)
- 700,217 people
- By 2030
- 693,290 · -1.0%
- By 2040
- 673,588 · -3.8%
- By 2050
- 643,556 · -8.1%
- By 2075
- 562,792 · -19.6%
- By 2100
- 457,715 · -34.6%
Race, ethnicity, and origin ACS 2023
- Neighborhood character
- Diverse neighborhood (Simpson 0.61)
- Race & ethnicity
- White 50% Hispanic / Latino 35% Two or more races 14% Asian 10% Native American 2% Black 2%
- Hispanic origin (detail)
- Mexican 32%
- Common ancestry
- Romanian 6% Scotch-Irish 1% Subsaharan African 1%
- Foreign-born
- 28% · Canada, China, South Korea
- Languages at home
- 55% English-only · Spanish 29% Russian/Polish/Slavic 5% Other Indo-European 4%
Political lean MEDSL · Lake
- 2024 margin
- Strong D (+20.8) · D 59.7% · R 38.9% · Other 1.4%
- 2008→2024 swing
- +1.1pp toward D · 2008: 19.6pp · 2024: 20.8pp
- All cycles
- 2024: D+20.8 2020: D+24.1 2016: D+20.3 2012: D+8.1 2008: D+19.6
Not yet ingested
- Civics
- —
Market trends
- HPI YoY
- ▼ -173.41%
- Current HPI
- 201.0795
- Rent YoY
- ▲ 2.67%
- Metro
- Chicago-Naperville-Elgin, IL-IN-WI
- State GDP YoY
- ▲ 1.59%
- F500 in state
- 60
Industry mix (Fortune 500 HQ in IL)
| Industry | F500 HQs | Revenue |
|---|---|---|
| Insurance | 4 | $201B |
|
||
| Consumer Goods | 4 | $87B |
|
||
| Industrial Machinery | 3 | $64B |
|
||
| Healthcare | 2 | $55B |
|
||
| Retail / Pharmacy | 1 | $148B |
|
||
| Agriculture / Food | 1 | $86B |
|
||
Cash-flow waterfall
monthlySold comps — $/sqft
last 12 mo · ≤1 miLoading sold comps…