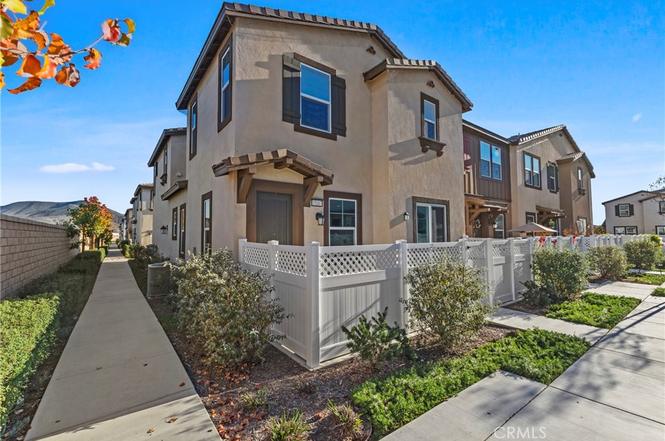
34495 Agave #15107 · French Valley, CA
Flood risk 3/10 · Minor
- FEMA flood zone
- D
- Chance of flooding over 30 yrs
- 0.2%
- Est. flood insurance / yr
- $544 – $1,084
Fire risk 7/10 · Major
- Est. fire insurance / yr
- $659 – $1,223
Heat risk 7/10 · Major
- Hot days now (above 104°F)
- 7 days/yr
- Hot days in 30 yrs
- 21 days/yr
Wind risk 1/10 · Minimal
- Chance of severe wind over 30 yrs
- —
Air-quality risk 4/10 · Minor
- Unhealthy air days now
- 6 days/yr
- Unhealthy air days in 30 yrs
- 7 days/yr
Risk factors via First Street. Map © Google.
Why this score? — see what drove the D- grade
The composite is a weighted blend of 9 inputs, each scored 0–100. Each bar is that input's sub-score; the figure is the points it added to the 100-point composite (weight × sub-score).
- Appreciation +10.0/10.0
- ARV discount +7.5/15.0
- Schools +5.7/10.0
- Cash flow +5.4/30.0
- Livability +3.0/5.0
- Condition / age +2.5/5.0
- Rent growth +2.3/5.0
- 1% rule +2.2/10.0
- DSCR +0.0/10.0
$473,500
🖨 Deal sheet 📄 Offer letter ✓ Due diligence
Listing remarks
Back on market through no fault of seller. Buyer was unable to satisfy the contingency requirements related to the sale of their current property. Welcome to this 3 bedroom, 2.5 bathroom home offering 1,674 square feet, located in the Sevilla community of Winchester and offers a rare 5% VA assumable loan opportunity. The property features a functional floor plan with comfortable living spaces and owned solar, providing long term energy savings. The community offers amenities including a clubhouse, pool, spa, playground, picnic areas, and maintained common areas. Conveniently located near shopping, dining, parks, and within the Temecula Valley school district. A great opportunity for buyers
Key facts
- $327 HOA
- 2 garage spots
- Community pool
Property features AI
Finance
- Financial info: Subject to special assessments
- HOA & community: Part of Sevilla homeowners association; Association fee of $327 monthly; Community amenities include pickleball, paddle tennis, tennis, pool, spa, playground, and park; 118 units in the community
Exterior
- Parking: Attached garage; Garage with 2 parking spaces; Total of 2 parking spaces
- Security: Carbon monoxide detector(s)
- Utilities: Standard electric; Public/district water; Public sewer; See remarks for additional utilities
- Home design: Multi-family condominium; Attached property with one common wall; Turnkey condition; Two stories; Entry on level 1; Has a view
- Construction: Tile roof; Finished basement; Concrete slab foundation; Year built per assessor
- Exterior features: Patio; Pool available through association; Corner lot; Fence in excellent condition
Interior
- Kitchen: Gas oven; Gas & electric range; Eating area in kitchen / family kitchen
- Bedrooms: Three main-level bedrooms; All bedrooms upstairs; Primary suite
- Flooring: Wood flooring; See remarks for additional flooring details
- Bathrooms: Two full bathrooms; One half bathroom; Bathrooms include walk-in shower and bathtub/shower
- Heating & cooling: Central cooling; Central furnace heating
- Interior features: Open floor plan; Insulated windows; Carbon monoxide detector(s); Spa access via association/community
- Laundry & utility: Has laundry; Gas dryer hookup
Neighborhood map
What this means for you Summary
Snapshot
- This is a 3-bed/2.5-bath condo listed at $474k.
Deal economics
- At list price, monthly cash flow is $-1k ($-12k/yr) — negative.
- To cash-flow at today's rent, offer at most $291k (38.5% below list).
- To meet the 1% rule (rent ≥ 1% of price), the offer needs to be $339k (28.4% below list).
- Recommended offer: $291k (38.5% below list) — sets the bar for cash-flow.
Location & tenants
- Location reads 59/100 on livability (#655 in CA) — a working-class tenant base; expect higher turnover. Strengths: employment A+, housing A+; Watch: schools D-, crime D-, amenities F.
- Temecula Valley Unified (urban): math 55% / reading 69% proficiency, ranked #173 of 1,400 in CA (top 12%) — acceptable for families but not a draw, mixed tenant base, ~2y average lease; only 17% free/reduced lunch — higher-income household profile.
- Market conditions: Rents soft (-0.8%/yr); 355 active listings in the ZIP; 9 comparable units currently listed for rent nearby; rentals at typical pace (median 17d on market — plan ~3-4 weeks tenant-placement turnaround); high-income renter base; 9,195 units permitted in Riverside County in 2024 (1,512 in 5+ unit buildings).
- This rent runs 31% of the median local income ($133k/yr) — at the standard rent-burdened threshold; future hikes will face affordability resistance.
Forward outlook
- In year one you build about $51k of equity ($3k loan paydown + $47k appreciation (10.0% local appreciation)).
- Riverside County population projected at +22% by 2050 — long-run rental-demand tailwind backs the buy-and-hold thesis.
- By year 2, paydown + projected appreciation supports a ~$81k cash-out refi (75% LTV) — recoverable capital for the next deal without selling this one.
Negotiation context
- It's been on market 175 days — a 12% lower offer ($417k) is reasonable based on typical stale-listing flexibility.
- 2 sale attempts with the ask held roughly flat each time — persistent listings suggest the price (not the market) is what's stuck; bring a comps-based counter.
Risks & watch-outs
- Climate carrying-cost: major wildfire risk; extreme-heat days projected 7→21/yr by 2055 (HVAC capex compounding) — expect insurance premiums to compound above CPI over the hold.
Questions for the listing agent
- What do current leases actually rent for vs. the listed asking? Can we see a recent rent roll and the last 12 months of T-12 income?
- It's been on market 175 days. Have you received any prior offers? Is the seller open to a 39% concession, seller financing, or rate buy-down credit?
- What does the HOA fee cover, when was the last increase, and are there any pending special assessments or reserve-fund shortfalls?
- Any open or pending special assessments — roof, HVAC, plumbing, elevator, façade? What's the per-unit balance and payoff schedule, and is the seller paying it off at close or rolling it to the buyer?
- Why hasn't it sold? Are there any deal-killer items the seller is aware of (foundation, flood, title, zoning, code violations)?
- Is there a deadline driving the sale (1031 exchange, divorce, estate, relocation)? That informs how much negotiation room exists.
- Schools are D-rated, which usually means shorter tenancies and higher turnover. Who's the typical renter profile here, and what's been the actual vacancy rate?
- Crime grade is D in this area — have there been break-ins, vandalism, or insurance claims at this property in the last 3 years? What carrier currently insures it and at what premium?
- The area grade is low — what's the realistic commute time and amenity access for the typical tenant pool here? Any planned neighborhood developments (good or bad) we should know about?
- What's the average days-on-market for RENTAL listings here right now (not sales)? A rising rental-DOM trend means longer vacancies and softer asking-rent achievability than the comps imply.
- What's the recent tenant-quality profile in this submarket — average credit score on applications, eviction rate, late-payment / NSF rate, and stable-employment percentage? A property-management company in the area should have these aggregated.
- How much new apartment / multifamily construction is in the pipeline within 1–3 miles? Heavy new supply (>2% of stock underway) typically softens rents 12–24 months out; light construction supports rent growth.
Investment metrics
- 1% rule
- 0.72% ✗
- Cap rate
- 3.68%
- Cash-on-cash
- -9.35%
- DSCR
- 0.58
- GRM
- 11.6
CMA / ARV
No comps found within radius.
Projected returns pro-forma
10.0% appreciation · 0.0% rent growth · sell at horizon
- IRR
- 16.9%
- Equity multiple
- 2.38×
- Total profit
- $182,499
- Equity at exit
- $426,566
- IRR
- 15.5%
- Equity multiple
- 5.31×
- Total profit
- $571,981
- Equity at exit
- $919,906
Cash invested: $132,580 (down + closing). Projections, not guarantees.
Landlord ↔ Tenant lean methodology
- Overall (STATE)
- 18 Strongly Tenant-Friendly
- State California
- 18 Strongly Tenant-Friendly · D+13
- County
- — inherits STATE
- City
- — inherits STATE
ZIP-level market 92596
- Home prices YoY
- 3.9%
- Rents YoY
- -0.8%
- Active inventory
- 355
- Price-to-rent
- 11.6×
Monthly cashflow live
- Estimated rent
- $3,393 high interval (Pro) →
- Mortgage (P&I)
- −$2,483
- Tax from tax record
- −$705 /mo · $8,463/yr
- Insurance
- −$197
- HOA
- −$327
- Vacancy / Maint / Mgmt
- −$712
- Net cashflow
- $-1,033
Break-even live
UW: 25.0% down · 7.5% · 30yr · 1.5% tax · 5.0% vac · 8.0% maint · 8.0% mgmt
Financing live
Cash to close
- Down payment
- $118,375
- Closing costs
- $14,205
- Reserves months
- —
- Total cash needed
- —
Loan-product check · same deal, 3 products live
Conventional
25% down · 7.5% · 30yr
- Down + closing
- —
- Monthly P&I
- —
- Monthly cashflow
- —
- DSCR
- —
- Eligible?
- —
Personal DTI + credit; lowest rate.
DSCR
20% down · 8.5% · 30yr
- Down + closing
- —
- Monthly P&I
- —
- Monthly cashflow
- —
- DSCR
- —
- Eligible?
- —
No personal income docs; deal must DSCR.
Hard money
10% down · 12.0% · 12mo
- Down + closing
- —
- Monthly P&I
- —
- Monthly cashflow
- —
- DSCR
- —
- Eligible?
- —
Short-term bridge; refi at stabilization.
Rent comps 9 comps
| Address | Beds | Baths | Sqft | Rent | $/sqft | DOM | Units | Dist |
|---|---|---|---|---|---|---|---|---|
| 34495 Agave Dr Bldg 24 Winchester, CA | 3.0 | 2.5 | 1400 | $2,645 | $1.89 | 24d | 1 | 0.02mi |
| 34495 Agave Dr #1105 Winchester, CA | 3.0 | 2.5 | 1399 | $3,250 | $2.32 | 10d | 1 | 0.02mi |
| 34495 Agave Dr #20106 Winchester, CA | 3.0 | 2.5 | 1400 | $3,050 | $2.18 | 18d | 1 | 0.02mi |
| 34875 Pourroy Rd Winchester, CA | 1.0–2.0 | 1.0–2.0 | 976 | $2,980 | $3.05 | 2d | 1 | 0.65mi |
| 33014 Marin Fields Rd Winchester, CA | 4.0 | 2.0 | 1779 | $3,795 | $2.13 | 44d | 1 | 0.79mi |
| 34543 Ciruela AVE French Valley, CA | 3.0 | 2.5 | 1497 | $3,400 | $2.27 | 2d | 1 | 0.94mi |
| 31647 Angel Aura Dr Winchester, CA | 3.0 | 2.5 | 1711 | $3,195 | $1.87 | 17d | 1 | 0.99mi |
| 31629 Angel Aura Dr Winchester, CA | 3.0 | 3.0 | 1711 | $3,099 | $1.81 | 22d | 1 | 0.99mi |
| 35350 Marabella Ct Unit 35350 Winchester, CA | 3.0 | 2.5 | 1925 | $3,300 | $1.71 | 2d | 1 | 1.16mi |
HOA detail condo
- Monthly dues
- $327 · $3,924/yr
- Likely covers
- pool
- Assessments
- None detected in remarks — confirm with the listing agent.
Listing history 20 events
-
2026-06-18days on market $473,500 Active 175 DOM
-
2026-06-17days on market $473,500 Active 174 DOM
-
2026-06-16days on market $473,500 Active 173 DOM
-
2026-06-15days on market $473,500 Active 172 DOM
-
2026-06-13days on market $473,500 Active 170 DOM
-
2026-06-09days on market $473,500 Active 166 DOM
-
2026-06-08days on market $473,500 Active 165 DOM
-
2026-06-07days on market $473,500 Active 164 DOM
-
2026-06-04statusdays on market $473,500 Active 161 DOM
-
2026-06-03days on market $473,500 Active Under Contract 160 DOM
-
2026-06-02days on market $473,500 Active Under Contract 159 DOM
-
2026-06-01days on market $473,500 Active Under Contract 158 DOM
-
2026-05-31days on market $473,500 Active Under Contract 157 DOM
-
2026-05-05Active Under Contract
-
2026-04-30soldstatus Closed Sale
-
2026-04-15historical Active Under Contract
-
2026-04-08status Pending Sale
-
2026-03-09historical Active Under Contract
-
2025-12-13$473,500 Active
-
2025-12-13historical $473,500
ⓘ Source: listings_history table (triggers on properties + properties_extension) + one-shot
backfill from property_details.listing_events for pre-trigger history.
Tax reassessment forecast CA · Resets to sale price
- Current annual tax
- $8,463 · $705/mo
- Projected year-2 tax
- $8,463 · $705/mo
- Expected delta
- $0/yr ($0/mo · 0.0%)
ⓘ Screening estimate from a state-policy table — verify with the county assessor before closing.
Climate risk First Street
- Flood 3/10 Moderate FEMA zone D · 20% chance over 30 yrs
- Wildfire 7/10 Severe
- Heat 7/10 Severe 7 d/yr ≥104°F today · 21 d/yr by 30 yrs out
- Wind 1/10 Low
- Air quality 4/10 Moderate 6 unhealthy d/yr today · 7 by 30 yrs out
Nearby sold comps map
Loading sold comps map…
Walkable amenities ~0.75 mi
Loading nearby amenities…
Taxation est. · year 1
- Rental income
- $40,710
- − Mortgage interest
- −$26,523
- − Property taxes
- −$8,463
- − Insurance
- −$2,368
- − Repairs & maintenance
- −$3,257
- − Management
- −$3,257
- − HOA
- −$3,924
- − Depreciation
- −$13,775
- Taxable loss
- −$20,856
- Est. tax savings @ 24.0%
- +$5,005
- After-tax cash flow
- $-7,385/yr
For passive investors: Depreciation is non-cash, so a rental often shows a tax loss while cash-flowing — sheltering income. Rental losses are passive: they offset passive income freely, and up to $25,000/yr can offset ordinary (W-2) income if you actively participate and your MAGI is under $100k (phasing out to $0 by $150k); unused losses carry forward. On sale, claimed depreciation is recaptured at up to 25%, and gains may owe capital-gains tax (a 1031 exchange can defer both). Figures are a year-1 estimate at your 24.0% rate — not tax advice; consult a CPA.
Schools (NCES district)
- District
- Temecula Valley Unified
- NCES district ID
- 0600028
- Math proficiency
- 55% ▲ 1.00%
- Reading proficiency
- 69% ▲ 1.00%
- Median HH income
- $84,032
- Composite
- 57.48/100
- National rank
- #2264
- State rank
- #173 of 1400 in CA
Livability — French Valley
- Score
- 59/100
- State rank
- #655
- US rank
- #20351
Category grades
Schools grade is shown separately in the Schools card above.
Census & demographics
- Census place
- French Valley, CA
- County
- Riverside County · 2,287,001 people
- Metro
- Riverside-San Bernardino-Ontario, CA
- Population (ZIP)
- 38,981
- Household income
- $132,538
- Rent vs Own
- Severe rent burden
- 591.0
Population outlook (Riverside County) Hauer SSP2
- Today (2025)
- 2,664,475 people
- By 2030
- 2,802,692 · +5.2%
- By 2040
- 3,050,904 · +14.5%
- By 2050
- 3,256,783 · +22.2%
- By 2075
- 3,655,058 · +37.2%
- By 2100
- 3,766,594 · +41.4%
Race, ethnicity, and origin ACS 2023
- Neighborhood character
- Highly diverse neighborhood (Simpson 0.72)
- Race & ethnicity
- White 38% Hispanic / Latino 34% Two or more races 16% Asian 12% Black 6% Pacific Islander 2%
- Hispanic origin (detail)
- Mexican 29%
- Common ancestry
- Slovak 3% Italian 2% Portuguese 1%
- Foreign-born
- 14% · Canada, Vietnam
- Languages at home
- 76% English-only · Spanish 16% Tagalog/Filipino 4% Vietnamese 1%
Political lean MEDSL · Riverside
- 2024 margin
- Toss-up / Even · D 48.0% · R 49.3% · Other 2.6%
- 2008→2024 swing
- -3.6pp toward R · 2008: 2.3pp · 2024: -1.3pp
- All cycles
- 2024: R+1.3 2020: D+8.0 2016: D+4.3 2012: R+0.4 2008: D+2.3
Not yet ingested
- Civics
- —
Market trends
- HPI YoY
- ▲ 12.43%
- Current HPI
- 332.169
- Rent YoY
- ▼ -0.79%
- Metro
- Riverside-San Bernardino-Ontario, CA
- State GDP YoY
- ▲ 3.21%
- F500 in state
- 116
Industry mix (Fortune 500 HQ in CA)
| Industry | F500 HQs | Revenue |
|---|---|---|
| Technology | 27 | $1,492B |
|
||
| Financial Services | 3 | $174B |
|
||
| Retail | 3 | $44B |
|
||
| Insurance | 3 | $26B |
|
||
| Media / Entertainment | 2 | $115B |
|
||
| Pharmaceuticals / Biotech | 2 | $62B |
|
||
Price history
+0.0% since first listed7 events — show timeline
- 2026-05-05 Listed — CRMLS
- 2026-04-30 Sold (MLS) — CRMLS
- 2026-04-15 Contingent — CRMLS
- 2026-04-08 Pending — CRMLS
- 2026-03-09 Contingent — CRMLS
- 2025-12-13 Listed $473,500 CRMLS
- 2025-12-13 Coming Soon $473,500 CRMLS
Property tax history
+1.3%/yrLatest (2025): $8,463 · +1.3% YoY. Source: county tax records.
Cash-flow waterfall
monthlySold comps — $/sqft
last 12 mo · ≤1 miLoading sold comps…