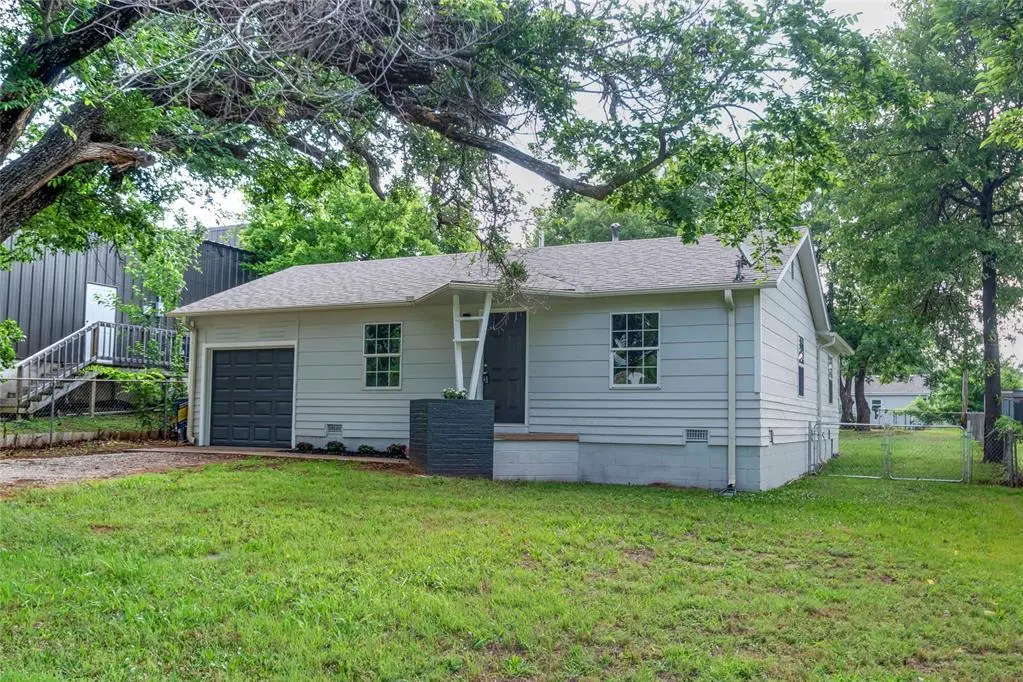
100 S Iowa Ave · Chandler, OK
Flood risk 1/10 · Minimal
- FEMA flood zone
- X (unshaded)
- Chance of flooding over 30 yrs
- 0.0%
- Est. flood insurance / yr
- $507 – $1,088
Fire risk 6/10 · Moderate
- Est. fire insurance / yr
- $2,463 – $4,575
Heat risk 6/10 · Moderate
- Hot days now (above 110°F)
- 7 days/yr
- Hot days in 30 yrs
- 18 days/yr
Wind risk 3/10 · Minor
- Chance of severe wind over 30 yrs
- 5.0%
Air-quality risk 2/10 · Minimal
- Unhealthy air days now
- 1 days/yr
- Unhealthy air days in 30 yrs
- 1 days/yr
Risk factors via First Street. Map © Google.
Why this score? — see what drove the D grade
The composite is a weighted blend of 9 inputs, each scored 0–100. Each bar is that input's sub-score; the figure is the points it added to the 100-point composite (weight × sub-score).
- Cash flow +14.7/30.0
- Appreciation +10.0/10.0
- DSCR +4.5/10.0
- 1% rule +3.3/10.0
- Livability +3.2/5.0
- Schools +3.0/10.0
- Rent growth +2.5/5.0
- Condition / age +2.5/5.0
- ARV discount +0.0/15.0
$115,000
🖨 Deal sheet (PDF) 📄 Offer letter ✓ Due diligence
Listing remarks MLS
This 3 bedroom, 1 bath, 972 sq. ft. m/l is move in ready. 1 car attached garage. Home has hardwood and laminate flooring throughout. 3 window units will remain with the property along with 2 radiant gas wall heaters. Attic has been insulated as well as the crawl space to help keep this home warm and cozy. Refrigerator and kitchen stove will remain, but not guaranteed. They were left by the previous tenants. There are two small storage building in the partially fenced backyard. This home will be a great starter or investment. It is located close to Hwy 66 and the turnpike making for an easy commute to OKC or Tulsa. Make your appointment today -
Key facts
- Large patio
- Storage shed
- Fenced backyard
Tags
Property features AI
Finance
- Other: Homestead designation; Assessor-reported living area; Located in Chandler-East Chand addition; Directions: From HWY 66 and Iowa go South 55 yards - house on the left
- Financial info: Loan qualification available; Not assumable
- HOA & community: No mandatory association dues
Exterior
- Parking: 1-car garage
- Home design: Single family residence; One story; Residential property; Existing property
- Construction: Frame construction; Composition roof; Conventional foundation; Built-in prior to listing (existing)
- Exterior features: Open patio; Interior lot
Interior
- Bedrooms: 3 bedrooms
- Bathrooms: 1 full bathroom
- Interior features: One living area; No fireplace
Neighborhood map
What this means for you Summary
Snapshot
- This is a 3-bed/1.0-bath single-family listed at $115k.
Deal economics
- At list price, monthly cash flow is $30 ($360/yr) — positive.
- The deal already cash-flows at list — no discount required.
- To meet the 1% rule (rent ≥ 1% of price), the offer needs to be $95k (17.0% below list).
- Recommended offer: $95k (17.0% below list) — sets the bar for 1% rule.
- Cap rate 6.6% vs local median 2.8% in Chandler — top-decile yield for the area; either an underpriced asset or a hidden risk that comps aren't pricing in. Stress-test before assuming the spread holds.
Location & tenants
- Location reads 64/100 on livability (#171 in OK) — a middle-class / working-renter tenant base. Strengths: cost of living A+, housing A+; Watch: crime D, employment D, amenities F.
- Chandler (town): math 35% / reading 35% proficiency, ranked #36 of 270 in OK (top 13%) — families likely to look elsewhere, expect single-tenant / working-renter base with shorter leases.
- Zoned schools: Park Road Es (math 38% / reading 36%, grade F, #132 of 845 statewide, top 19%, 313 students, 0% FRL); Chandler Jhs (math 27% / reading 27%, grade F, #72 of 345 statewide, top 22%, 160 students, 0% FRL); Chandler Hs (math 47% / reading 52%, grade D, #9 of 447 statewide, top 2%, 335 students, 0% FRL) — zoned schools average 0% FRL vs 42% district-wide (42 pts lower); this property's tenant base skews higher-income than the district average.
- Market conditions: 122 active listings in the ZIP; 19 units permitted in Lincoln County in 2024 (0 in 5+ unit buildings).
Forward outlook
- In year one you build about $12k of equity ($795 loan paydown + $12k appreciation (10.0% local appreciation)).
- At projected returns (10.0% appreciation + 3.0% rent growth), your $32k cash investment doubles in ~3 years — after that, you're playing with house money.
- By year 3, paydown + projected appreciation supports a ~$31k cash-out refi (75% LTV) — recoverable capital for the next deal without selling this one.
Negotiation context
- Only 12 days on market — expect competitive offers; lowballing is unlikely to land.
- 3 sale attempts since 10y ago with the ask held roughly flat each time — persistent listings suggest the price (not the market) is what's stuck; bring a comps-based counter.
- Current owner paid $88k; 31% above their basis — modest negotiation headroom, anchor on the comps not their cost.
Risks & watch-outs
- Watch-outs: built in 1954 — expect roof / HVAC / electrical / plumbing capex.
- Climate carrying-cost: major wildfire risk; extreme-heat days projected 7→18/yr by 2055 (HVAC capex compounding) — expect insurance premiums to compound above CPI over the hold.
Questions for the listing agent
- Built in 1954 — when were the roof, HVAC, electrical panel, plumbing, and water heater last replaced?
- Is there a deadline driving the sale (1031 exchange, divorce, estate, relocation)? That informs how much negotiation room exists.
- Schools are F-rated, which usually means shorter tenancies and higher turnover. Who's the typical renter profile here, and what's been the actual vacancy rate?
- Crime grade is D in this area — have there been break-ins, vandalism, or insurance claims at this property in the last 3 years? What carrier currently insures it and at what premium?
- The area grade is low — what's the realistic commute time and amenity access for the typical tenant pool here? Any planned neighborhood developments (good or bad) we should know about?
- What's the average days-on-market for RENTAL listings here right now (not sales)? A rising rental-DOM trend means longer vacancies and softer asking-rent achievability than the comps imply.
- What's the recent tenant-quality profile in this submarket — average credit score on applications, eviction rate, late-payment / NSF rate, and stable-employment percentage? A property-management company in the area should have these aggregated.
- How much new for-sale + rental construction is in the pipeline within 1–3 miles? Heavy new supply typically softens prices + rents 12–24 months out; constrained supply supports both.
Investment metrics
- 1% rule
- 0.83% ✗
- Cap rate
- 6.61%
- Cash-on-cash
- 1.12%
- DSCR
- 1.05
- GRM
- 10.0
CMA / ARV
- ARV (on-the-fly)
- $93,312
- Comps found
- 10
Show comp detail 10 sales within ~0.75 mi
| Address | Dist | Beds/Ba | Sqft | Sold | Price | $/sf | Match |
|---|---|---|---|---|---|---|---|
| 117 N Cleveland | 0.20mi | 3/2.0 | 1,050 (+8%) | 9mo | $144,000 | $137 | 66 |
| 602 E 6th St | 0.31mi | 2/1.0 (-1) | 1,026 (+6%) | 10mo | $99,000 | $96 | 63 |
| 221 N Iowa St | 0.14mi | 2/1.5 (-1) | 868 (-11%) | 10mo | $78,000 | $90 | 60 |
| 208 E 10th St | 0.63mi | 2/1.0 (-1) | 924 (-5%) | 2mo | $135,000 | $146 | 56 |
| 303 E 4th St | 0.25mi | 2/1.0 (-1) | 864 (-11%) | 16mo | $62,000 | $72 | 52 |
| 1014 S Dewey Ave | 0.65mi | 2/1.0 (-1) | 1,010 (+4%) | 9mo | $34,500 | $34 | 51 |
| 618 Steele Ave | 0.52mi | 2/2.0 (-1) | 1,076 (+11%) | 5mo | $19,000 | $18 | 45 |
| 912 S Bennett Blvd | 0.59mi | 2/1.5 (-1) | 840 (-14%) | 15mo | $47,500 | $57 | 30 |
| 614 S Price Ave | 0.63mi | 2/1.5 (-1) | 1,116 (+15%) | 12mo | $113,500 | $102 | 29 |
| 505 E 11th St | 0.70mi | 3/2.0 | 1,104 (+14%) | 16mo | $170,000 | $154 | 28 |
Match score weights: distance 35% · size 25% · config 20% · recency 20%. Top-matched comps best support the ARV.
Projected returns pro-forma
10.0% appreciation · 3.0% rent growth · sell at horizon
- IRR
- 25.1%
- Equity multiple
- 3.00×
- Total profit
- $64,514
- Equity at exit
- $103,601
- IRR
- 22.1%
- Equity multiple
- 6.85×
- Total profit
- $188,424
- Equity at exit
- $223,420
Cash invested: $32,200 (down + closing). Projections, not guarantees.
Landlord ↔ Tenant lean methodology
- Overall (STATE)
- 83 Strongly Landlord-Friendly
- State Oklahoma
- 83 Strongly Landlord-Friendly · R+20
- County
- — inherits STATE
- City
- — inherits STATE
ZIP-level market 74834
- Home prices YoY
- 19.9%
- Active inventory
- 122
- Price-to-rent
- 10.0×
Monthly cashflow live
- Estimated rent
- $955 medium interval (Pro) →
- Mortgage (P&I)
- −$603
- Tax from tax record
- −$73 /mo · $881/yr
- Insurance
- −$48
- HOA
- −$0
- Vacancy / Maint / Mgmt
- −$201
- Net cashflow
- $30
Break-even live
Sensitivity live
| Price | -10% $95 | -5% $63 | +0% $30 | +5% $-3 | +10% $-35 |
|---|---|---|---|---|---|
| Rent | -10% $-45 | -5% $-8 | +0% $30 | +5% $68 | +10% $105 |
| Rate | -1.0pp $88 | -0.5pp $59 | base $30 | +0.5pp $0 | +1.0pp $-30 |
UW: 25.0% down · 7.5% · 30yr · 1.5% tax · 5.0% vac · 8.0% maint · 8.0% mgmt
Financing live
Cash to close
- Down payment
- $28,750
- Closing costs
- $3,450
- Reserves months
- —
- Total cash needed
- —
Loan-product check · same deal, 3 products live
Conventional
25% down · 7.5% · 30yr
- Down + closing
- —
- Monthly P&I
- —
- Monthly cashflow
- —
- DSCR
- —
- Eligible?
- —
Personal DTI + credit; lowest rate.
DSCR
20% down · 8.5% · 30yr
- Down + closing
- —
- Monthly P&I
- —
- Monthly cashflow
- —
- DSCR
- —
- Eligible?
- —
No personal income docs; deal must DSCR.
Hard money
10% down · 12.0% · 12mo
- Down + closing
- —
- Monthly P&I
- —
- Monthly cashflow
- —
- DSCR
- —
- Eligible?
- —
Short-term bridge; refi at stabilization.
Listing history 10 events
-
2026-06-21days on market $115,000 Active 12 DOM
-
2026-06-21days on market $115,000 Active 11 DOM
-
2026-06-18days on market $115,000 Active 9 DOM
-
2026-06-17days on market $115,000 Active 8 DOM
-
2026-06-16days on market $115,000 Active 7 DOM
-
2026-06-15days on market $115,000 Active 6 DOM
-
2026-06-13days on market $115,000 Active 4 DOM
-
2026-06-12days on market $115,000 Active 3 DOM
-
2026-06-09remarks 699-char remark
-
2026-06-09$115,000 Active 1 DOM
ⓘ Source: listings_history table (triggers on properties + properties_extension) + one-shot
backfill from property_details.listing_events for pre-trigger history.
Tax reassessment forecast OK · Resets to sale price
- Current annual tax
- $881 · $73/mo
- Projected year-2 tax
- $1,035 · $86/mo
- Expected delta
- +$154/yr (+$13/mo · 17.5%)
ⓘ Screening estimate from a state-policy table — verify with the county assessor before closing.
Climate risk First Street
- Flood 1/10 Low FEMA zone X (unshaded) · 0% chance over 30 yrs
- Wildfire 6/10 Major
- Heat 6/10 Major 7 d/yr ≥110°F today · 18 d/yr by 30 yrs out
- Wind 3/10 Moderate 5% chance of damaging wind over 30 yrs
- Air quality 2/10 Low 1 unhealthy d/yr today · 1 by 30 yrs out
Nearby sold comps map
Loading sold comps map…
Walkable amenities ~0.75 mi
Loading nearby amenities…
Taxation est. · year 1
- Rental income
- $11,459
- − Mortgage interest
- −$6,442
- − Property taxes
- −$881
- − Insurance
- −$575
- − Repairs & maintenance
- −$917
- − Management
- −$917
- − Depreciation
- −$3,345
- Taxable loss
- −$1,617
- Est. tax savings @ 24.0%
- +$388
- After-tax cash flow
- $748/yr
For passive investors: Depreciation is non-cash, so a rental often shows a tax loss while cash-flowing — sheltering income. Rental losses are passive: they offset passive income freely, and up to $25,000/yr can offset ordinary (W-2) income if you actively participate and your MAGI is under $100k (phasing out to $0 by $150k); unused losses carry forward. On sale, claimed depreciation is recaptured at up to 25%, and gains may owe capital-gains tax (a 1031 exchange can defer both). Figures are a year-1 estimate at your 24.0% rate — not tax advice; consult a CPA.
Schools (NCES district)
- District
- Chandler
- NCES district ID
- 4007290
- Math proficiency
- 35% ▲ 1.00%
- Reading proficiency
- 35% ▬ 0.00%
- Median HH income
- $45,229
- Composite
- 29.9/100
- National rank
- #6392
- State rank
- #36 of 270 in OK
Livability — Chandler
- Score
- 64/100
- State rank
- #171
- US rank
- #13840
Category grades
Schools grade is shown separately in the Schools card above.
Census & demographics
- Census place
- Chandler, OK
- City population
- 7,551
- Population (ZIP)
- 7,551
Population outlook (Lincoln County) Hauer SSP2
- Today (2025)
- 36,104 people
- By 2030
- 36,435 · +0.9%
- By 2040
- 36,696 · +1.6%
- By 2050
- 36,216 · +0.3%
- By 2075
- 35,057 · -2.9%
- By 2100
- 31,333 · -13.2%
Race, ethnicity, and origin ACS 2023
- Neighborhood character
- Predominantly White (78%)
- Race & ethnicity
- White 78% Two or more races 12% Hispanic / Latino 3% Black 3% Native American 3%
- Common ancestry
- Lithuanian 4% Slovak 2% Scottish 1%
- Foreign-born
- 1%
- Languages at home
- 97% English-only · Spanish 2%
Political lean MEDSL · Lincoln
- 2024 margin
- Solid R (+63.3) · D 17.5% · R 80.8% · Other 1.7%
- 2008→2024 swing
- -13.4pp toward R · 2008: -49.8pp · 2024: -63.3pp
- All cycles
- 2024: R+63.3 2020: R+63.2 2016: R+60.1 2012: R+49.0 2008: R+49.8
Not yet ingested
- Civics
- —
Market trends
- HPI YoY
- ▲ 52.43%
- Current HPI
- 315.8775
- Rent YoY
- —
- Metro
- —
- State GDP YoY
- ▲ 1.55%
- F500 in state
- 6
Industry mix (Fortune 500 HQ in OK)
| Industry | F500 HQs | Revenue |
|---|---|---|
| Energy | 3 | $48B |
|
||
Price history
+1860.1% since first listed10 events — show timeline
- 2026-06-06 Listed $115,000 MLSOK
- 2024-03-22 Sold (Public Records) $87,500 Public Records
- 2024-03-21 Sold (MLS) $87,500 MLSOK
- 2024-02-28 Pending — MLSOK
- 2024-02-15 Listed $105,000 MLSOK
- 2017-02-21 Sold (Public Records) $47,500 Public Records
- 2017-02-16 Sold (MLS) $47,500 MLSOK
- 2017-01-05 Pending — MLSOK
- 2016-12-28 Listed $49,900 MLSOK
- 1954-11-24 Sold (Public Records) $5,867 Public Records
Property tax history
+13.1%/yrLatest (2025): $881 · +82.0% YoY. Source: county tax records.
Cash-flow waterfall
monthlySold comps — $/sqft
last 12 mo · ≤1 miLoading sold comps…