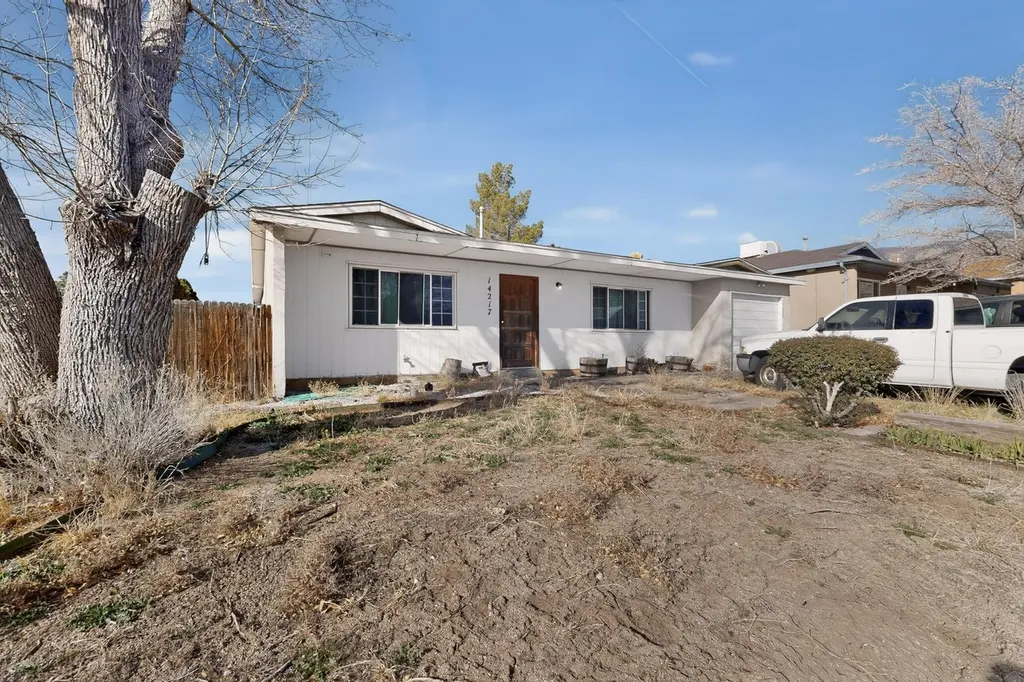
14217 Sedrev Rd NE · Albuquerque, NM
Flood risk 1/10 · Minimal
- FEMA flood zone
- X (unshaded)
- Chance of flooding over 30 yrs
- 0.0%
- Est. flood insurance / yr
- $507 – $1,088
Fire risk 4/10 · Minor
- Est. fire insurance / yr
- $706 – $1,312
Heat risk 4/10 · Minor
- Hot days now (above 91°F)
- 4 days/yr
- Hot days in 30 yrs
- 11 days/yr
Wind risk 1/10 · Minimal
- Chance of severe wind over 30 yrs
- —
Air-quality risk 1/10 · Minimal
- Unhealthy air days now
- 0 days/yr
- Unhealthy air days in 30 yrs
- 0 days/yr
Risk factors via First Street. Map © Google.
Why this score? — see what drove the D grade
The composite is a weighted blend of 9 inputs, each scored 0–100. Each bar is that input's sub-score; the figure is the points it added to the 100-point composite (weight × sub-score).
- ARV discount +15.0/15.0
- Cash flow +10.1/30.0
- Schools +5.3/10.0
- Livability +3.6/5.0
- DSCR +2.9/10.0
- Condition / age +2.5/5.0
- 1% rule +2.4/10.0
- Rent growth +2.0/5.0
- Appreciation +0.0/10.0
$270,000
🖨 Deal sheet (PDF) 📄 Offer letter ✓ Due diligence
Listing remarks
: Motivated Seller! Don't miss this incredible opportunity to own a beautiful home in a highly desirable area near the stunning Sandia Mountains. Perfectly situated just minutes from some of the area's most famous hiking and outdoor trails, this home offers the ideal blend of comfort, convenience, and adventure right outside your door. Featuring 4 spacious bedrooms and 2 full bathrooms, this home boasts a thoughtfully designed, well spread floor plan that provides both functionality and privacy. The open-concept living room is warm and inviting. Perfect for entertaining guests or enjoying cozy evenings at home. Waiting for its next homeowner, this is an opportunity you don't want to miss!
Key facts
- Sandia mountains
- 6,882 sq ft lot
- Garage
Tags
Property features AI
Exterior
- Parking: Attached garage (1 car)
- Utilities: Public water; Public sewer; Electricity available; Cable available
- Home design: Single-story; Faces south; Resale property
- Construction: Board and batten siding, frame, and stucco exterior; Pitched roof
- Exterior features: Open patio; Screened patio; Storage structure
Interior
- Kitchen: Refrigerator; Range hood
- Bedrooms: Main-level bedroom (Bedroom 4); Main-level bedroom (Bedroom 3); Main-level bedroom (Bedroom 2)
- Flooring: Carpet; Tile
- Bathrooms: 1 full bathroom; 1 three-quarter bathroom
- Heating & cooling: Central heating; Forced air heating; Evaporative cooling
- Interior features: Main-level primary bedroom; Cable TV; Thermal windows
- Laundry & utility: Washer; Dryer; Washer hookup; Electric dryer hookup; Gas dryer hookup
Neighborhood map
What this means for you Summary
Snapshot
- This is a 4-bed/2.0-bath single-family listed at $270k.
Deal economics
- At list price, monthly cash flow is $-156 ($-2k/yr) — negative.
- To cash-flow at today's rent, offer at most $242k (10.2% below list).
- To meet the 1% rule (rent ≥ 1% of price), the offer needs to be $200k (25.9% below list).
- Recommended offer: $200k (25.9% below list) — sets the bar for 1% rule.
- Cap rate 5.6% vs local median 3.6% in Albuquerque — top-decile yield for the area; either an underpriced asset or a hidden risk that comps aren't pricing in. Stress-test before assuming the spread holds.
Location & tenants
- Location reads 72/100 on livability (#13 in NM) — a middle-class / working-renter tenant base. Strengths: amenities A+, commute A+, cost of living A+; Watch: crime F.
- Albuquerque Public Schools (urban): math 51% / reading 75% proficiency, ranked #3 of 29 in NM (top 10%) — acceptable for families but not a draw, mixed tenant base, ~2y average lease; 60% free/reduced lunch — lower-income household profile, screen leases tightly.
- Zoned schools: Collet Park Elementary (316 students, 100% FRL); Grant Middle (344 students, 100% FRL); Nex Gen Academy (math 70% / reading 90%, grade A, #3 of 110 statewide, top 5%, 237 students, 20% FRL).
- Zoned-school proficiency averages 80% at this address vs 63% district-wide (+17 pts) — the actual schools serving this property are materially stronger than the Albuquerque Public Schools average implies; a family-tenant draw the district grade alone would hide.
- Market conditions: Rents soft (-2.1%/yr); 210 active listings in the ZIP; 10 comparable units currently listed for rent nearby; rentals at typical pace (median 23d on market — plan ~3-4 weeks tenant-placement turnaround); 1,316 units permitted in Bernalillo County in 2024 (546 in 5+ unit buildings).
- This rent runs 37% of the median local income ($64k/yr) — at the standard rent-burdened threshold; future hikes will face affordability resistance.
Forward outlook
- Local home prices are declining (-3.0%/yr); year-one equity from $2k of loan paydown is wiped out by about $8k of value loss. Plan a longer hold.
Negotiation context
- It's been on market 18 days — a 2% lower offer ($266k) is reasonable based on typical stale-listing flexibility.
Questions for the listing agent
- What do current leases actually rent for vs. the listed asking? Can we see a recent rent roll and the last 12 months of T-12 income?
- Built in 1972 — when were the roof, HVAC, electrical panel, plumbing, and water heater last replaced?
- Is there a deadline driving the sale (1031 exchange, divorce, estate, relocation)? That informs how much negotiation room exists.
- Schools are D-rated, which usually means shorter tenancies and higher turnover. Who's the typical renter profile here, and what's been the actual vacancy rate?
- Crime grade is F in this area — have there been break-ins, vandalism, or insurance claims at this property in the last 3 years? What carrier currently insures it and at what premium?
- The area grade is low — what's the realistic commute time and amenity access for the typical tenant pool here? Any planned neighborhood developments (good or bad) we should know about?
- What's the average days-on-market for RENTAL listings here right now (not sales)? A rising rental-DOM trend means longer vacancies and softer asking-rent achievability than the comps imply.
- What's the recent tenant-quality profile in this submarket — average credit score on applications, eviction rate, late-payment / NSF rate, and stable-employment percentage? A property-management company in the area should have these aggregated.
- How much new for-sale + rental construction is in the pipeline within 1–3 miles? Heavy new supply typically softens prices + rents 12–24 months out; constrained supply supports both.
Investment metrics
- 1% rule
- 0.74% ✗
- Cap rate
- 5.60%
- Cash-on-cash
- -2.48%
- DSCR
- 0.89
- GRM
- 11.2
CMA / ARV
- ARV (median comp)
- $356,152
- List price
- $270,000
- Delta
- -24.19%
- Verdict
- UNDERPRICED
- Comps
- 20 within 1.0 mi
Show comp detail 12 sales within ~0.75 mi
| Address | Dist | Beds/Ba | Sqft | Sold | Price | $/sf | Match |
|---|---|---|---|---|---|---|---|
| 916 Turner Dr NE | 0.26mi | 3/2.0 (-1) | 1,509 (+0%) | 4mo | $345,000 | $229 | 80 |
| 13916 Paseo Vis NE | 0.27mi | 4/2.0 | 1,665 (+11%) | 2mo | $370,000 | $222 | 68 |
| 14343 Camino Del Rey NE | 0.26mi | 3/2.0 (-1) | 1,374 (-9%) | 1mo | $375,000 | $273 | 68 |
| 14220 La Cueva Ave NE | 0.21mi | 3/2.0 (-1) | 1,673 (+11%) | 2mo | $365,000 | $218 | 65 |
| 14205 Marquette Dr NE | 0.38mi | 3/1.5 (-1) | 1,600 (+6%) | 2mo | $375,000 | $234 | 63 |
| 1012 Oro Real NE | 0.38mi | 3/2.0 (-1) | 1,372 (-9%) | 2mo | $415,000 | $302 | 61 |
| 198 Monte Alto Pl NE | 0.59mi | 3/2.0 (-1) | 1,453 (-4%) | 1mo | $340,000 | $234 | 61 |
| 1111 Granada Hills Ct NE | 0.52mi | 3/2.0 (-1) | 1,392 (-8%) | 3mo | $334,900 | $241 | 55 |
| 1124 Monte Alto Ct NE | 0.52mi | 3/2.0 (-1) | 1,357 (-10%) | 3mo | $335,000 | $247 | 52 |
| 1037 Lawrence Dr NE | 0.45mi | 3/2.0 (-1) | 1,715 (+14%) | 1mo | $445,000 | $259 | 50 |
| 13406 Canyonview Pl NE | 0.60mi | 3/2.0 (-1) | 1,700 (+13%) | 1mo | $285,000 | $168 | 45 |
| 1225 Willys Knight Dr NE | 0.73mi | 3/2.0 (-1) | 1,304 (-13%) | 4mo | $270,000 | $207 | 36 |
Match score weights: distance 35% · size 25% · config 20% · recency 20%. Top-matched comps best support the ARV.
Projected returns pro-forma
-3.0% appreciation · 0.0% rent growth · sell at horizon
- IRR
- -23.6%
- Equity multiple
- 0.21×
- Total profit
- $-59,600
- Equity at exit
- $40,258
- IRR
- -28.5%
- Equity multiple
- -0.16×
- Total profit
- $-87,560
- Equity at exit
- $23,345
Cash invested: $75,600 (down + closing). Projections, not guarantees.
Landlord ↔ Tenant lean methodology
- Overall (STATE)
- 55 Moderately Landlord-Leaning
- State New Mexico
- 55 Moderately Landlord-Leaning · D+3
- County
- — inherits STATE
- City
- — inherits STATE
ZIP-level market 87123
- Rents YoY
- -2.1%
- Active inventory
- 210
- Price-to-rent
- 11.2×
Monthly cashflow live
- Estimated rent
- $2,002 high interval (Pro) →
- Mortgage (P&I)
- −$1,416
- Tax from tax record
- −$209 /mo · $2,509/yr
- Insurance
- −$112
- HOA
- −$0
- Vacancy / Maint / Mgmt
- −$420
- Net cashflow
- $-156
Break-even live
Sensitivity live
| Price | -10% $-3 | -5% $-80 | +0% $-156 | +5% $-232 | +10% $-309 |
|---|---|---|---|---|---|
| Rent | -10% $-314 | -5% $-235 | +0% $-156 | +5% $-77 | +10% $2 |
| Rate | -1.0pp $-20 | -0.5pp $-87 | base $-156 | +0.5pp $-226 | +1.0pp $-297 |
UW: 25.0% down · 7.5% · 30yr · 1.5% tax · 5.0% vac · 8.0% maint · 8.0% mgmt
Financing live
Cash to close
- Down payment
- $67,500
- Closing costs
- $8,100
- Reserves months
- —
- Total cash needed
- —
Loan-product check · same deal, 3 products live
Conventional
25% down · 7.5% · 30yr
- Down + closing
- —
- Monthly P&I
- —
- Monthly cashflow
- —
- DSCR
- —
- Eligible?
- —
Personal DTI + credit; lowest rate.
DSCR
20% down · 8.5% · 30yr
- Down + closing
- —
- Monthly P&I
- —
- Monthly cashflow
- —
- DSCR
- —
- Eligible?
- —
No personal income docs; deal must DSCR.
Hard money
10% down · 12.0% · 12mo
- Down + closing
- —
- Monthly P&I
- —
- Monthly cashflow
- —
- DSCR
- —
- Eligible?
- —
Short-term bridge; refi at stabilization.
Rent comps 10 comps
| Address | Beds | Baths | Sqft | Rent | $/sqft | DOM | Units | Dist |
|---|---|---|---|---|---|---|---|---|
| 1115 Hupmobile Dr NE Albuquerque, NM | 3.0 | 2.0 | 1950 | $2,400 | $1.23 | 45d | 1 | 0.46mi |
| 557 Tramway Blvd NE Albuquerque, NM | 1.0–3.0 | 1.0–2.0 | 891 | $1,405 | $1.58 | 5d | 9 | 0.47mi |
| 13412 Turquoise Ave NE Albuquerque, NM | 3.0 | 2.0 | 1425 | $1,900 | $1.33 | 25d | 1 | 0.57mi |
| 13615 Shaffer Ct SE Albuquerque, NM | 3.0 | 3.0 | 1341 | $2,700 | $2.01 | 5d | 1 | 0.88mi |
| 905 La Charles Dr NE Albuquerque, NM | 3.0 | 2.0 | 1473 | $2,650 | $1.80 | 45d | 1 | 1.06mi |
| 12509 Nambe Ave NE Albuquerque, NM | 3.0 | 1.5 | 1272 | $1,800 | $1.42 | 25d | 1 | 1.07mi |
| 7801 Marble Ave NE Albuquerque, NM | 2.0–3.0 | 1.5–2.5 | 1148 | $1,565 | $1.36 | 23d | 1 | 1.08mi |
| 12021 Skyline Rd NE Albuquerque, NM | 1.0–3.0 | 1.0–2.0 | 875 | $1,592 | $1.82 | 5d | 17 | 1.27mi |
| 521 Nathan St SE Albuquerque, NM | 3.0 | 2.0 | 1060 | $1,895 | $1.79 | 21d | 1 | 1.29mi |
| 12004 Zia Rd NE Albuquerque, NM | 2.0–3.0 | 1.5–2.0 | 1323 | $2,145 | $1.62 | 4d | 7 | 1.30mi |
Listing history 16 events
-
2026-06-22days on market $270,000 Active 18 DOM
-
2026-06-18days on market $270,000 Active 15 DOM
-
2026-06-17days on market $270,000 Active 14 DOM
-
2026-06-16days on market $270,000 Active 13 DOM
-
2026-06-15days on market $270,000 Active 12 DOM
-
2026-06-13days on market $270,000 Active 10 DOM
-
2026-06-10days on market $270,000 Active 7 DOM
-
2026-06-09days on market $270,000 Active 6 DOM
-
2026-06-08days on market $270,000 Active 5 DOM
-
2026-06-07days on market $270,000 Active 4 DOM
-
2026-06-05remarks 697-char remark
-
2026-06-05days on market $270,000 Active 1 DOM
-
2026-05-14status Active 695-char remark
-
2026-02-28status Pending 695-char remark
-
2026-01-31$270,000 Active 695-char remark
-
2003-05-15soldstatus
ⓘ Source: listings_history table (triggers on properties + properties_extension) + one-shot
backfill from property_details.listing_events for pre-trigger history.
Tax reassessment forecast NM · Resets to sale price
- Current annual tax
- $2,509 · $209/mo
- Projected year-2 tax
- $2,509 · $209/mo
- Expected delta
- $0/yr ($0/mo · 0.0%)
ⓘ Screening estimate from a state-policy table — verify with the county assessor before closing.
Climate risk First Street
- Flood 1/10 Low FEMA zone X (unshaded) · 0% chance over 30 yrs
- Wildfire 4/10 Moderate
- Heat 4/10 Moderate 4 d/yr ≥91°F today · 11 d/yr by 30 yrs out
- Wind 1/10 Low
- Air quality 1/10 Low 0 unhealthy d/yr today · 0 by 30 yrs out
Nearby sold comps map
Loading sold comps map…
Walkable amenities ~0.75 mi
Loading nearby amenities…
Taxation est. · year 1
- Rental income
- $24,024
- − Mortgage interest
- −$15,124
- − Property taxes
- −$2,509
- − Insurance
- −$1,350
- − Repairs & maintenance
- −$1,922
- − Management
- −$1,922
- − Depreciation
- −$7,855
- Taxable loss
- −$6,658
- Est. tax savings @ 24.0%
- +$1,598
- After-tax cash flow
- $-274/yr
For passive investors: Depreciation is non-cash, so a rental often shows a tax loss while cash-flowing — sheltering income. Rental losses are passive: they offset passive income freely, and up to $25,000/yr can offset ordinary (W-2) income if you actively participate and your MAGI is under $100k (phasing out to $0 by $150k); unused losses carry forward. On sale, claimed depreciation is recaptured at up to 25%, and gains may owe capital-gains tax (a 1031 exchange can defer both). Figures are a year-1 estimate at your 24.0% rate — not tax advice; consult a CPA.
Schools (NCES district)
- District
- Albuquerque Public Schools
- NCES district ID
- 3500060
- Math proficiency
- 51% ▲ 30.00%
- Reading proficiency
- 75% ▲ 45.00%
- Median HH income
- $48,151
- Composite
- 53.29/100
- National rank
- #1487
- State rank
- #3 of 29 in NM
Livability — Albuquerque
- Score
- 72/100
- State rank
- #13
- US rank
- #6219
Category grades
Schools grade is shown separately in the Schools card above.
Census & demographics
- Census place
- Albuquerque, NM
- County
- Bernalillo County · 647,165 people
- City population
- 647,165
- Metro
- Albuquerque, NM
- Population (ZIP)
- 42,252
- Household income
- $64,359
- Rent vs Own
- Severe rent burden
- 1657.0
Population outlook (Bernalillo County) Hauer SSP2
- Today (2025)
- 704,528 people
- By 2030
- 711,723 · +1.0%
- By 2040
- 714,522 · +1.4%
- By 2050
- 709,274 · +0.7%
- By 2075
- 680,015 · -3.5%
- By 2100
- 619,879 · -12.0%
Race, ethnicity, and origin ACS 2023
- Neighborhood character
- Diverse neighborhood (Simpson 0.64)
- Race & ethnicity
- Hispanic / Latino 44% White 40% Two or more races 18% Native American 6% Asian 5% Black 2%
- Hispanic origin (detail)
- Mexican 28%
- Common ancestry
- Italian 2% Romanian 2% Lithuanian 1%
- Foreign-born
- 12% · Canada, Vietnam
- Languages at home
- 71% English-only · Spanish 22% Vietnamese 2%
Political lean MEDSL · Bernalillo
- 2024 margin
- Strong D (+21.0) · D 59.2% · R 38.2% · Other 2.6%
- 2008→2024 swing
- -0.3pp no change · 2008: 21.4pp · 2024: 21.0pp
- All cycles
- 2024: D+21.0 2020: D+24.4 2016: D+17.8 2012: D+16.2 2008: D+21.4
Not yet ingested
- Civics
- —
Market trends
- HPI YoY
- ▼ -231.76%
- Current HPI
- 233.3553
- Rent YoY
- ▼ -2.10%
- Metro
- Albuquerque, NM
- State GDP YoY
- —
- F500 in state
- 0
Price history
2 events — show timeline
- 2026-05-27 Listed $270,000 Southwest MLS
- 2003-05-15 Sold (Public Records) — Public Records
Property tax history
+2.8%/yrLatest (2025): $2,509 · +3.3% YoY. Source: county tax records.
Cash-flow waterfall
monthlySold comps — $/sqft
last 12 mo · ≤1 miLoading sold comps…