217 S Fifth St · Victor, CO
Flood risk No data
- FEMA flood zone
- —
- Chance of flooding over 30 yrs
- %
- Est. flood insurance / yr
- —
Fire risk No data
- Est. fire insurance / yr
- —
Heat risk No data
- Hot days now (above °F)
- days/yr
- Hot days in 30 yrs
- days/yr
Wind risk No data
- Chance of severe wind over 30 yrs
- %
Air-quality risk No data
- Unhealthy air days now
- days/yr
- Unhealthy air days in 30 yrs
- days/yr
Risk factors via First Street. Map © Google.
Why this score? — see what drove the D+ grade
The composite is a weighted blend of 9 inputs, each scored 0–100. Each bar is that input's sub-score; the figure is the points it added to the 100-point composite (weight × sub-score).
- ARV discount +15.0/15.0
- Cash flow +11.9/30.0
- Appreciation +5.9/10.0
- DSCR +3.5/10.0
- 1% rule +3.4/10.0
- Livability +2.9/5.0
- Rent growth +2.5/5.0
- Condition / age +2.5/5.0
- Schools +1.9/10.0
$169,000
🖨 Deal sheet 📄 Offer letter ✓ Due diligence
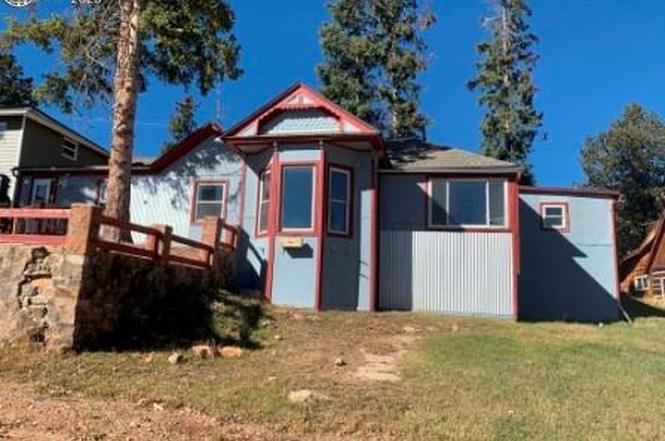
Listing remarks
What a great property in the historic community of Victor. This home features great space for you to spread out and enjoy on one of the larger lots in this area. The back yard, gently rolling offers a great patio space for entertaining and conversation, mature shade trees and natural grass landscaping along with a loafing style shed. Spacious home depicts all the character of days gone by with the brick fireplace showcased in the living room and the bonus room that highlights a bar with vintage hanging lights and a heavy oak Bar-top. Large bay windows in the living room make for sunny afternoons and great views of the community and the mountains. Wood stove here and the pellet stove in the
Key facts
- Historic community
- Loafing style shed
- Larger lots
Tags
Neighborhood map
What this means for you Summary
Snapshot
- This is a 3-bed/2.0-bath single-family listed at $169k.
Deal economics
- At list price, monthly cash flow is $-42 ($-507/yr) — negative.
- To cash-flow at today's rent, offer at most $163k (3.6% below list).
- To meet the 1% rule (rent ≥ 1% of price), the offer needs to be $142k (15.7% below list).
- Recommended offer: $142k (15.7% below list) — sets the bar for 1% rule.
Location & tenants
- Location reads 57/100 on livability (#314 in CO) — a working-class tenant base; expect higher turnover. Strengths: cost of living A+, housing A+; Watch: employment C-, health & safety C-, schools F.
- Cripple Creek-Victor School District No. Re-1 (rural): math 10% / reading 25% proficiency, ranked #157 of 176 in CO (top 89%) — low school quality limits family demand, transient renter base, plan for 1-2y turnover.
- Market conditions: 20 active listings in the ZIP; 148 units permitted in Teller County in 2024 (0 in 5+ unit buildings).
Forward outlook
- In year one you build about $4k of equity ($1k loan paydown + $3k appreciation (1.7% local appreciation)).
- Teller County population projected at -22% by 2050 — secular population decline; favor cash flow + early exit over multi-decade hold.
- At projected returns (1.7% appreciation + 3.0% rent growth), your $47k cash investment doubles in ~9 years — after that, you're playing with house money.
- By year 8, paydown + projected appreciation supports a ~$31k cash-out refi (75% LTV) — recoverable capital for the next deal without selling this one.
Negotiation context
- It's been on market 99 days — a 9% lower offer ($154k) is reasonable based on typical stale-listing flexibility.
Risks & watch-outs
- Watch-outs: built in 1900 — expect roof / HVAC / electrical / plumbing capex.
Questions for the listing agent
- What do current leases actually rent for vs. the listed asking? Can we see a recent rent roll and the last 12 months of T-12 income?
- It's been on market 99 days. Have you received any prior offers? Is the seller open to a 16% concession, seller financing, or rate buy-down credit?
- Built in 1900 — when were the roof, HVAC, electrical panel, plumbing, and water heater last replaced?
- Why hasn't it sold? Are there any deal-killer items the seller is aware of (foundation, flood, title, zoning, code violations)?
- Is there a deadline driving the sale (1031 exchange, divorce, estate, relocation)? That informs how much negotiation room exists.
- Schools are F-rated, which usually means shorter tenancies and higher turnover. Who's the typical renter profile here, and what's been the actual vacancy rate?
- Crime grade is F in this area — have there been break-ins, vandalism, or insurance claims at this property in the last 3 years? What carrier currently insures it and at what premium?
- The area grade is low — what's the realistic commute time and amenity access for the typical tenant pool here? Any planned neighborhood developments (good or bad) we should know about?
- What's the average days-on-market for RENTAL listings here right now (not sales)? A rising rental-DOM trend means longer vacancies and softer asking-rent achievability than the comps imply.
- What's the recent tenant-quality profile in this submarket — average credit score on applications, eviction rate, late-payment / NSF rate, and stable-employment percentage? A property-management company in the area should have these aggregated.
- How much new for-sale + rental construction is in the pipeline within 1–3 miles? Heavy new supply typically softens prices + rents 12–24 months out; constrained supply supports both.
Investment metrics
- 1% rule
- 0.84% ✗
- Cap rate
- 5.99%
- Cash-on-cash
- -1.07%
- DSCR
- 0.95
- GRM
- 9.9
CMA / ARV
- ARV (on-the-fly)
- $330,506
- Comps found
- 3
Show comp detail 3 sales within ~0.75 mi
| Address | Dist | Beds/Ba | Sqft | Sold | Price | $/sf | Match |
|---|---|---|---|---|---|---|---|
| 221 S 5th St | 0.02mi | 3/2.0 | 1,952 (-2%) | 18mo | $325,000 | $166 | 81 |
| 206 N 4th St | 0.25mi | 2/2.0 (-1) | 1,836 (-8%) | 8mo | $215,000 | $117 | 64 |
| 507 Portland Ave | 0.05mi | 4/5.0 (+1) | 2,144 (+8%) | 20mo | $430,000 | $201 | 52 |
Match score weights: distance 35% · size 25% · config 20% · recency 20%. Top-matched comps best support the ARV.
Projected returns pro-forma
1.71% appreciation · 3.0% rent growth · sell at horizon
- IRR
- 2.6%
- Equity multiple
- 1.14×
- Total profit
- $6,486
- Equity at exit
- $64,069
- IRR
- 6.7%
- Equity multiple
- 1.88×
- Total profit
- $41,614
- Equity at exit
- $90,311
Cash invested: $47,320 (down + closing). Projections, not guarantees.
Landlord ↔ Tenant lean methodology
- Overall (STATE)
- 38 Tenant-Leaning
- State Colorado
- 38 Tenant-Leaning · D+4
- County
- — inherits STATE
- City
- — inherits STATE
ZIP-level market 80860
- Home prices YoY
- 0.5%
- Active inventory
- 20
- Price-to-rent
- 9.9×
Monthly cashflow live
- Estimated rent
- $1,425 medium interval (Pro) →
- Mortgage (P&I)
- −$886
- Tax est. 1.5%
- −$211 /mo · $2,535/yr
- Insurance
- −$70
- HOA
- −$0
- Vacancy / Maint / Mgmt
- −$299
- Net cashflow
- $-42
Break-even live
UW: 25.0% down · 7.5% · 30yr · 1.5% tax · 5.0% vac · 8.0% maint · 8.0% mgmt
Financing live
Cash to close
- Down payment
- $42,250
- Closing costs
- $5,070
- Reserves months
- —
- Total cash needed
- —
Loan-product check · same deal, 3 products live
Conventional
25% down · 7.5% · 30yr
- Down + closing
- —
- Monthly P&I
- —
- Monthly cashflow
- —
- DSCR
- —
- Eligible?
- —
Personal DTI + credit; lowest rate.
DSCR
20% down · 8.5% · 30yr
- Down + closing
- —
- Monthly P&I
- —
- Monthly cashflow
- —
- DSCR
- —
- Eligible?
- —
No personal income docs; deal must DSCR.
Hard money
10% down · 12.0% · 12mo
- Down + closing
- —
- Monthly P&I
- —
- Monthly cashflow
- —
- DSCR
- —
- Eligible?
- —
Short-term bridge; refi at stabilization.
Listing history 2 events
-
2026-06-19remarks 699-char remark
-
2026-06-19$169,000 Active 99 DOM
ⓘ Source: listings_history table (triggers on properties + properties_extension) + one-shot
backfill from property_details.listing_events for pre-trigger history.
Nearby sold comps map
Loading sold comps map…
Walkable amenities ~0.75 mi
Loading nearby amenities…
Taxation est. · year 1
- Rental income
- $17,099
- − Mortgage interest
- −$9,467
- − Property taxes
- −$2,535
- − Insurance
- −$845
- − Repairs & maintenance
- −$1,368
- − Management
- −$1,368
- − Depreciation
- −$4,916
- Taxable loss
- −$3,399
- Est. tax savings @ 24.0%
- +$816
- After-tax cash flow
- $309/yr
For passive investors: Depreciation is non-cash, so a rental often shows a tax loss while cash-flowing — sheltering income. Rental losses are passive: they offset passive income freely, and up to $25,000/yr can offset ordinary (W-2) income if you actively participate and your MAGI is under $100k (phasing out to $0 by $150k); unused losses carry forward. On sale, claimed depreciation is recaptured at up to 25%, and gains may owe capital-gains tax (a 1031 exchange can defer both). Figures are a year-1 estimate at your 24.0% rate — not tax advice; consult a CPA.
Schools (NCES district)
- District
- Cripple Creek-Victor School District No. Re-1
- NCES district ID
- 0803180
- Math proficiency
- 10% ▼ -5.00%
- Reading proficiency
- 25% ▼ -5.00%
- Median HH income
- $48,346
- Composite
- 19.0/100
- National rank
- #13980
- State rank
- #157 of 176 in CO
Livability — Victor
- Score
- 57/100
- State rank
- #314
- US rank
- #22097
Category grades
Schools grade is shown separately in the Schools card above.
Census & demographics
- Census place
- Victor, CO
- Population (ZIP)
- 589
Population outlook (Teller County) Hauer SSP2
- Today (2025)
- 22,404 people
- By 2030
- 21,527 · -3.9%
- By 2040
- 19,356 · -13.6%
- By 2050
- 17,462 · -22.1%
- By 2075
- 14,658 · -34.6%
- By 2100
- 11,982 · -46.5%
Race, ethnicity, and origin ACS 2023
- Neighborhood character
- Predominantly White (84%)
- Race & ethnicity
- White 84% Two or more races 8% Hispanic / Latino 7%
- Hispanic origin (detail)
- Mexican 6%
- Common ancestry
- Serbian 10% Italian 7% Slovak 3%
- Foreign-born
- 2%
- Languages at home
- 99% English-only · Other Indo-European 1%
Political lean MEDSL · Teller
- 2024 margin
- Solid R (+35.5) · D 31.0% · R 66.5% · Other 2.5%
- 2008→2024 swing
- -7.3pp toward R · 2008: -28.1pp · 2024: -35.5pp
- All cycles
- 2024: R+35.5 2020: R+35.2 2016: R+42.5 2012: R+33.1 2008: R+28.1
Not yet ingested
- Civics
- —
Market trends
- HPI YoY
- ▲ 1.71%
- Current HPI
- 374.4597
- Rent YoY
- —
- Metro
- —
- State GDP YoY
- ▲ 1.95%
- F500 in state
- 14
Industry mix (Fortune 500 HQ in CO)
| Industry | F500 HQs | Revenue |
|---|---|---|
| Technology Distribution | 1 | $31B |
|
||
| Food / Agriculture | 1 | $18B |
|
||
| Packaging | 1 | $14B |
|
||
| Healthcare | 1 | $13B |
|
||
| Energy | 1 | $10B |
|
||
| Technology | 1 | $4B |
|
||
Cash-flow waterfall
monthlySold comps — $/sqft
last 12 mo · ≤1 miLoading sold comps…