22 Comares Ave #5B · St. Augustine, FL
Flood risk 9/10 · Severe
- FEMA flood zone
- AE
- Chance of flooding over 30 yrs
- 0.99%
- Est. flood insurance / yr
- $1,737 – $8,500
Fire risk 4/10 · Minor
- Est. fire insurance / yr
- $947 – $1,759
Heat risk 10/10 · Severe
- Hot days now (above 106°F)
- 7 days/yr
- Hot days in 30 yrs
- 22 days/yr
Wind risk 10/10 · Severe
- Chance of severe wind over 30 yrs
- 99.0%
Air-quality risk 3/10 · Minor
- Unhealthy air days now
- 3 days/yr
- Unhealthy air days in 30 yrs
- 3 days/yr
Risk factors via First Street. Map © Google.
Why this score? — see what drove the D- grade
The composite is a weighted blend of 9 inputs, each scored 0–100. Each bar is that input's sub-score; the figure is the points it added to the 100-point composite (weight × sub-score).
- Cash flow +8.2/30.0
- ARV discount +7.5/15.0
- Schools +6.4/10.0
- 1% rule +5.9/10.0
- Livability +2.5/5.0
- Condition / age +2.5/5.0
- Rent growth +2.3/5.0
- DSCR +2.2/10.0
- Appreciation +0.0/10.0
$225,000
🖨 Deal sheet 📄 Offer letter ✓ Due diligence
Listing remarks MLS
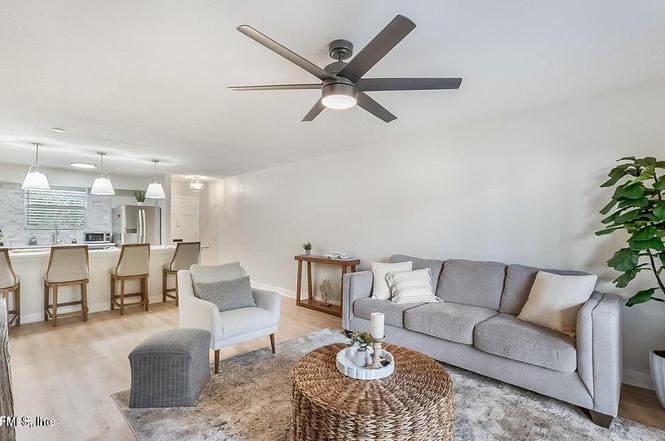
Experience coastal living at 22 Comares Ave, Unit 5B. Located on beautiful Anastasia Island, this fully remodeled condo puts you exactly where you want to be--just moments from the historic charm of downtown St. Augustine and the Atlantic shore. The interior features a sleek, modern kitchen, fresh flooring, and bright finishes that make the space feel both airy and polished. Whether you are looking for a vacation retreat, a full-time home, or a property to host guests, the layout is designed for ease and low-maintenance living. You'll be within reach of local boutiques, excellent dining, and all the character that makes the First Coast so special. Best of all, this property is short-term rental approved, making it a versatile choice for investors. It is rare to find a home that is truly move-in ready and this well-positioned. Schedule your private tour to see how this space fits into your future plans.
Key facts
- Pristine flooring
- Move in ready
- Ideally situated
Tags
Property features AI
Finance
- HOA & community: Homeowners association with a $500 monthly fee; Not a senior community
Exterior
- Parking: Parking lot
- Utilities: Public sewer; Electricity connected; Water connected; Cable available
- Home design: Condominium; One level entry; Single-story
- Exterior features: No private pool; Public sewer; Cable available; electricity, water and sewer connected
Interior
- Kitchen: Dishwasher; Electric cooktop; Microwave; Refrigerator
- Bedrooms: 2 bedrooms (one listed as Bedroom 2)
- Bathrooms: 1 full bathroom; 1 half bathroom
- Heating & cooling: Central heating; Central air conditioning
- Interior features: Eat-in kitchen; Open floor plan; 3 total rooms
Neighborhood map
What this means for you Summary
Snapshot
- This is a 2-bed/1.5-bath condo listed at $225k.
Deal economics
- At list price, monthly cash flow is $-636 ($-8k/yr) — negative.
- To cash-flow at today's rent, offer at most $113k (50.0% below list).
- Meets the 1% rule at list price ($2k rent vs $225k).
- Recommended offer: $113k (50.0% below list) — sets the bar for cash-flow.
- Cap rate 5.2% vs local median 3.1% in St. Augustine — top-decile yield for the area; either an underpriced asset or a hidden risk that comps aren't pricing in. Stress-test before assuming the spread holds.
Location & tenants
- Location reads: area grade D — affects rentability + tenant quality, not the cash-flow math above.
- St. Johns (rural): math 75% / reading 73% proficiency, ranked #2 of 73 in FL (top 3%) — strong family-tenant draw, lease renewals of 3-5y typical; only 20% free/reduced lunch — higher-income household profile.
- Zoned schools: Sebastian Middle School (math 59% / reading 59%, grade B, #144 of 571 statewide, top 26%, 654 students, 42% FRL); St. Augustine High School (math 54% / reading 62%, grade C, #120 of 667 statewide, top 18%, 1,784 students, 38% FRL) — zoned schools average 40% FRL vs 20% district-wide (20 pts higher); higher-poverty schools than district average — tighter screening recommended.
- Zoned-school proficiency averages 58% at this address vs 74% district-wide (-16 pts) — the specific schools serving this property underperform the St. Johns average; the district grade overstates school quality for this exact location.
- Market conditions: Rents soft (-1.0%/yr); 534 active listings in the ZIP; 20 comparable units currently listed for rent nearby; rentals leasing fast (median 7d on market — plan ~1-2 weeks tenant-placement turnaround); solid renter incomes; 5,575 units permitted in St. Johns County in 2024 (584 in 5+ unit buildings).
Forward outlook
- Local home prices are declining (-3.0%/yr); year-one equity from $2k of loan paydown is wiped out by about $7k of value loss. Plan a longer hold.
- St. Johns County population projected at +60% by 2050 — long-run rental-demand tailwind backs the buy-and-hold thesis.
Negotiation context
- Only 1 days on market — expect competitive offers; lowballing is unlikely to land.
- 4 sale attempts since 3y ago with the ask held roughly flat each time — persistent listings suggest the price (not the market) is what's stuck; bring a comps-based counter.
- Current owner paid $195k; 15% above their basis — modest negotiation headroom, anchor on the comps not their cost.
Risks & watch-outs
- Watch-outs: flood insurance adds $427/mo; HOA is 20% of rent.
- Climate carrying-cost: in FEMA flood zone AE (mandatory federal flood insurance); severe wind risk, 99% chance of damaging wind over 30y; extreme-heat days projected 7→22/yr by 2055 (HVAC capex compounding) — expect insurance premiums to compound above CPI over the hold.
Questions for the listing agent
- What do current leases actually rent for vs. the listed asking? Can we see a recent rent roll and the last 12 months of T-12 income?
- Built in 1966 — when were the roof, HVAC, electrical panel, plumbing, and water heater last replaced?
- What's the actual annual flood-insurance premium (NFIP or private), and is the property in a SFHA with mandatory coverage?
- What does the HOA fee cover, when was the last increase, and are there any pending special assessments or reserve-fund shortfalls?
- Any open or pending special assessments — roof, HVAC, plumbing, elevator, façade? What's the per-unit balance and payoff schedule, and is the seller paying it off at close or rolling it to the buyer?
- Is there a deadline driving the sale (1031 exchange, divorce, estate, relocation)? That informs how much negotiation room exists.
- The area grade is low — what's the realistic commute time and amenity access for the typical tenant pool here? Any planned neighborhood developments (good or bad) we should know about?
- What's the average days-on-market for RENTAL listings here right now (not sales)? A rising rental-DOM trend means longer vacancies and softer asking-rent achievability than the comps imply.
- What's the recent tenant-quality profile in this submarket — average credit score on applications, eviction rate, late-payment / NSF rate, and stable-employment percentage? A property-management company in the area should have these aggregated.
- How much new apartment / multifamily construction is in the pipeline within 1–3 miles? Heavy new supply (>2% of stock underway) typically softens rents 12–24 months out; light construction supports rent growth.
Investment metrics
- 1% rule
- 1.09% ✓
- Cap rate
- 5.17%
- Cash-on-cash
- -4.00%
- DSCR
- 0.82
- GRM
- 7.7
CMA / ARV
No comps found within radius.
Projected returns pro-forma
-3.0% appreciation · 0.0% rent growth · sell at horizon
- IRR
- -45.2%
- Equity multiple
- -0.33×
- Total profit
- $-83,507
- Equity at exit
- $33,548
- IRR
- —
- Equity multiple
- -1.38×
- Total profit
- $-149,939
- Equity at exit
- $19,454
Cash invested: $63,000 (down + closing). Projections, not guarantees.
Landlord ↔ Tenant lean methodology
- Overall (STATE)
- 87 Strongly Landlord-Friendly
- State Florida
- 87 Strongly Landlord-Friendly · R+3
- County
- — inherits STATE
- City
- — inherits STATE
ZIP-level market 32080
- Rents YoY
- -1.0%
- Active inventory
- 534
- Price-to-rent
- 7.7×
Monthly cashflow live
- Estimated rent
- $2,446 high interval (Pro) →
- Mortgage (P&I)
- −$1,180
- Tax from tax record
- −$369 /mo · $4,425/yr
- Insurance
- −$94
- Flood insurance flood zone
- −$427 /mo · $5,118/yr
- HOA
- −$500
- Vacancy / Maint / Mgmt
- −$514
- Net cashflow
- $-636
Break-even live
UW: 25.0% down · 7.5% · 30yr · 1.5% tax · 5.0% vac · 8.0% maint · 8.0% mgmt
Financing live
Cash to close
- Down payment
- $56,250
- Closing costs
- $6,750
- Reserves months
- —
- Total cash needed
- —
Loan-product check · same deal, 3 products live
Conventional
25% down · 7.5% · 30yr
- Down + closing
- —
- Monthly P&I
- —
- Monthly cashflow
- —
- DSCR
- —
- Eligible?
- —
Personal DTI + credit; lowest rate.
DSCR
20% down · 8.5% · 30yr
- Down + closing
- —
- Monthly P&I
- —
- Monthly cashflow
- —
- DSCR
- —
- Eligible?
- —
No personal income docs; deal must DSCR.
Hard money
10% down · 12.0% · 12mo
- Down + closing
- —
- Monthly P&I
- —
- Monthly cashflow
- —
- DSCR
- —
- Eligible?
- —
Short-term bridge; refi at stabilization.
Rent comps 20 comps
| Address | Beds | Baths | Sqft | Rent | $/sqft | DOM | Units | Dist |
|---|---|---|---|---|---|---|---|---|
| 405 Flagler Blvd Saint Augustine, FL | 1.0 | 1.0 | 644 | $1,475 | $2.29 | 16d | 1 | 0.13mi |
| 405 Flagler Blvd Unit 1281915P St. Augustine, FL | 2.0 | 1.0 | 990 | $2,770 | $2.80 | 7d | 1 | 0.13mi |
| 83 Comares Ave Unit 4B Saint Augustine, FL | 2.0 | 1.5 | 1006 | $2,500 | $2.49 | 23d | 1 | 0.30mi |
| 30 Magnolia Dr Unit 1281924P St. Augustine, FL | 3.0 | 2.0 | 990 | $3,722 | $3.76 | 7d | 1 | 0.33mi |
| 251 Charlotte St Unit A St. Augustine, FL | 2.0 | 1.0 | 746 | $2,500 | $3.35 | 23d | 1 | 0.94mi |
| 251 Charlotte St Unit B St. Augustine, FL | 2.0 | 1.0 | 746 | $2,900 | $3.89 | 23d | 1 | 0.94mi |
| 11 Aviles St Unit 2B St. Augustine, FL | 2.0 | 1.5 | 777 | $2,500 | $3.22 | 23d | 1 | 0.98mi |
| 260 Saint George St Unit 1 St. Augustine, FL | 1.0 | 1.0 | 550 | $1,495 | $2.72 | 17d | 1 | 1.03mi |
| 260 Saint George St Unit 2 St. Augustine, FL | 1.0 | 1.0 | 750 | $1,599 | $2.13 | 3d | 1 | 1.03mi |
| 46 Saint Francis St Saint Augustine, FL | 2.0 | 2.0 | 999 | $3,000 | $3.00 | 21d | 1 | 1.03mi |
| 90 De Haven St Unit 1281966P St. Augustine, FL | 2.0 | 1.5 | 796 | $5,474 | $6.88 | 2d | 1 | 1.18mi |
| 62 Dumas St Saint Augustine, FL | 3.0 | 2.0 | 1022 | $2,500 | $2.45 | 23d | 1 | 1.21mi |
| 140B Martin Luther King Ave Unit 1281977P St. Augustine, FL | 2.0 | 1.0 | 1097 | $3,427 | $3.12 | 1d | 1 | 1.27mi |
| 123 Moore St Unit 1281961P St. Augustine, FL | 2.0 | 2.0 | 904 | $3,119 | $3.45 | 2d | 1 | 1.32mi |
| 259 Riberia St Unit A St. Augustine, FL | 2.0 | 2.0 | 1115 | $2,600 | $2.33 | 23d | 1 | 1.34mi |
| 36 Weeden St Unit 1281973P St. Augustine, FL | 2.0 | 1.5 | 957 | $3,854 | $4.03 | 7d | 1 | 1.39mi |
| 47 San Marco Ave Unit 1281909P St. Augustine, FL | 1.0 | 1.0 | 592 | $3,990 | $6.74 | 2d | 1 | 1.41mi |
| 72 Abbott St Unit 1281926P St. Augustine, FL | 1.0 | 1.5 | 796 | $3,566 | $4.48 | 1d | 1 | 1.44mi |
| 6 Rohde Ave Unit 1281954P St. Augustine, FL | 1.0–2.0 | 1.0 | 613 | $2,538 | $4.14 | 3d | 2 | 1.47mi |
| 138 Oviedo St Unit A St. Augustine, FL | 2.0 | 1.0 | 995 | $1,695 | $1.70 | 3d | 1 | 1.49mi |
HOA detail condo
- Monthly dues
- $500 · $6,000/yr
- Assessments
- None detected in remarks — confirm with the listing agent.
Listing history 2 events
-
2026-06-17remarks 699-char remark
-
2026-06-17$225,000 Active 1 DOM
ⓘ Source: listings_history table (triggers on properties + properties_extension) + one-shot
backfill from property_details.listing_events for pre-trigger history.
Tax reassessment forecast FL · Resets to sale price
- Current annual tax
- $4,425 · $369/mo
- Projected year-2 tax
- $4,425 · $369/mo
- Expected delta
- $0/yr ($0/mo · 0.0%)
ⓘ Screening estimate from a state-policy table — verify with the county assessor before closing.
Climate risk First Street
- Flood 9/10 Extreme FEMA zone AE · 99% chance over 30 yrs
- Wildfire 4/10 Moderate
- Heat 10/10 Extreme 7 d/yr ≥106°F today · 22 d/yr by 30 yrs out
- Wind 10/10 Extreme 99% chance of damaging wind over 30 yrs
- Air quality 3/10 Moderate 3 unhealthy d/yr today · 3 by 30 yrs out
Nearby sold comps map
Loading sold comps map…
Walkable amenities ~0.75 mi
Loading nearby amenities…
Taxation est. · year 1
- Rental income
- $29,355
- − Mortgage interest
- −$12,603
- − Property taxes
- −$4,425
- − Insurance
- −$6,244
- − Repairs & maintenance
- −$2,348
- − Management
- −$2,348
- − HOA
- −$6,000
- − Depreciation
- −$6,545
- Taxable loss
- −$11,160
- Est. tax savings @ 24.0%
- +$2,678
- After-tax cash flow
- $-4,959/yr
For passive investors: Depreciation is non-cash, so a rental often shows a tax loss while cash-flowing — sheltering income. Rental losses are passive: they offset passive income freely, and up to $25,000/yr can offset ordinary (W-2) income if you actively participate and your MAGI is under $100k (phasing out to $0 by $150k); unused losses carry forward. On sale, claimed depreciation is recaptured at up to 25%, and gains may owe capital-gains tax (a 1031 exchange can defer both). Figures are a year-1 estimate at your 24.0% rate — not tax advice; consult a CPA.
Schools (NCES district)
- District
- St. Johns
- NCES district ID
- 1201740
- Math proficiency
- 75% ▼ -5.00%
- Reading proficiency
- 73% ▼ -2.00%
- Median HH income
- $66,842
- Composite
- 64.31/100
- National rank
- #556
- State rank
- #2 of 73 in FL
Livability — St. Augustine
No livability data for this city. (Only ~50 U.S. cities are tracked.)
Census & demographics
- Census place
- St. Augustine, FL
- County
- Saint Johns County · 301,599 people
- Metro
- Jacksonville, FL
- Population (ZIP)
- 20,894
- Household income
- $92,531
- Rent vs Own
- Severe rent burden
- 417.0
Population outlook (St. Johns County) Hauer SSP2
- Today (2025)
- 303,941 people
- By 2030
- 342,590 · +12.7%
- By 2040
- 417,328 · +37.3%
- By 2050
- 487,011 · +60.2%
- By 2075
- 635,395 · +109.1%
- By 2100
- 717,469 · +136.1%
Race, ethnicity, and origin ACS 2023
- Neighborhood character
- Predominantly White (90%)
- Race & ethnicity
- White 90% Two or more races 5% Hispanic / Latino 4% Asian 2%
- Common ancestry
- Romanian 4% Lithuanian 4% Slovak 3%
- Foreign-born
- 7% · Canada, Jamaica
- Languages at home
- 95% English-only · Spanish 2% Other Indo-European 2% Russian/Polish/Slavic 1%
Political lean MEDSL · St. Johns
- 2024 margin
- Solid R (+31.4) · D 33.9% · R 65.2%
- 2008→2024 swing
- +0.2pp no change · 2008: -31.6pp · 2024: -31.4pp
- All cycles
- 2024: R+31.4 2020: R+26.7 2016: R+33.4 2012: R+37.8 2008: R+31.6
Not yet ingested
- Civics
- —
Market trends
- HPI YoY
- ▼ -560.06%
- Current HPI
- 301.5733
- Rent YoY
- ▼ -0.97%
- Metro
- Jacksonville, FL
- State GDP YoY
- ▲ 3.28%
- F500 in state
- 36
Industry mix (Fortune 500 HQ in FL)
| Industry | F500 HQs | Revenue |
|---|---|---|
| Industrial Technology | 2 | $29B |
|
||
| Insurance | 2 | $17B |
|
||
| Retail | 1 | $60B |
|
||
| Technology Distribution | 1 | $58B |
|
||
| Homebuilding | 1 | $35B |
|
||
| Technology Manufacturing | 1 | $35B |
|
||
Price history
+514.8% since first listed18 events — show timeline
- 2026-06-17 Listed $225,000 realMLS
- 2026-04-29 Listing Removed — realMLS
- 2026-03-09 Price Changed $229,000 realMLS
- 2026-01-27 Price Changed $235,000 realMLS
- 2025-12-30 Price Changed $239,000 realMLS
- 2025-12-08 Listed $247,000 realMLS
- 2024-04-10 Sold (Public Records) $195,000 Public Records
- 2024-04-04 Sold (MLS) $195,000 St. Augustine and St. Johns County Board of REALTORS®
- 2024-04-02 Pending — St. Augustine and St. Johns County Board of REALTORS®
- 2024-03-20 Contingent — St. Augustine and St. Johns County Board of REALTORS®
- 2024-03-07 Listed $225,000 St. Augustine and St. Johns County Board of REALTORS®
- 2024-03-04 Listing Removed — realMLS
- 2023-09-11 Listed $249,000 realMLS
- 2003-05-07 Sold (Public Records) $82,000 Public Records
- 2001-03-05 Sold (Public Records) $72,000 Public Records
- 1996-12-23 Sold (Public Records) $60,800 Public Records
- 1995-03-02 Sold (Public Records) $48,500 Public Records
- 1981-04-01 Sold (Public Records) $36,600 Public Records
Property tax history
+9.9%/yrLatest (2025): $4,425 · +35.3% YoY. Source: county tax records.
Cash-flow waterfall
monthlySold comps — $/sqft
last 12 mo · ≤1 miLoading sold comps…