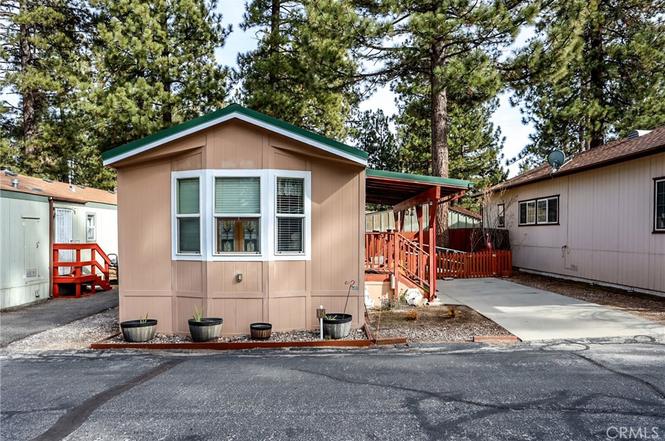
475 Thrush Dr #13 · Big Bear Lake, CA
Flood risk 7/10 · Major
- FEMA flood zone
- X (unshaded)
- Chance of flooding over 30 yrs
- 0.99%
- Est. flood insurance / yr
- $507 – $1,088
Fire risk 7/10 · Major
- Est. fire insurance / yr
- $659 – $1,223
Heat risk 2/10 · Minimal
- Hot days now (above 82°F)
- 10 days/yr
- Hot days in 30 yrs
- 27 days/yr
Wind risk 1/10 · Minimal
- Chance of severe wind over 30 yrs
- —
Air-quality risk 10/10 · Severe
- Unhealthy air days now
- 33 days/yr
- Unhealthy air days in 30 yrs
- 39 days/yr
Risk factors via First Street. Map © Google.
Why this score? — see what drove the B- grade
The composite is a weighted blend of 9 inputs, each scored 0–100. Each bar is that input's sub-score; the figure is the points it added to the 100-point composite (weight × sub-score).
- Cash flow +30.0/30.0
- 1% rule +10.0/10.0
- DSCR +10.0/10.0
- ARV discount +9.0/15.0
- Livability +3.2/5.0
- Schools +2.9/10.0
- Condition / age +2.5/5.0
- Rent growth +1.6/5.0
- Appreciation +0.0/10.0
$56,500
🖨 Deal sheet 📄 Offer letter ✓ Due diligence
Listing remarks MLS
Located in Trails End Mobile Home Park, owner must be 55 or older. Modular home built in 2016. Handicap ramp at back door for easier access. Stackable washer/dryer and newer appliances. Propanel metal roof, no shoveling your roof and last way longer than a regular roof. Fenced back yard and large shed on property. Down the street from the park and lake and centrally located to grocery stores, bus stop and restaurants. Owners and pets must be approved through the park. No rentals. Space rent is $850 per month.
Key facts
- Propanel metal roof
- Fenced back yard
- Centrally located
Tags
Neighborhood map
What this means for you Summary
Snapshot
- This is a 1-bed/1.0-bath manufactured listed at $56k.
Deal economics
- At list price, monthly cash flow is $815 ($10k/yr) — positive.
- The deal already cash-flows at list — no discount required.
- Meets the 1% rule at list price ($2k rent vs $56k).
- Recommended offer: $50k (12.0% below list) — sets the bar for market timing.
- Cap rate 25.0% vs local median 2.4% in Big Bear Lake — top-decile yield for the area; either an underpriced asset or a hidden risk that comps aren't pricing in. Stress-test before assuming the spread holds.
Location & tenants
- Location reads 64/100 on livability (#420 in CA) — a middle-class / working-renter tenant base. Strengths: commute A+; Watch: crime C-, housing C-, health & safety D+.
- Bear Valley Unified (town): math 26% / reading 43% proficiency, ranked #289 of 517 in CA (top 56%) — families likely to look elsewhere, expect single-tenant / working-renter base with shorter leases.
- Market conditions: Rents falling (-3.5%/yr); 528 active listings in the ZIP; 2 comparable units currently listed for rent nearby; solid renter incomes; 5,458 units permitted in San Bernardino County in 2024 (1,500 in 5+ unit buildings).
Forward outlook
- Local home prices are declining (-3.0%/yr); year-one equity from $391 of loan paydown is wiped out by about $2k of value loss. Plan a longer hold.
- San Bernardino County population projected at +15% by 2050 — modest demand growth; plan on rents tracking national, not racing it.
- At projected returns (-3.0% appreciation + 0.0% rent growth), your $16k cash investment doubles in ~2 years — after that, you're playing with house money.
Negotiation context
- It's been on market 122 days — a 12% lower offer ($50k) is reasonable based on typical stale-listing flexibility.
- 7 sale attempts since 6y ago with the ask held roughly flat each time — persistent listings suggest the price (not the market) is what's stuck; bring a comps-based counter.
Risks & watch-outs
- Watch-outs: flood insurance adds $66/mo.
- Climate carrying-cost: major flood risk; major wildfire risk — expect insurance premiums to compound above CPI over the hold.
Questions for the listing agent
- It's been on market 122 days. Have you received any prior offers? Is the seller open to a 12% concession, seller financing, or rate buy-down credit?
- What's the actual annual flood-insurance premium (NFIP or private), and is the property in a SFHA with mandatory coverage?
- Why hasn't it sold? Are there any deal-killer items the seller is aware of (foundation, flood, title, zoning, code violations)?
- Is there a deadline driving the sale (1031 exchange, divorce, estate, relocation)? That informs how much negotiation room exists.
- Schools are D-rated, which usually means shorter tenancies and higher turnover. Who's the typical renter profile here, and what's been the actual vacancy rate?
- What's the average days-on-market for RENTAL listings here right now (not sales)? A rising rental-DOM trend means longer vacancies and softer asking-rent achievability than the comps imply.
- What's the recent tenant-quality profile in this submarket — average credit score on applications, eviction rate, late-payment / NSF rate, and stable-employment percentage? A property-management company in the area should have these aggregated.
- How much new for-sale + rental construction is in the pipeline within 1–3 miles? Heavy new supply typically softens prices + rents 12–24 months out; constrained supply supports both.
Investment metrics
- 1% rule
- 2.76% ✓
- Cap rate
- 25.01%
- Cash-on-cash
- 66.85%
- DSCR
- 3.97
- GRM
- 3.0
CMA / ARV
- ARV (median comp)
- $58,414
- List price
- $56,500
- Delta
- -3.28%
- Verdict
- FAIR
- Comps
- 14 within 1.0 mi
Show comp detail 3 sales within ~0.75 mi
| Address | Dist | Beds/Ba | Sqft | Sold | Price | $/sf | Match |
|---|---|---|---|---|---|---|---|
| 475 Thrush Dr #13 | 0.00mi | 1/1.0 | 627 (0%) | 0mo | $47,000 | $75 | 100 |
| 475 Thrush #56 | 0.04mi | 2/1.0 (+1) | 650 (+4%) | 19mo | $50,000 | $77 | 71 |
| 475 Thrush Dr #32 | 0.00mi | 2/1.0 (+1) | 720 (+15%) | 14mo | $50,000 | $69 | 59 |
Match score weights: distance 35% · size 25% · config 20% · recency 20%. Top-matched comps best support the ARV.
Projected returns pro-forma
-3.0% appreciation · 0.0% rent growth · sell at horizon
- IRR
- 57.2%
- Equity multiple
- 3.42×
- Total profit
- $38,214
- Equity at exit
- $8,424
- IRR
- 61.0%
- Equity multiple
- 6.22×
- Total profit
- $82,610
- Equity at exit
- $4,885
Cash invested: $15,820 (down + closing). Projections, not guarantees.
Landlord ↔ Tenant lean methodology
- Overall (STATE)
- 18 Strongly Tenant-Friendly
- State California
- 18 Strongly Tenant-Friendly · D+13
- County
- — inherits STATE
- City
- — inherits STATE
ZIP-level market 92315
- Rents YoY
- -3.5%
- Active inventory
- 528
- Price-to-rent
- 3.0×
Monthly cashflow live
- Estimated rent
- $1,559 medium interval (Pro) →
- Mortgage (P&I)
- −$296
- Tax from tax record
- −$30 /mo · $363/yr
- Insurance
- −$24
- Flood insurance flood zone
- −$66 /mo · $798/yr
- HOA
- −$0
- Vacancy / Maint / Mgmt
- −$327
- Net cashflow
- $815
Break-even live
UW: 25.0% down · 7.5% · 30yr · 1.5% tax · 5.0% vac · 8.0% maint · 8.0% mgmt
Financing live
Cash to close
- Down payment
- $14,125
- Closing costs
- $1,695
- Reserves months
- —
- Total cash needed
- —
Loan-product check · same deal, 3 products live
Conventional
25% down · 7.5% · 30yr
- Down + closing
- —
- Monthly P&I
- —
- Monthly cashflow
- —
- DSCR
- —
- Eligible?
- —
Personal DTI + credit; lowest rate.
DSCR
20% down · 8.5% · 30yr
- Down + closing
- —
- Monthly P&I
- —
- Monthly cashflow
- —
- DSCR
- —
- Eligible?
- —
No personal income docs; deal must DSCR.
Hard money
10% down · 12.0% · 12mo
- Down + closing
- —
- Monthly P&I
- —
- Monthly cashflow
- —
- DSCR
- —
- Eligible?
- —
Short-term bridge; refi at stabilization.
Rent comps 2 comps
| Address | Beds | Baths | Sqft | Rent | $/sqft | DOM | Units | Dist |
|---|---|---|---|---|---|---|---|---|
| 784 Berkley Ln Unit 4 Big Bear Lake, CA | 2.0 | 1.0 | 600 | $1,350 | $2.25 | 18d | 1 | 0.97mi |
| 42651 Falcon Ave Big Bear Lake, CA | 2.0 | 1.0 | 667 | $1,750 | $2.62 | 5d | 1 | 1.15mi |
Listing history 22 events
-
2026-06-16statusdays on market $56,500 Pending 122 DOM
-
2026-05-06historical Active Under Contract 514-char remark
Show marketing remark (514 chars)
Located in Trails End Mobile Home Park, owner must be 55 or older. Modular home built in 2016. Handicap ramp at back door for easier access. Stackable washer/dryer and newer appliances. Propanel metal roof, no shoveling your roof and last way longer than a regular roof. Fenced back yard and large shed on property. Down the street from the park and lake and centrally located to grocery stores, bus stop and restaurants. Owners and pets must be approved through the park. No rentals. Space rent is $850 per month.
-
2026-01-29$56,500 Active 514-char remark
Show marketing remark (514 chars)
Located in Trails End Mobile Home Park, owner must be 55 or older. Modular home built in 2016. Handicap ramp at back door for easier access. Stackable washer/dryer and newer appliances. Propanel metal roof, no shoveling your roof and last way longer than a regular roof. Fenced back yard and large shed on property. Down the street from the park and lake and centrally located to grocery stores, bus stop and restaurants. Owners and pets must be approved through the park. No rentals. Space rent is $850 per month.
-
2026-01-28$56,500 Active 514-char remark
Show marketing remark (514 chars)
Located in Trails End Mobile Home Park, owner must be 55 or older. Modular home built in 2016. Handicap ramp at back door for easier access. Stackable washer/dryer and newer appliances. Propanel metal roof, no shoveling your roof and last way longer than a regular roof. Fenced back yard and large shed on property. Down the street from the park and lake and centrally located to grocery stores, bus stop and restaurants. Owners and pets must be approved through the park. No rentals. Space rent is $850 per month.
-
2024-06-17soldstatus $51,900 Closed
-
2024-06-01historical Active Under Contract
-
2024-03-26status Active
-
2024-03-10historical Active Under Contract
-
2024-02-12price $59,000
-
2024-01-19price $64,000
-
2023-11-11price $69,000
-
2023-10-16price $75,000
-
2023-09-28$79,000 Active
-
2020-09-11soldstatus $50,000 Closed Sale
-
2020-09-09soldstatus $50,000
-
2020-08-16status Pending Sale
-
2020-07-28status Active
-
2020-07-25historical Active Under Contract
-
2020-07-17status Pending Sale
-
2020-06-29$55,000 Active
-
2020-06-09$55,000
ⓘ Source: listings_history table (triggers on properties + properties_extension) + one-shot
backfill from property_details.listing_events for pre-trigger history.
Tax reassessment forecast CA · Resets to sale price
- Current annual tax
- $363 · $30/mo
- Projected year-2 tax
- $429 · $36/mo
- Expected delta
- +$67/yr (+$6/mo · 18.4%)
ⓘ Screening estimate from a state-policy table — verify with the county assessor before closing.
Climate risk First Street
- Flood 7/10 Severe FEMA zone X (unshaded) · 99% chance over 30 yrs
- Wildfire 7/10 Severe
- Heat 2/10 Low 10 d/yr ≥82°F today · 27 d/yr by 30 yrs out
- Wind 1/10 Low
- Air quality 10/10 Extreme 33 unhealthy d/yr today · 39 by 30 yrs out
Nearby sold comps map
Loading sold comps map…
Walkable amenities ~0.75 mi
Loading nearby amenities…
Taxation est. · year 1
- Rental income
- $18,704
- − Mortgage interest
- −$3,165
- − Property taxes
- −$363
- − Insurance
- −$1,080
- − Repairs & maintenance
- −$1,496
- − Management
- −$1,496
- − Depreciation
- −$1,644
- Taxable income
- $9,460
- Est. tax owed @ 24.0%
- −$2,270
- After-tax cash flow
- $7,508/yr
For passive investors: Depreciation is non-cash, so a rental often shows a tax loss while cash-flowing — sheltering income. Rental losses are passive: they offset passive income freely, and up to $25,000/yr can offset ordinary (W-2) income if you actively participate and your MAGI is under $100k (phasing out to $0 by $150k); unused losses carry forward. On sale, claimed depreciation is recaptured at up to 25%, and gains may owe capital-gains tax (a 1031 exchange can defer both). Figures are a year-1 estimate at your 24.0% rate — not tax advice; consult a CPA.
Schools (NCES district)
- District
- Bear Valley Unified
- NCES district ID
- 0604230
- Math proficiency
- 26% ▼ -4.00%
- Reading proficiency
- 43% ▼ -4.00%
- Median HH income
- $42,222
- Composite
- 29.12/100
- National rank
- #6588
- State rank
- #289 of 517 in CA
Livability — Big Bear Lake
- Score
- 64/100
- State rank
- #420
- US rank
- #14284
Category grades
Schools grade is shown separately in the Schools card above.
Census & demographics
- Census place
- Big Bear Lake, CA
- County
- San Bernardino County · 2,030,291 people
- City population
- 5,215
- Metro
- Riverside-San Bernardino-Ontario, CA
- Population (ZIP)
- 5,215
- Household income
- $77,436
- Rent vs Own
- Severe rent burden
- 209.0
Population outlook (San Bernardino County) Hauer SSP2
- Today (2025)
- 2,300,329 people
- By 2030
- 2,378,907 · +3.4%
- By 2040
- 2,523,137 · +9.7%
- By 2050
- 2,642,388 · +14.9%
- By 2075
- 2,880,769 · +25.2%
- By 2100
- 2,909,436 · +26.5%
Race, ethnicity, and origin ACS 2023
- Neighborhood character
- Predominantly White (69%)
- Race & ethnicity
- White 69% Hispanic / Latino 24% Two or more races 18% Asian 2%
- Hispanic origin (detail)
- Mexican 21% Salvadoran 1%
- Common ancestry
- Slovak 4% Italian 4% Portuguese 3%
- Foreign-born
- 13% · Canada, China, South Korea
- Languages at home
- 83% English-only · Spanish 10% Other Indo-European 1% Russian/Polish/Slavic 1%
Political lean MEDSL · San Bernardino
- 2024 margin
- Toss-up / Even · D 47.5% · R 49.7% · Other 2.8%
- 2008→2024 swing
- -8.5pp toward R · 2008: 6.3pp · 2024: -2.1pp
- All cycles
- 2024: R+2.1 2020: D+10.7 2016: D+9.8 2012: D+5.4 2008: D+6.3
Not yet ingested
- Civics
- —
Market trends
- HPI YoY
- ▼ -242.29%
- Current HPI
- 310.1013
- Rent YoY
- ▼ -3.48%
- Metro
- Riverside-San Bernardino-Ontario, CA
- State GDP YoY
- ▲ 3.21%
- F500 in state
- 116
Industry mix (Fortune 500 HQ in CA)
| Industry | F500 HQs | Revenue |
|---|---|---|
| Technology | 27 | $1,492B |
|
||
| Financial Services | 3 | $174B |
|
||
| Retail | 3 | $44B |
|
||
| Insurance | 3 | $26B |
|
||
| Media / Entertainment | 2 | $115B |
|
||
| Pharmaceuticals / Biotech | 2 | $62B |
|
||
Price history
+2.7% since first listed21 events — show timeline
- 2026-05-06 Contingent — CRMLS
- 2026-05-06 Contingent — MRCAOR
- 2026-01-29 Listed $56,500 CRMLS
- 2026-01-28 Listed $56,500 MRCAOR
- 2024-06-17 Sold (MLS) $51,900 MRCAOR
- 2024-06-01 Contingent — MRCAOR
- 2024-03-26 Relisted — MRCAOR
- 2024-03-10 Contingent — MRCAOR
- 2024-02-12 Price Changed $59,000 MRCAOR
- 2024-01-19 Price Changed $64,000 MRCAOR
- 2023-11-11 Price Changed $69,000 MRCAOR
- 2023-10-16 Price Changed $75,000 MRCAOR
- 2023-09-28 Listed $79,000 MRCAOR
- 2020-09-11 Sold (MLS) $50,000 CRMLS
- 2020-09-09 Sold (MLS) $50,000 MRCAOR
- 2020-08-16 Pending — CRMLS
- 2020-07-28 Relisted — CRMLS
- 2020-07-25 Contingent — CRMLS
- 2020-07-17 Pending — CRMLS
- 2020-06-29 Listed $55,000 CRMLS
- 2020-06-09 Listed $55,000 MRCAOR
Property tax history
-1.8%/yrLatest (2025): $363 · -0.3% YoY. Source: county tax records.
Cash-flow waterfall
monthlySold comps — $/sqft
last 12 mo · ≤1 miLoading sold comps…