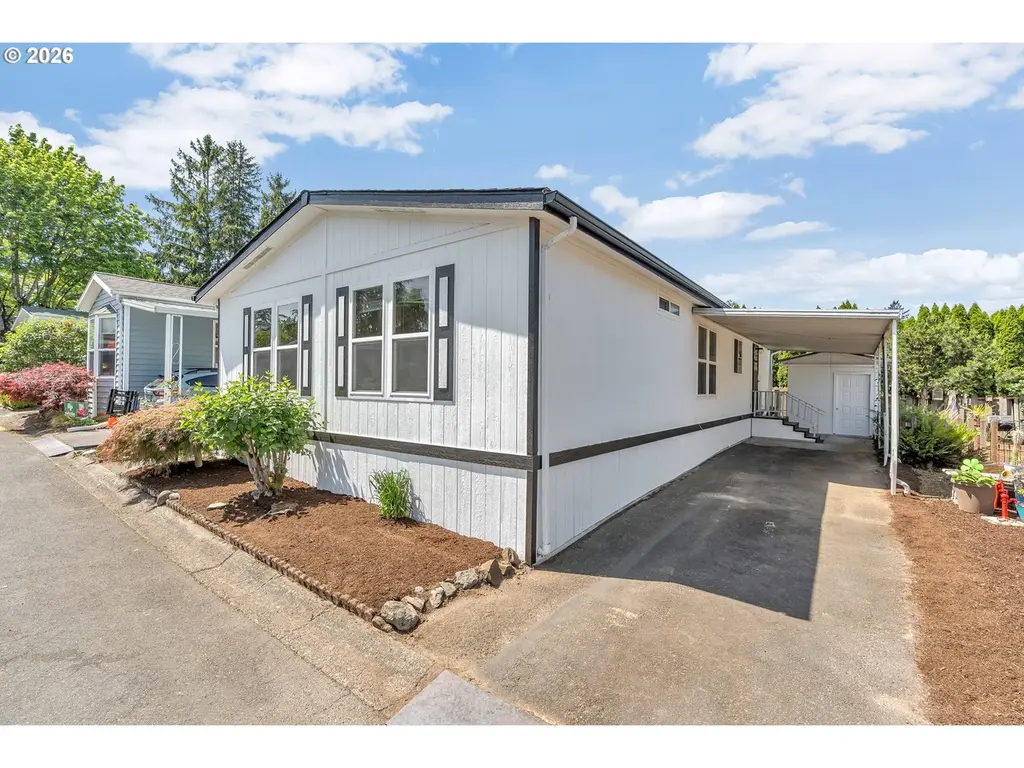
21100 NE Sandy Blvd #6 · Fairview, OR
Flood risk 1/10 · Minimal
- FEMA flood zone
- X (unshaded)
- Chance of flooding over 30 yrs
- 0.0%
- Est. flood insurance / yr
- $507 – $1,088
Fire risk 1/10 · Minimal
- Est. fire insurance / yr
- $498 – $926
Heat risk 3/10 · Minor
- Hot days now (above 93°F)
- 7 days/yr
- Hot days in 30 yrs
- 15 days/yr
Wind risk 1/10 · Minimal
- Chance of severe wind over 30 yrs
- —
Air-quality risk 9/10 · Severe
- Unhealthy air days now
- 14 days/yr
- Unhealthy air days in 30 yrs
- 16 days/yr
Risk factors via First Street. Map © Google.
Why this score? — see what drove the B grade
The composite is a weighted blend of 9 inputs, each scored 0–100. Each bar is that input's sub-score; the figure is the points it added to the 100-point composite (weight × sub-score).
- Cash flow +30.0/30.0
- ARV discount +12.5/15.0
- 1% rule +10.0/10.0
- DSCR +10.0/10.0
- Livability +3.8/5.0
- Schools +2.7/10.0
- Condition / age +2.5/5.0
- Rent growth +2.3/5.0
- Appreciation +0.0/10.0
$79,000
🖨 Deal sheet 📄 Offer letter ✓ Due diligence
Listing remarks MLS
STORAGE UNIT AND DECK AT BACK OF HOME.
Key facts
- Large primary suite
- Oversized windows
- Garage
Tags
Property features AI
Finance
- Financial info: Land lease property (manufactured home in park)
- HOA & community: Land lease (monthly lot rent: $1,300)
Exterior
- Parking: Covered carport (1 space)
- Utilities: Public water; Public sewer; Electric hot water; Electric fuel
- Home design: Manufactured home in park (residential); One-level; Entry/main living on main level; Built in 1991; No notable view
- Construction: Composition roof; Wood siding construction; Year built 1991
- Exterior features: Covered deck; Fenced yard; Tool shed; Wood siding; Level lot; Paved road access
Interior
- Kitchen: Dishwasher; Disposal; Free-standing range; Free-standing refrigerator; Eat bar
- Bedrooms: Primary bedroom on main with double closet, double sinks and ensuite; Second bedroom on main with closet and wall-to-wall carpet; Third bedroom on main with closet and wall-to-wall carpet
- Flooring: Laminate flooring (kitchen and utility); Wall-to-wall carpet in living areas and bedrooms
- Bathrooms: Two full bathrooms (both on main level)
- Heating & cooling: Heat pump heating; No central cooling
- Interior features: High ceilings; Vaulted ceilings; Natural lighting; Laundry area; Built-in features; Minimal steps; One-level living; Accessibility features (garage on main, ground level, main floor bedroom with bath, utility room on main)
- Laundry & utility: Utility room on main with washer/dryer hookups; Washer/Dryer included
Neighborhood map
What this means for you Summary
Snapshot
- This is a 3-bed/2.0-bath manufactured listed at $79k.
Deal economics
- At list price, monthly cash flow is $947 ($11k/yr) — positive.
- The deal already cash-flows at list — no discount required.
- Meets the 1% rule at list price ($2k rent vs $79k).
- Recommended offer: $77k (3.0% below list) — sets the bar for market timing.
- Cap rate 20.7% vs local median 2.7% in Fairview — top-decile yield for the area; either an underpriced asset or a hidden risk that comps aren't pricing in. Stress-test before assuming the spread holds.
Location & tenants
- Location reads 75/100 on livability (#85 in OR, #4,103 nationally) — a middle-class / working-renter tenant base. Strengths: commute A+, housing A+, health & safety A-; Watch: cost of living D, amenities F.
- Reynolds SD 7 (suburban): math 21% / reading 36% proficiency, ranked #162 of 183 in OR (top 88%) — low school quality limits family demand, transient renter base, plan for 1-2y turnover; 66% free/reduced lunch — lower-income household profile, screen leases tightly.
- Zoned schools: Fairview Elementary School (299 students, 98% FRL); Reynolds Middle School (837 students, 98% FRL); Reynolds High School (2,474 students, 67% FRL) — zoned schools average 88% FRL vs 66% district-wide (22 pts higher); higher-poverty schools than district average — tighter screening recommended.
- Market conditions: Rents soft (-1.0%/yr); 53 active listings in the ZIP; 33 comparable units currently listed for rent nearby; rentals at typical pace (median 22d on market — plan ~3-4 weeks tenant-placement turnaround); 2,041 units permitted in Multnomah County in 2024 (905 in 5+ unit buildings).
- This rent runs 32% of the median local income ($70k/yr) — at the standard rent-burdened threshold; future hikes will face affordability resistance.
Forward outlook
- Local home prices are declining (-3.0%/yr); year-one equity from $546 of loan paydown is wiped out by about $2k of value loss. Plan a longer hold.
- Multnomah County population projected at +33% by 2050 — long-run rental-demand tailwind backs the buy-and-hold thesis.
- At projected returns (-3.0% appreciation + 0.0% rent growth), your $22k cash investment doubles in ~3 years — after that, you're playing with house money.
Negotiation context
- It's been on market 41 days — a 3% lower offer ($77k) is reasonable based on typical stale-listing flexibility.
- 2 sale attempts since 29y ago; this cycle's ask has dropped $16k (17%) from the opening price — seller is motivated, your offer sets the floor, not the list.
- Current owner paid $40k; list at $79k implies a 98% gain — meaningful room to come down on a strong offer.
Questions for the listing agent
- It's been on market 41 days. Have you received any prior offers? Is the seller open to a 3% concession, seller financing, or rate buy-down credit?
- Is there a deadline driving the sale (1031 exchange, divorce, estate, relocation)? That informs how much negotiation room exists.
- Schools are F-rated, which usually means shorter tenancies and higher turnover. Who's the typical renter profile here, and what's been the actual vacancy rate?
- What's the average days-on-market for RENTAL listings here right now (not sales)? A rising rental-DOM trend means longer vacancies and softer asking-rent achievability than the comps imply.
- What's the recent tenant-quality profile in this submarket — average credit score on applications, eviction rate, late-payment / NSF rate, and stable-employment percentage? A property-management company in the area should have these aggregated.
- How much new for-sale + rental construction is in the pipeline within 1–3 miles? Heavy new supply typically softens prices + rents 12–24 months out; constrained supply supports both.
Investment metrics
- 1% rule
- 2.34% ✓
- Cap rate
- 20.67%
- Cash-on-cash
- 51.36%
- DSCR
- 3.29
- GRM
- 3.6
CMA / ARV
- ARV (median comp)
- $88,837
- List price
- $79,000
- Delta
- -11.07%
- Verdict
- UNDERPRICED
- Comps
- 16 within 1.0 mi
Show comp detail 12 sales within ~0.75 mi
| Address | Dist | Beds/Ba | Sqft | Sold | Price | $/sf | Match |
|---|---|---|---|---|---|---|---|
| 21100 NE Sandy Blvd #39 | 0.13mi | 2/2.0 (-1) | 1,224 (-1%) | 2mo | $75,000 | $61 | 85 |
| 21100 NE Sandy Blvd #2 | 0.04mi | 2/2.0 (-1) | 1,236 (-0%) | 10mo | $49,000 | $40 | 85 |
| 21100 NE Sandy Blvd | 0.09mi | 2/2.0 (-1) | 1,248 (+1%) | 11mo | $90,000 | $72 | 81 |
| 21100 NE Sandy Blvd #72 | 0.07mi | 3/2.0 | 1,104 (-11%) | 8mo | $109,000 | $99 | 72 |
| 21100 NE Sandy Blvd #76 | 0.12mi | 2/2.0 (-1) | 1,120 (-10%) | 5mo | $67,900 | $61 | 69 |
| 21100 NE Sandy Blvd #127 | 0.15mi | 2/2.0 (-1) | 1,344 (+9%) | 13mo | $84,500 | $63 | 63 |
| 20140 NE Sandy Blvd #103 | 0.37mi | 3/2.0 | 1,100 (-11%) | 3mo | $100,000 | $91 | 62 |
| 2500 NE 201st Ave #26 | 0.46mi | 3/2.0 | 1,404 (+13%) | 2mo | $67,000 | $48 | 55 |
| 3201 NE 223rd Ave #7 | 0.57mi | 3/2.0 | 1,344 (+9%) | 9mo | $117,320 | $87 | 52 |
| 3201 NE 223rd Ave #41 | 0.60mi | 3/2.0 | 1,296 (+5%) | 15mo | $153,000 | $118 | 52 |
| 3201 NE 223rd Ave | 0.59mi | 3/2.0 | 1,296 (+5%) | 16mo | $125,000 | $96 | 51 |
| 2632 NE 201st Ave #30 | 0.45mi | 3/2.0 | 1,404 (+13%) | 12mo | $120,000 | $85 | 46 |
Match score weights: distance 35% · size 25% · config 20% · recency 20%. Top-matched comps best support the ARV.
Projected returns pro-forma
-3.0% appreciation · 0.0% rent growth · sell at horizon
- IRR
- 45.9%
- Equity multiple
- 2.90×
- Total profit
- $42,093
- Equity at exit
- $11,779
- IRR
- 50.4%
- Equity multiple
- 5.22×
- Total profit
- $93,407
- Equity at exit
- $6,830
Cash invested: $22,120 (down + closing). Projections, not guarantees.
Landlord ↔ Tenant lean methodology
- Overall (STATE)
- 28 Tenant-Leaning
- State Oregon
- 28 Tenant-Leaning · D+6
- County
- — inherits STATE
- City
- — inherits STATE
ZIP-level market 97024
- Home prices YoY
- -20.3%
- Rents YoY
- -1.0%
- Active inventory
- 53
- Price-to-rent
- 3.6×
Monthly cashflow live
- Estimated rent
- $1,848 high interval (Pro) →
- Mortgage (P&I)
- −$414
- Tax from tax record
- −$66 /mo · $788/yr
- Insurance
- −$33
- HOA
- −$0
- Vacancy / Maint / Mgmt
- −$388
- Net cashflow
- $947
Break-even live
UW: 25.0% down · 7.5% · 30yr · 1.5% tax · 5.0% vac · 8.0% maint · 8.0% mgmt
Financing live
Cash to close
- Down payment
- $19,750
- Closing costs
- $2,370
- Reserves months
- —
- Total cash needed
- —
Loan-product check · same deal, 3 products live
Conventional
25% down · 7.5% · 30yr
- Down + closing
- —
- Monthly P&I
- —
- Monthly cashflow
- —
- DSCR
- —
- Eligible?
- —
Personal DTI + credit; lowest rate.
DSCR
20% down · 8.5% · 30yr
- Down + closing
- —
- Monthly P&I
- —
- Monthly cashflow
- —
- DSCR
- —
- Eligible?
- —
No personal income docs; deal must DSCR.
Hard money
10% down · 12.0% · 12mo
- Down + closing
- —
- Monthly P&I
- —
- Monthly cashflow
- —
- DSCR
- —
- Eligible?
- —
Short-term bridge; refi at stabilization.
Rent comps 33 comps
| Address | Beds | Baths | Sqft | Rent | $/sqft | DOM | Units | Dist |
|---|---|---|---|---|---|---|---|---|
| 2667 NE 205th Ave Fairview, OR | 3.0 | 2.0 | 1115 | $1,950 | $1.75 | 24d | 1 | 0.30mi |
| 20454 NE Sandy Blvd Apt B26 Fairview, OR | 2.0 | 2.0 | 950 | $1,722 | $1.81 | 20d | 7 | 0.31mi |
| 20454 NE Sandy Blvd Fairview, OR | 2.0 | 2.0 | 950 | $1,450 | $1.53 | 3d | 4 | 0.31mi |
| 22199 NE Sandy Blvd Fairview, OR | 2.0 | 1.0–2.0 | 707 | $2,200 | $3.11 | 3d | 27 | 0.49mi |
| 609 Lincoln St Unit 609 Fairview, OR | 3.0 | 2.5 | 1100 | $2,250 | $2.05 | 43d | 1 | 0.58mi |
| 20347 NE Halsey St Fairview, OR | 2.0 | 2.0 | 985 | $1,614 | $1.64 | 3d | 2 | 0.65mi |
| 1650 NE Market Dr Fairview, OR | 1.0–2.0 | 1.0 | 741 | $1,895 | $2.56 | 1d | 3 | 0.67mi |
| 320 Lincoln St Fairview, OR | 2.0 | 1.0 | 950 | $1,395 | $1.47 | 43d | 1 | 0.68mi |
| 230 Lincoln St Fairview, OR | 2.0 | 1.5 | 864 | $1,595 | $1.85 | 17d | 1 | 0.70mi |
| 230 Lincoln St Apt 116 Fairview, OR | 2.0 | 1.5 | 864 | $1,595 | $1.85 | 22d | 1 | 0.71mi |
| 22100 NE Halsey St Fairview, OR | 1.0–3.0 | 1.0–2.0 | 1003 | $2,395 | $2.39 | 3d | 10 | 0.72mi |
| 22025 NE Halsey St Fairview, OR | 1.0–2.0 | 1.0–2.0 | 841 | $1,795 | $2.13 | 10d | 1 | 0.74mi |
| 1497 NE Market Dr Fairview, OR | 2.0 | 2.0 | 1136 | $1,750 | $1.54 | 43d | 1 | 0.76mi |
| 1559 NE 201st Ave Unit 104 Fairview, OR | 2.0 | 1.0 | 860 | $1,475 | $1.72 | 24d | 1 | 0.76mi |
| 1559 NE 201st Ave Fairview, OR | 2.0 | 1.0 | 860 | $1,475 | $1.72 | 43d | 1 | 0.76mi |
| 21933 NE Chinook Way Fairview, OR | 1.0–3.0 | 1.0–2.5 | 874 | $2,315 | $2.65 | 1d | 8 | 0.76mi |
| 19927 NE Halsey St Unit 103 Portland, OR | 3.0 | 2.5 | 1225 | $1,895 | $1.55 | 43d | 1 | 0.79mi |
| 19849 NE Halsey St Unit 123 Portland, OR | 2.0 | 1.0 | 768 | $1,295 | $1.69 | 43d | 1 | 0.82mi |
| 19849 NE Halsey St Unit 110 Portland, OR | 3.0 | 2.0 | 895 | $1,870 | $2.09 | 17d | 1 | 0.83mi |
| 19849 NE Halsey St Unit 115 Portland, OR | 2.0 | 1.0 | 768 | $1,360 | $1.77 | 24d | 1 | 0.83mi |
| 22032 NE Chinook Way Unit B Fairview, OR | 2.0 | 2.5 | 1150 | $2,045 | $1.78 | 7d | 1 | 0.84mi |
| 22032 NE Chinook Way Apt A Fairview, OR | 2.0 | 2.5 | 1150 | $1,995 | $1.73 | 43d | 1 | 0.84mi |
| 22620 NE Hancock St Fairview, OR | 2.0 | 2.0 | 1196 | $1,995 | $1.67 | 22d | 1 | 0.85mi |
| 19511 NE Halsey St Portland, OR | 2.0 | 1.0 | 917 | $1,395 | $1.52 | 3d | 1 | 0.95mi |
| 22701 NE Halsey St Unit FO222 Fairview, OR | 2.0 | 2.0 | 965 | $1,511 | $1.57 | 43d | 1 | 0.95mi |
| 22701 NE Halsey St Unit FO221 Fairview, OR | 2.0 | 2.0 | 820 | $1,458 | $1.78 | 43d | 1 | 0.95mi |
| 22701 NE Halsey St Unit FO182 Fairview, OR | 2.0 | 1.0 | 820 | $1,458 | $1.78 | 43d | 1 | 0.95mi |
| 22701 NE Halsey St Unit FO1101 Fairview, OR | 2.0 | 2.0 | 965 | $1,511 | $1.57 | 24d | 1 | 0.95mi |
| 22920 NE Halsey St Wood Village, OR | 2.0 | 1.0 | 784 | $1,500 | $1.91 | 24d | 1 | 1.04mi |
| 20220 NE Glisan St Portland, OR | 1.0–2.0 | 1.0 | 767 | $1,595 | $2.08 | 3d | 2 | 1.15mi |
| 23901 NE Halsey St Wood Village, OR | 2.0–3.0 | 1.0–2.0 | 1012 | $1,495 | $1.48 | 14d | 4 | 1.44mi |
| 1348 NE 186th Ave Portland, OR | 2.0 | 1.0 | 853 | $1,395 | $1.64 | 12d | 1 | 1.44mi |
| 1303 NE 238th Dr Unit 1303 Wood Village, OR | 2.0 | 1.0 | 833 | $1,645 | $1.97 | 24d | 1 | 1.45mi |
Listing history 17 events
-
2026-06-19remarks 674-char remark
-
2026-06-18days on market $79,000 Active 41 DOM
-
2026-06-17days on market $79,000 Active 40 DOM
-
2026-06-16days on market $79,000 Active 39 DOM
-
2026-06-15days on market $79,000 Active 38 DOM
-
2026-06-13days on market $79,000 Active 36 DOM
-
2026-06-13days on market $79,000 Active 35 DOM
-
2026-06-09days on market $79,000 Active 32 DOM
-
2026-06-08days on market $79,000 Active 31 DOM
-
2026-06-07days on market $79,000 Active 30 DOM
-
2026-06-03days on market $79,000 Active 26 DOM
-
2026-06-02pricedays on market $79,000 Active 25 DOM
-
2026-06-01days on market $89,000 Active 24 DOM
-
2026-05-31days on market $89,000 Active 23 DOM
-
2026-05-08$95,000 Active 659-char remark
-
1998-04-13soldstatus $40,000 38-char remark
Show marketing remark (38 chars)
STORAGE UNIT AND DECK AT BACK OF HOME.
-
1997-10-24$44,900 38-char remark
Show marketing remark (38 chars)
STORAGE UNIT AND DECK AT BACK OF HOME.
ⓘ Source: listings_history table (triggers on properties + properties_extension) + one-shot
backfill from property_details.listing_events for pre-trigger history.
Tax reassessment forecast OR · Resets to sale price
- Current annual tax
- $788 · $66/mo
- Projected year-2 tax
- $788 · $66/mo
- Expected delta
- $0/yr ($0/mo · 0.0%)
ⓘ Screening estimate from a state-policy table — verify with the county assessor before closing.
Climate risk First Street
- Flood 1/10 Low FEMA zone X (unshaded) · 0% chance over 30 yrs
- Wildfire 1/10 Low
- Heat 3/10 Moderate 7 d/yr ≥93°F today · 15 d/yr by 30 yrs out
- Wind 1/10 Low
- Air quality 9/10 Extreme 14 unhealthy d/yr today · 16 by 30 yrs out
Nearby sold comps map
Loading sold comps map…
Walkable amenities ~0.75 mi
Loading nearby amenities…
Taxation est. · year 1
- Rental income
- $22,172
- − Mortgage interest
- −$4,425
- − Property taxes
- −$788
- − Insurance
- −$395
- − Repairs & maintenance
- −$1,774
- − Management
- −$1,774
- − Depreciation
- −$2,298
- Taxable income
- $10,718
- Est. tax owed @ 24.0%
- −$2,572
- After-tax cash flow
- $8,789/yr
For passive investors: Depreciation is non-cash, so a rental often shows a tax loss while cash-flowing — sheltering income. Rental losses are passive: they offset passive income freely, and up to $25,000/yr can offset ordinary (W-2) income if you actively participate and your MAGI is under $100k (phasing out to $0 by $150k); unused losses carry forward. On sale, claimed depreciation is recaptured at up to 25%, and gains may owe capital-gains tax (a 1031 exchange can defer both). Figures are a year-1 estimate at your 24.0% rate — not tax advice; consult a CPA.
Schools (NCES district)
- District
- Reynolds SD 7
- NCES district ID
- 4110520
- Math proficiency
- 21% ▬ 0.00%
- Reading proficiency
- 36% ▬ 0.00%
- Median HH income
- $45,502
- Composite
- 27.4/100
- National rank
- #12399
- State rank
- #162 of 183 in OR
Livability — Fairview
- Score
- 75/100
- State rank
- #85
- US rank
- #4103
Category grades
Schools grade is shown separately in the Schools card above.
Census & demographics
- Census place
- Fairview, OR
- County
- Multnomah County · 786,692 people
- City population
- 12,007
- Metro
- Portland-Vancouver-Hillsboro, OR-WA
- Population (ZIP)
- 12,007
- Household income
- $69,679
- Rent vs Own
- Severe rent burden
- 552.0
Population outlook (Multnomah County) Hauer SSP2
- Today (2025)
- 930,825 people
- By 2030
- 996,904 · +7.1%
- By 2040
- 1,121,379 · +20.5%
- By 2050
- 1,242,124 · +33.4%
- By 2075
- 1,464,431 · +57.3%
- By 2100
- 1,576,181 · +69.3%
Race, ethnicity, and origin ACS 2023
- Neighborhood character
- Diverse neighborhood (Simpson 0.68)
- Race & ethnicity
- White 48% Hispanic / Latino 27% Two or more races 15% Black 12% Pacific Islander 3% Native American 2% Asian 1%
- Hispanic origin (detail)
- Mexican 24%
- Common ancestry
- Portuguese 3% Italian 3% Lithuanian 3%
- Foreign-born
- 16% · Canada, Guatemala, Vietnam
- Languages at home
- 69% English-only · Spanish 23% Other Asian/Pacific 3% Russian/Polish/Slavic 1%
Political lean MEDSL · Multnomah
- 2024 margin
- Solid D (+62.1) · D 79.3% · R 17.2% · Other 3.5%
- 2008→2024 swing
- +6.0pp toward D · 2008: 56.1pp · 2024: 62.1pp
- All cycles
- 2024: D+62.1 2020: D+61.3 2016: D+58.3 2012: D+54.9 2008: D+56.1
Not yet ingested
- Civics
- —
Market trends
- HPI YoY
- ▼ -72.88%
- Current HPI
- 286.4915
- Rent YoY
- ▼ -0.99%
- Metro
- Portland-Vancouver-Hillsboro, OR-WA
- State GDP YoY
- ▲ 2.05%
- F500 in state
- 2
Industry mix (Fortune 500 HQ in OR)
| Industry | F500 HQs | Revenue |
|---|---|---|
| Consumer Goods | 1 | $51B |
|
||
Price history
+75.9% since first listed5 events — show timeline
- 2026-06-02 Price Changed $79,000 RMLS
- 2026-05-27 Price Changed $89,000 RMLS
- 2026-05-08 Listed $95,000 RMLS
- 1998-04-13 Sold (MLS) $40,000 RMLS
- 1997-10-24 Listed $44,900 RMLS
Property tax history
+2.3%/yrLatest (2022): $788 · +3.6% YoY. Source: county tax records.
Cash-flow waterfall
monthlySold comps — $/sqft
last 12 mo · ≤1 miLoading sold comps…