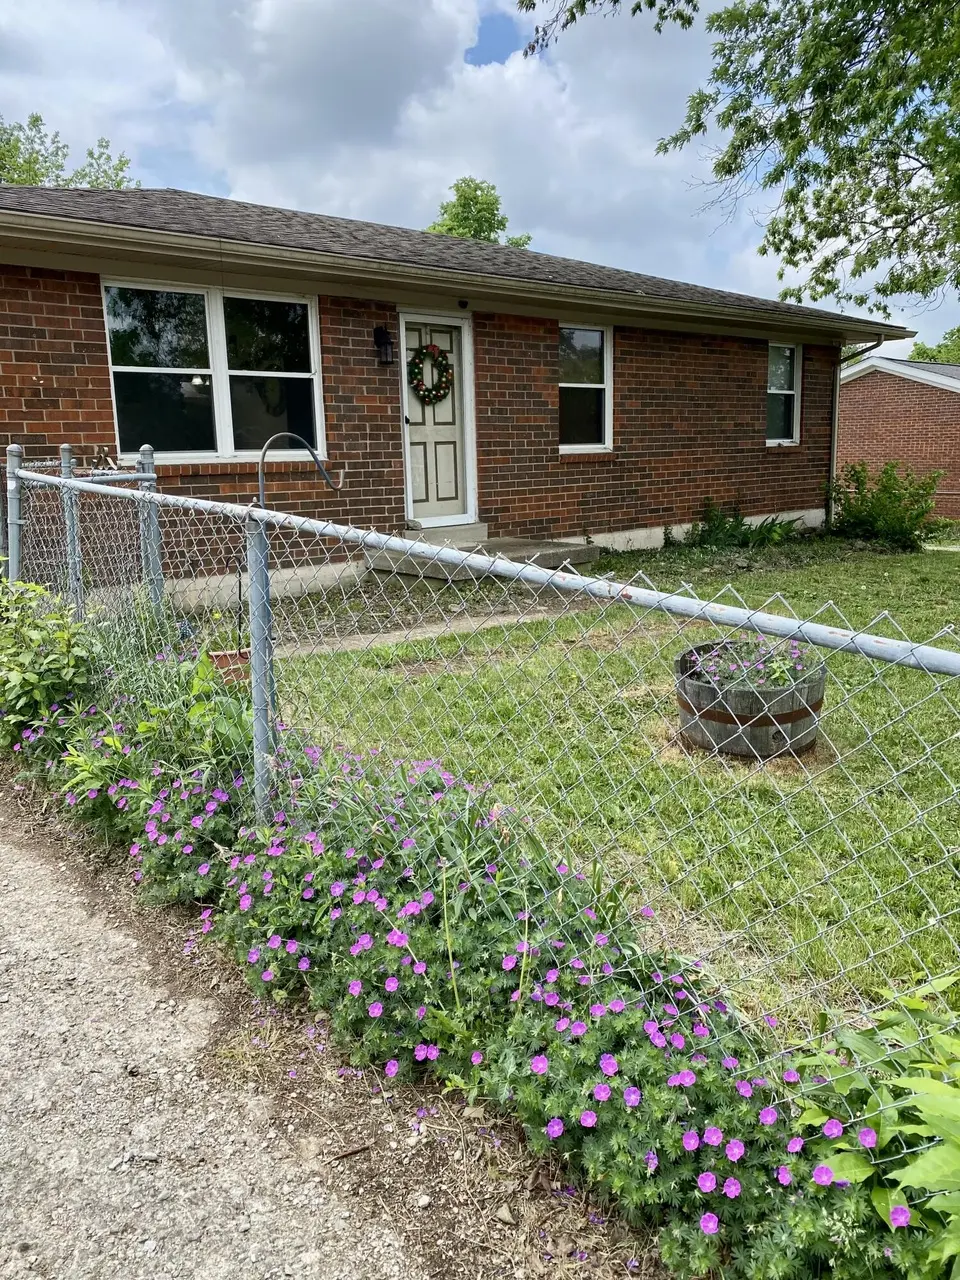
315 E Brown St · Nicholasville, KY
Flood risk 1/10 · Minimal
- FEMA flood zone
- X (unshaded)
- Chance of flooding over 30 yrs
- 0.0%
- Est. flood insurance / yr
- $507 – $1,088
Fire risk 3/10 · Minor
- Est. fire insurance / yr
- $839 – $1,559
Heat risk 4/10 · Minor
- Hot days now (above 102°F)
- 7 days/yr
- Hot days in 30 yrs
- 19 days/yr
Wind risk 2/10 · Minimal
- Chance of severe wind over 30 yrs
- 4.0%
Air-quality risk 1/10 · Minimal
- Unhealthy air days now
- 0 days/yr
- Unhealthy air days in 30 yrs
- 0 days/yr
Risk factors via First Street. Map © Google.
Why this score? — see what drove the C grade
The composite is a weighted blend of 9 inputs, each scored 0–100. Each bar is that input's sub-score; the figure is the points it added to the 100-point composite (weight × sub-score).
- Cash flow +23.8/30.0
- DSCR +7.7/10.0
- ARV discount +7.5/15.0
- 1% rule +5.1/10.0
- Rent growth +4.4/5.0
- Schools +3.3/10.0
- Livability +3.3/5.0
- Condition / age +2.5/5.0
- Appreciation +0.0/10.0
$164,900
🖨 Deal sheet 📄 Offer letter ✓ Due diligence
Listing remarks
Opportunity Knocks! Buyer's here's your chance to have instant equity or investors this is the perfect flip or your next rental property. Located in a very convenient spot in Nicholasville this property offers a lot for the money and with just a few updates will make someone a very nice home. This property is in livable condition and provides a solid option for buyers seeking an affordable home with the opportunity to add your own personal touches over time. It would be amazing what a little paint and refinishing the hardwood flooring that's in all the living areas except the kitchen and bath would do for this home. Outside you have a very large private backyard that you just can't find wit
Key facts
- Hardwood flooring
- Livable condition
- Private backyard
Tags
Property features AI
Exterior
- Parking: Driveway; Off-street parking
- Utilities: Public water; Public sewer; Electricity connected; Sewer connected; Water connected
- Home design: Single-story house
- Construction: Brick veneer exterior; Dimensional style roof; Block foundation; Built as a house (one level)
- Exterior features: Shed(s); Chain link, privacy, and wood fencing
Interior
- Kitchen: Refrigerator; Range
- Bedrooms: Primary bedroom located on the first floor
- Flooring: Hardwood; Vinyl
- Bathrooms: 1 full bathroom
- Heating & cooling: Heat pump for heating and cooling
- Interior features: Primary bedroom on the first floor; Ceiling fan(s); Insulated windows; 7 total rooms; Crawl space (basement)
- Laundry & utility: Washer hookup on the main level; Electric dryer hookup
Neighborhood map
What this means for you Summary
Snapshot
- This is a 3-bed/1.0-bath other listed at $165k.
Deal economics
- At list price, monthly cash flow is $316 ($4k/yr) — positive.
- The deal already cash-flows at list — no discount required.
- Meets the 1% rule at list price ($2k rent vs $165k).
- Recommended offer: $162k (1.5% below list) — sets the bar for market timing.
- Cap rate 8.6% vs local median 3.4% in Nicholasville — top-decile yield for the area; either an underpriced asset or a hidden risk that comps aren't pricing in. Stress-test before assuming the spread holds.
Location & tenants
- Location reads 66/100 on livability (#231 in KY) — a middle-class / working-renter tenant base. Strengths: cost of living A+, housing A+, crime A; Watch: employment C-, amenities F, commute F.
- Jessamine County (town): math 31% / reading 45% proficiency, ranked #37 of 165 in KY (top 22%) — families likely to look elsewhere, expect single-tenant / working-renter base with shorter leases.
- Zoned schools: Hattie C. Warner Elementary School (math 28% / reading 42%, grade F, #298 of 676 statewide, top 44%, 528 students, 54% FRL); East Jessamine Middle School (math 23% / reading 44%, grade F, #105 of 217 statewide, top 51%, 936 students, 56% FRL).
- Market conditions: Rents rising fast (+7.5%/yr); 496 active listings in the ZIP; 7 comparable units currently listed for rent nearby; rentals at typical pace (median 23d on market — plan ~3-4 weeks tenant-placement turnaround); 267 units permitted in Jessamine County in 2024 (9 in 5+ unit buildings).
Forward outlook
- Local home prices are declining (-3.0%/yr); year-one equity from $1k of loan paydown is wiped out by about $5k of value loss. Plan a longer hold.
- Jessamine County population projected at +22% by 2050 — long-run rental-demand tailwind backs the buy-and-hold thesis.
- At projected returns (-3.0% appreciation + 7.5% rent growth), your $46k cash investment doubles in ~9 years — after that, you're playing with house money.
Negotiation context
- It's been on market 26 days — a 2% lower offer ($162k) is reasonable based on typical stale-listing flexibility.
- 3 sale attempts since 27y ago; this cycle's ask has dropped $10k (6%) from the opening price — seller is motivated, your offer sets the floor, not the list.
- Current owner paid $72k; list at $165k implies a 129% gain — meaningful room to come down on a strong offer.
Questions for the listing agent
- Is there a deadline driving the sale (1031 exchange, divorce, estate, relocation)? That informs how much negotiation room exists.
- Schools are D-rated, which usually means shorter tenancies and higher turnover. Who's the typical renter profile here, and what's been the actual vacancy rate?
- What's the average days-on-market for RENTAL listings here right now (not sales)? A rising rental-DOM trend means longer vacancies and softer asking-rent achievability than the comps imply.
- What's the recent tenant-quality profile in this submarket — average credit score on applications, eviction rate, late-payment / NSF rate, and stable-employment percentage? A property-management company in the area should have these aggregated.
- How much new for-sale + rental construction is in the pipeline within 1–3 miles? Heavy new supply typically softens prices + rents 12–24 months out; constrained supply supports both.
Investment metrics
- 1% rule
- 1.01% ✓
- Cap rate
- 8.60%
- Cash-on-cash
- 8.22%
- DSCR
- 1.37
- GRM
- 8.2
CMA / ARV
No comps found within radius.
Projected returns pro-forma
-3.0% appreciation · 7.5% rent growth · sell at horizon
- IRR
- 0.7%
- Equity multiple
- 1.03×
- Total profit
- $1,284
- Equity at exit
- $24,587
- IRR
- 14.1%
- Equity multiple
- 2.35×
- Total profit
- $62,460
- Equity at exit
- $14,258
Cash invested: $46,172 (down + closing). Projections, not guarantees.
Landlord ↔ Tenant lean methodology
- Overall (STATE)
- 83 Strongly Landlord-Friendly
- State Kentucky
- 83 Strongly Landlord-Friendly · R+16
- County
- — inherits STATE
- City
- — inherits STATE
ZIP-level market 40356
- Home prices YoY
- -18.6%
- Rents YoY
- 7.5%
- Active inventory
- 496
- Price-to-rent
- 8.2×
Monthly cashflow live
- Estimated rent
- $1,672 high interval (Pro) →
- Mortgage (P&I)
- −$865
- Tax from tax record
- −$71 /mo · $848/yr
- Insurance
- −$69
- HOA
- −$0
- Vacancy / Maint / Mgmt
- −$351
- Net cashflow
- $316
Break-even live
UW: 25.0% down · 7.5% · 30yr · 1.5% tax · 5.0% vac · 8.0% maint · 8.0% mgmt
Financing live
Cash to close
- Down payment
- $41,225
- Closing costs
- $4,947
- Reserves months
- —
- Total cash needed
- —
Loan-product check · same deal, 3 products live
Conventional
25% down · 7.5% · 30yr
- Down + closing
- —
- Monthly P&I
- —
- Monthly cashflow
- —
- DSCR
- —
- Eligible?
- —
Personal DTI + credit; lowest rate.
DSCR
20% down · 8.5% · 30yr
- Down + closing
- —
- Monthly P&I
- —
- Monthly cashflow
- —
- DSCR
- —
- Eligible?
- —
No personal income docs; deal must DSCR.
Hard money
10% down · 12.0% · 12mo
- Down + closing
- —
- Monthly P&I
- —
- Monthly cashflow
- —
- DSCR
- —
- Eligible?
- —
Short-term bridge; refi at stabilization.
Rent comps 7 comps
| Address | Beds | Baths | Sqft | Rent | $/sqft | DOM | Units | Dist |
|---|---|---|---|---|---|---|---|---|
| 136 Lowell Ct Nicholasville, KY | 3.0 | 2.5 | 1480 | $1,750 | $1.18 | 23d | 1 | 0.39mi |
| 516 S Main St Unit 1 Nicholasville, KY | 3.0 | 2.5 | 1454 | $1,850 | $1.27 | 23d | 1 | 0.44mi |
| 300 Finlaine PL Nicholasville, KY | 1.0–2.0 | 1.0–2.5 | 1130 | $2,000 | $1.77 | 13d | 7 | 0.46mi |
| 203 Elm St Nicholasville, KY | 4.0 | 1.0 | 1176 | $1,500 | $1.28 | 23d | 1 | 0.49mi |
| 305 Lake St #2 Nicholasville, KY | 2.0 | 1.5 | 850 | $995 | $1.17 | 23d | 1 | 0.73mi |
| 238 Lakeview Dr Nicholasville, KY | 2.0 | 2.0 | 1044 | $1,100 | $1.05 | 23d | 1 | 0.89mi |
| 443 Edgewood Dr Unit 5 Nicholasville, KY | 3.0 | 1.0 | 1100 | $1,300 | $1.18 | 13d | 1 | 1.32mi |
Listing history 8 events
-
2026-05-17price $164,900
-
2026-05-08status Active
-
2026-05-04historical Contingent
-
2026-04-26$175,000 Active
-
1999-06-04soldstatus $72,000
-
1999-06-04soldstatus $72,000
-
1999-04-05historical
-
1999-03-07$71,900
ⓘ Source: listings_history table (triggers on properties + properties_extension) + one-shot
backfill from property_details.listing_events for pre-trigger history.
Tax reassessment forecast KY · Resets to sale price
- Current annual tax
- $848 · $71/mo
- Projected year-2 tax
- $1,418 · $118/mo
- Expected delta
- +$570/yr (+$48/mo · 67.2%)
ⓘ Screening estimate from a state-policy table — verify with the county assessor before closing.
Climate risk First Street
- Flood 1/10 Low FEMA zone X (unshaded) · 0% chance over 30 yrs
- Wildfire 3/10 Moderate
- Heat 4/10 Moderate 7 d/yr ≥102°F today · 19 d/yr by 30 yrs out
- Wind 2/10 Low 4% chance of damaging wind over 30 yrs
- Air quality 1/10 Low 0 unhealthy d/yr today · 0 by 30 yrs out
Nearby sold comps map
Loading sold comps map…
Walkable amenities ~0.75 mi
Loading nearby amenities…
Taxation est. · year 1
- Rental income
- $20,059
- − Mortgage interest
- −$9,237
- − Property taxes
- −$848
- − Insurance
- −$824
- − Repairs & maintenance
- −$1,605
- − Management
- −$1,605
- − Depreciation
- −$4,797
- Taxable income
- $1,143
- Est. tax owed @ 24.0%
- −$274
- After-tax cash flow
- $3,523/yr
For passive investors: Depreciation is non-cash, so a rental often shows a tax loss while cash-flowing — sheltering income. Rental losses are passive: they offset passive income freely, and up to $25,000/yr can offset ordinary (W-2) income if you actively participate and your MAGI is under $100k (phasing out to $0 by $150k); unused losses carry forward. On sale, claimed depreciation is recaptured at up to 25%, and gains may owe capital-gains tax (a 1031 exchange can defer both). Figures are a year-1 estimate at your 24.0% rate — not tax advice; consult a CPA.
Schools (NCES district)
- District
- Jessamine County
- NCES district ID
- 2103030
- Math proficiency
- 31% ▼ -14.00%
- Reading proficiency
- 45% ▼ -12.00%
- Median HH income
- $50,249
- Composite
- 32.81/100
- National rank
- #5623
- State rank
- #37 of 165 in KY
Livability — Nicholasville
- Score
- 66/100
- State rank
- #231
- US rank
- #11266
Category grades
Schools grade is shown separately in the Schools card above.
Census & demographics
- Census place
- Nicholasville, KY
- County
- Jessamine County · 45,849 people
- City population
- 45,849
- Metro
- Lexington-Fayette, KY
- Population (ZIP)
- 45,849
- Household income
- $74,495
- Rent vs Own
- Severe rent burden
- 1186.0
Population outlook (Jessamine County) Hauer SSP2
- Today (2025)
- 58,419 people
- By 2030
- 61,468 · +5.2%
- By 2040
- 66,952 · +14.6%
- By 2050
- 71,357 · +22.1%
- By 2075
- 80,325 · +37.5%
- By 2100
- 83,848 · +43.5%
Race, ethnicity, and origin ACS 2023
- Neighborhood character
- Predominantly White (86%)
- Race & ethnicity
- White 86% Hispanic / Latino 5% Two or more races 5% Black 4% Asian 2%
- Common ancestry
- Italian 2% Subsaharan African 2% Slovak 2%
- Foreign-born
- 4% · Canada
- Languages at home
- 93% English-only · Spanish 4% Russian/Polish/Slavic 2% Other Asian/Pacific 1%
Political lean MEDSL · Jessamine
- 2024 margin
- Solid R (+35.9) · D 31.2% · R 67.0% · Other 1.8%
- 2008→2024 swing
- +1.1pp toward D · 2008: -37.0pp · 2024: -35.9pp
- All cycles
- 2024: R+35.9 2020: R+32.5 2016: R+40.0 2012: R+39.9 2008: R+37.0
Not yet ingested
- Civics
- —
Market trends
- HPI YoY
- ▼ -61.88%
- Current HPI
- 270.2432
- Rent YoY
- ▲ 7.50%
- Metro
- Lexington-Fayette, KY
- State GDP YoY
- ▲ 1.81%
- F500 in state
- 4
Industry mix (Fortune 500 HQ in KY)
| Industry | F500 HQs | Revenue |
|---|---|---|
| Healthcare | 1 | $118B |
|
||
| Food / Beverage | 1 | $7B |
|
||
Price history
+129.3% since first listed8 events — show timeline
- 2026-05-17 Price Changed $164,900 ImagineMLS
- 2026-05-08 Relisted — ImagineMLS
- 2026-05-04 Contingent — ImagineMLS
- 2026-04-26 Listed $175,000 ImagineMLS
- 1999-06-04 Sold (Public Records) $72,000 Public Records
- 1999-06-04 Sold (MLS) $72,000 ImagineMLS
- 1999-04-05 Listing Removed — ImagineMLS
- 1999-03-07 Listed $71,900 ImagineMLS
Cash-flow waterfall
monthlySold comps — $/sqft
last 12 mo · ≤1 miLoading sold comps…