 12-Plex
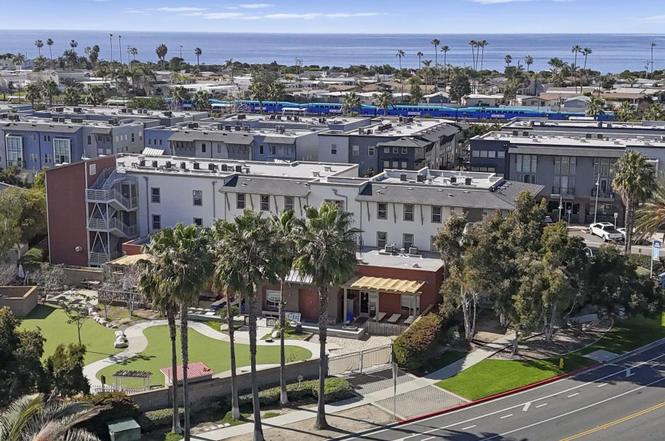
6801 Embarcadero Ln · Carlsbad, CA
Flood risk 1/10 · Minimal
- FEMA flood zone
- X (unshaded)
- Chance of flooding over 30 yrs
- 0.0%
- Est. flood insurance / yr
- $507 – $1,088
Fire risk 1/10 · Minimal
- Est. fire insurance / yr
- $659 – $1,223
Heat risk 5/10 · Moderate
- Hot days now (above 84°F)
- 7 days/yr
- Hot days in 30 yrs
- 21 days/yr
Wind risk 1/10 · Minimal
- Chance of severe wind over 30 yrs
- —
Air-quality risk 3/10 · Minor
- Unhealthy air days now
- 4 days/yr
- Unhealthy air days in 30 yrs
- 4 days/yr
Risk factors via First Street. Map © Google.
Why this score? — see what drove the B+ grade
The composite is a weighted blend of 9 inputs, each scored 0–100. Each bar is that input's sub-score; the figure is the points it added to the 100-point composite (weight × sub-score).
- Cash flow +30.0/30.0
- 1% rule +10.0/10.0
- DSCR +10.0/10.0
- ARV discount +7.5/15.0
- Schools +6.5/10.0
- Appreciation +5.9/10.0
- Livability +3.9/5.0
- Rent growth +3.4/5.0
- Condition / age +2.5/5.0
$3,695,000
🖨 Deal sheet 📄 Offer letter ✓ Due diligence
Multi-family units
County records classify this as Multi-Family (5+ Unit). Listing-text estimate: 12 units. confirmed
5+ unit building — per-unit beds/baths from public records are typically unavailable; the breakdown below (if shown) is an estimate from the listing text.
Listing remarks
Bluwater Crossing Apartments offers a rare opportunity to acquire a fully stabilized, move-in ready 12-unit multifamily asset in a true A-location in coastal South Carlsbad. Built in 2009, short distance to the beach and adjacent to the Carlsbad Poinsettia Coaster Station, the property operates at 100% historical occupancy with rent-restricted units, providing predictable, durable cash flow and minimal operational risk. Consists of twelve (12) large loft-style studio apartments averaging approximately 820 SF. Units feature quality finishes including granite countertops, modern kitchen appliances with built-in microwaves and dishwashers, in-unit washers and dryers, central A/C, spacious walk
Key facts
- Move-in ready
- Quality finishes
- Granite countertops
Tags
Neighborhood map
What this means for you Summary
Snapshot
- This is a 12 × 2-bed/?-bath units multifamily listed at $3.69M.
Deal economics
- At list price, monthly cash flow is $36k ($436k/yr) — positive. Per door: $3k/mo.
- The deal already cash-flows at list — no discount required.
- Meets the 1% rule at list price ($77k rent vs $3.69M).
- Recommended offer: $3.47M (6.0% below list) — sets the bar for market timing.
- Cap rate 18.1% vs local median 2.1% in Carlsbad — top-decile yield for the area; either an underpriced asset or a hidden risk that comps aren't pricing in. Stress-test before assuming the spread holds.
Location & tenants
- Location reads 78/100 on livability (#67 in CA, #2,526 nationally) — a middle-class / working-renter tenant base. Strengths: schools A+, amenities A+, commute A+; Watch: health & safety D+, cost of living F.
- Carlsbad Unified (urban): math 68% / reading 76% proficiency, ranked #87 of 1,400 in CA (top 6%) — strong family-tenant draw, lease renewals of 3-5y typical; only 18% free/reduced lunch — higher-income household profile.
- Market conditions: Rents rising (+3.5%/yr); 96 active listings in the ZIP; 20 comparable units currently listed for rent nearby; rentals lingering (median 44d on market — plan ~5-8 weeks vacancy on turnover, expect pricing pressure); 55% of comp listings sitting > 30 days — soft ceiling on asking rent; high-income renter base; 11,759 units permitted in San Diego County in 2024 (7,244 in 5+ unit buildings).
- At $76,831/mo this rent would consume 579% of the median local household income ($159k/yr) (locally 714% of renters already pay >50% of income on rent) — very limited rent-growth headroom before tenants either downsize or default.
Forward outlook
- In year one you build about $90k of equity ($26k loan paydown + $65k appreciation (1.8% local appreciation)).
- San Diego County population projected at +20% by 2050 — long-run rental-demand tailwind backs the buy-and-hold thesis.
- At projected returns (1.8% appreciation + 3.5% rent growth), your $1.03M cash investment doubles in ~2 years — after that, you're playing with house money.
- By year 3, paydown + projected appreciation supports a ~$231k cash-out refi (75% LTV) — recoverable capital for the next deal without selling this one.
Negotiation context
- It's been on market 80 days — a 6% lower offer ($3.47M) is reasonable based on typical stale-listing flexibility.
Risks & watch-outs
- Climate carrying-cost: extreme-heat days projected 7→21/yr by 2055 (HVAC capex compounding) — expect insurance premiums to compound above CPI over the hold.
Questions for the listing agent
- It's been on market 80 days. Have you received any prior offers? Is the seller open to a 6% concession, seller financing, or rate buy-down credit?
- Can we see the unit-by-unit rent roll, current vacancy, and any below-market leases? What's the average tenancy length?
- What capital expenditures (roof, boiler, parking lot, exteriors) have been made in the last 5 years, and what's planned in the next 2?
- Why hasn't it sold? Are there any deal-killer items the seller is aware of (foundation, flood, title, zoning, code violations)?
- Is there a deadline driving the sale (1031 exchange, divorce, estate, relocation)? That informs how much negotiation room exists.
- Schools are A-rated — typically a magnet for longer-tenancy family renters. What's the average tenant stay here, and is there a school-zone premium baked into asking?
- What's the average days-on-market for RENTAL listings here right now (not sales)? A rising rental-DOM trend means longer vacancies and softer asking-rent achievability than the comps imply.
- What's the recent tenant-quality profile in this submarket — average credit score on applications, eviction rate, late-payment / NSF rate, and stable-employment percentage? A property-management company in the area should have these aggregated.
- How much new apartment / multifamily construction is in the pipeline within 1–3 miles? Heavy new supply (>2% of stock underway) typically softens rents 12–24 months out; light construction supports rent growth.
Investment metrics
- 1% rule
- 2.08% ✓
- Cap rate
- 18.09%
- Cash-on-cash
- 42.12%
- DSCR
- 2.87
- GRM
- 4.0
CMA / ARV
No comps found within radius.
Projected returns pro-forma
1.75% appreciation · 3.54% rent growth · sell at horizon
- IRR
- 46.2%
- Equity multiple
- 3.48×
- Total profit
- $2,561,566
- Equity at exit
- $1,407,426
- IRR
- 47.5%
- Equity multiple
- 7.04×
- Total profit
- $6,252,895
- Equity at exit
- $1,989,000
Cash invested: $1,034,600 (down + closing). Projections, not guarantees.
Landlord ↔ Tenant lean methodology
- Overall (STATE)
- 18 Strongly Tenant-Friendly
- State California
- 18 Strongly Tenant-Friendly · D+13
- County
- — inherits STATE
- City
- — inherits STATE
ZIP-level market 92011
- Home prices YoY
- 0.4%
- Rents YoY
- 3.5%
- Active inventory
- 96
- Price-to-rent
- 48.1×
Monthly cashflow live
- Estimated rent
- $76,831 high interval (Pro) →
- Mortgage (P&I)
- −$19,377
- Tax from tax record
- −$3,467 /mo · $41,603/yr
- Insurance
- −$1,540
- HOA
- −$0
- Vacancy / Maint / Mgmt
- −$16,135
- Net cashflow
- $36,313
Break-even live
12-unit breakdown (identical units grouped — click to expand)
| Units | Beds | Baths | Est. rent |
|---|---|---|---|
| 12× units | 2 | — | $76,836 |
| #1 | 2 | — | $6,403 |
| #2 | 2 | — | $6,403 |
| #3 | 2 | — | $6,403 |
| #4 | 2 | — | $6,403 |
| #5 | 2 | — | $6,403 |
| #6 | 2 | — | $6,403 |
| #7 | 2 | — | $6,403 |
| #8 | 2 | — | $6,403 |
| #9 | 2 | — | $6,403 |
| #10 | 2 | — | $6,403 |
| #11 | 2 | — | $6,403 |
| #12 | 2 | — | $6,403 |
| Total (12 units) | $76,831 | ||
UW: 25.0% down · 7.5% · 30yr · 1.5% tax · 5.0% vac · 8.0% maint · 8.0% mgmt
Financing live
Cash to close
- Down payment
- $923,750
- Closing costs
- $110,850
- Reserves months
- —
- Total cash needed
- —
Loan-product check · same deal, 3 products live
Conventional
25% down · 7.5% · 30yr
- Down + closing
- —
- Monthly P&I
- —
- Monthly cashflow
- —
- DSCR
- —
- Eligible?
- —
Personal DTI + credit; lowest rate.
DSCR
20% down · 8.5% · 30yr
- Down + closing
- —
- Monthly P&I
- —
- Monthly cashflow
- —
- DSCR
- —
- Eligible?
- —
No personal income docs; deal must DSCR.
Hard money
10% down · 12.0% · 12mo
- Down + closing
- —
- Monthly P&I
- —
- Monthly cashflow
- —
- DSCR
- —
- Eligible?
- —
Short-term bridge; refi at stabilization.
Rent comps 20 comps
| Address | Beds | Baths | Sqft | Rent | $/sqft | DOM | Units | Dist |
|---|---|---|---|---|---|---|---|---|
| 6790 Embarcadero Ln Carlsbad, CA | 1.0–2.0 | 2.0–2.5 | 2104 | $5,750 | $2.73 | 5d | 1 | 0.06mi |
| 820 Windcrest Dr Carlsbad, CA | 3.0 | 2.0 | 1404 | $5,581 | $3.98 | 18d | 1 | 0.25mi |
| 902 Caminito Madrigal Unit B Carlsbad, CA | 2.0 | 1.0 | 897 | $3,200 | $3.57 | 11d | 1 | 0.42mi |
| 916 Caminito Estrada Unit B Carlsbad, CA | 2.0 | 2.0 | 1188 | $3,650 | $3.07 | 43d | 1 | 0.44mi |
| 908 Caminito Madrigal Carlsbad, CA | 2.0 | 2.0 | 897 | $4,500 | $5.02 | 43d | 1 | 0.46mi |
| 6923 Whitecap Dr Carlsbad, CA | 3.0 | 2.0 | 1246 | $5,250 | $4.21 | 43d | 1 | 0.46mi |
| 6963 Tradewinds Dr Carlsbad, CA | 3.0 | 3.0 | 2261 | $12,500 | $5.53 | 43d | 1 | 0.47mi |
| 6675 Paseo del Norte Unit B Carlsbad, CA | 2.0 | 2.0 | 959 | $4,300 | $4.48 | 43d | 1 | 0.47mi |
| 6675 Paseo del Norte Unit A Carlsbad, CA | 2.0 | 2.0 | 959 | $3,850 | $4.01 | 5d | 1 | 0.47mi |
| 908 Caminito Madrigal Unit D Carlsbad, CA | 2.0 | 1.5 | 897 | $4,500 | $5.02 | 43d | 1 | 0.47mi |
| 6677 Paseo Del Norte Carlsbad, CA | 2.0 | 2.0 | 959 | $4,500 | $4.69 | 43d | 1 | 0.48mi |
| 6677 Paseo del Norte Unit B Carlsbad, CA | 2.0 | 1.0 | 959 | $3,950 | $4.12 | 43d | 1 | 0.48mi |
| 925 Wind Drift Dr Carlsbad, CA | 2.0 | 2.5 | 1110 | $3,895 | $3.51 | 43d | 1 | 0.54mi |
| 6555 Sea Gate Rd Carlsbad, CA | 2.0 | 2.0 | 1114 | $4,095 | $3.67 | 1d | 3 | 0.54mi |
| 7064 Whitewater St Carlsbad, CA | 3.0 | 2.5 | 2050 | $8,500 | $4.15 | 43d | 1 | 0.70mi |
| 6811 Alderwood Dr Carlsbad, CA | 2.0 | 2.0 | 1292 | $3,850 | $2.98 | 43d | 1 | 0.70mi |
| 6938 Seascape Dr Carlsbad, CA | 1.0–2.0 | 1.0–2.0 | 810 | $3,775 | $4.66 | 3d | 9 | 0.71mi |
| 6910 Peachtree Rd Unit 1546353P Carlsbad, CA | 3.0 | 2.0 | 1399 | $6,129 | $4.38 | 16d | 1 | 0.85mi |
| 6908 Peachtree Rd Unit 1307615P Carlsbad, CA | 3.0 | 2.5 | — | $7,326 | — | 24d | 1 | 0.85mi |
| 1205 Aviara Pkwy Carlsbad, CA | 1.0–2.0 | 1.0–2.0 | 917 | $4,880 | $5.32 | 2d | 42 | 1.15mi |
Listing history 4 events
-
2026-04-23status Pending
-
2026-03-19price $3,695,000
-
2026-02-03$3,995,000 Active
-
2022-10-13soldstatus $3,700,000
ⓘ Source: listings_history table (triggers on properties + properties_extension) + one-shot
backfill from property_details.listing_events for pre-trigger history.
Tax reassessment forecast CA · Resets to sale price
- Current annual tax
- $41,603 · $3,467/mo
- Projected year-2 tax
- $41,603 · $3,467/mo
- Expected delta
- $0/yr ($0/mo · 0.0%)
ⓘ Screening estimate from a state-policy table — verify with the county assessor before closing.
Climate risk First Street
- Flood 1/10 Low FEMA zone X (unshaded) · 0% chance over 30 yrs
- Wildfire 1/10 Low
- Heat 5/10 Major 7 d/yr ≥84°F today · 21 d/yr by 30 yrs out
- Wind 1/10 Low
- Air quality 3/10 Moderate 4 unhealthy d/yr today · 4 by 30 yrs out
Nearby sold comps map
Loading sold comps map…
Walkable amenities ~0.75 mi
Loading nearby amenities…
Taxation est. · year 1
- Rental income
- $921,972
- − Mortgage interest
- −$206,977
- − Property taxes
- −$41,603
- − Insurance
- −$18,475
- − Repairs & maintenance
- −$73,758
- − Management
- −$73,758
- − Depreciation
- −$107,491
- Taxable income
- $399,910
- Est. tax owed @ 24.0%
- −$95,978
- After-tax cash flow
- $339,778/yr
For passive investors: Depreciation is non-cash, so a rental often shows a tax loss while cash-flowing — sheltering income. Rental losses are passive: they offset passive income freely, and up to $25,000/yr can offset ordinary (W-2) income if you actively participate and your MAGI is under $100k (phasing out to $0 by $150k); unused losses carry forward. On sale, claimed depreciation is recaptured at up to 25%, and gains may owe capital-gains tax (a 1031 exchange can defer both). Figures are a year-1 estimate at your 24.0% rate — not tax advice; consult a CPA.
Schools (NCES district)
- District
- Carlsbad Unified
- NCES district ID
- 0607500
- Math proficiency
- 68% ▲ 2.00%
- Reading proficiency
- 76% ▲ 2.00%
- Median HH income
- $81,200
- Composite
- 65.11/100
- National rank
- #1068
- State rank
- #87 of 1400 in CA
Livability — Carlsbad
- Score
- 78/100
- State rank
- #67
- US rank
- #2526
Category grades
Schools grade is shown separately in the Schools card above.
Census & demographics
- Census place
- Carlsbad, CA
- County
- San Diego County · 3,178,799 people
- City population
- 114,373
- Metro
- San Diego-Chula Vista-Carlsbad, CA
- Population (ZIP)
- 23,190
- Household income
- $159,235
- Rent vs Own
- Severe rent burden
- 714.0
Population outlook (San Diego County) Hauer SSP2
- Today (2025)
- 3,678,185 people
- By 2030
- 3,856,546 · +4.8%
- By 2040
- 4,171,407 · +13.4%
- By 2050
- 4,421,607 · +20.2%
- By 2075
- 4,831,599 · +31.4%
- By 2100
- 4,832,502 · +31.4%
Race, ethnicity, and origin ACS 2023
- Neighborhood character
- Majority White (64%)
- Race & ethnicity
- White 64% Hispanic / Latino 17% Two or more races 15% Asian 12%
- Hispanic origin (detail)
- Mexican 12%
- Common ancestry
- Portuguese 4% Slovak 3% Italian 3%
- Foreign-born
- 16% · Canada, China, Vietnam
- Languages at home
- 82% English-only · Spanish 6% Chinese 4% German/W. Germanic 2%
Political lean MEDSL · San Diego
- 2024 margin
- D (+16.8) · D 56.9% · R 40.1% · Other 2.9%
- 2008→2024 swing
- +6.6pp toward D · 2008: 10.2pp · 2024: 16.8pp
- All cycles
- 2024: D+16.8 2020: D+22.8 2016: D+17.8 2012: D+5.1 2008: D+10.2
Not yet ingested
- Civics
- —
Market trends
- HPI YoY
- ▲ 1.75%
- Current HPI
- 399.8502
- Rent YoY
- ▲ 3.54%
- Metro
- San Diego-Chula Vista-Carlsbad, CA
- State GDP YoY
- ▲ 3.21%
- F500 in state
- 116
Industry mix (Fortune 500 HQ in CA)
| Industry | F500 HQs | Revenue |
|---|---|---|
| Technology | 27 | $1,492B |
|
||
| Financial Services | 3 | $174B |
|
||
| Retail | 3 | $44B |
|
||
| Insurance | 3 | $26B |
|
||
| Media / Entertainment | 2 | $115B |
|
||
| Pharmaceuticals / Biotech | 2 | $62B |
|
||
Price history
-0.1% since first listed4 events — show timeline
- 2026-04-23 Pending — SDMLS
- 2026-03-19 Price Changed $3,695,000 SDMLS
- 2026-02-03 Listed $3,995,000 SDMLS
- 2022-10-13 Sold (Public Records) $3,700,000 Public Records
Property tax history
+6.2%/yrLatest (2025): $41,603 · +3.6% YoY. Source: county tax records.
Cash-flow waterfall
monthlySold comps — $/sqft
last 12 mo · ≤1 miLoading sold comps…