1263 W Saguaro St · Swift Trail Junction, AZ
Flood risk 1/10 · Minimal
- FEMA flood zone
- X (unshaded)
- Chance of flooding over 30 yrs
- 0.0%
- Est. flood insurance / yr
- $507 – $1,088
Fire risk 7/10 · Major
- Est. fire insurance / yr
- $610 – $1,132
Heat risk 7/10 · Major
- Hot days now (above 102°F)
- 6 days/yr
- Hot days in 30 yrs
- 17 days/yr
Wind risk 1/10 · Minimal
- Chance of severe wind over 30 yrs
- —
Air-quality risk 1/10 · Minimal
- Unhealthy air days now
- 0 days/yr
- Unhealthy air days in 30 yrs
- 0 days/yr
Risk factors via First Street. Map © Google.
Why this score? — see what drove the B+ grade
The composite is a weighted blend of 9 inputs, each scored 0–100. Each bar is that input's sub-score; the figure is the points it added to the 100-point composite (weight × sub-score).
- Cash flow +30.0/30.0
- ARV discount +15.0/15.0
- 1% rule +10.0/10.0
- DSCR +10.0/10.0
- Schools +3.0/10.0
- Livability +2.9/5.0
- Rent growth +2.5/5.0
- Condition / age +2.5/5.0
- Appreciation +0.0/10.0
$85,000
🖨 Deal sheet 📄 Offer letter ✓ Due diligence
Listing remarks MLS
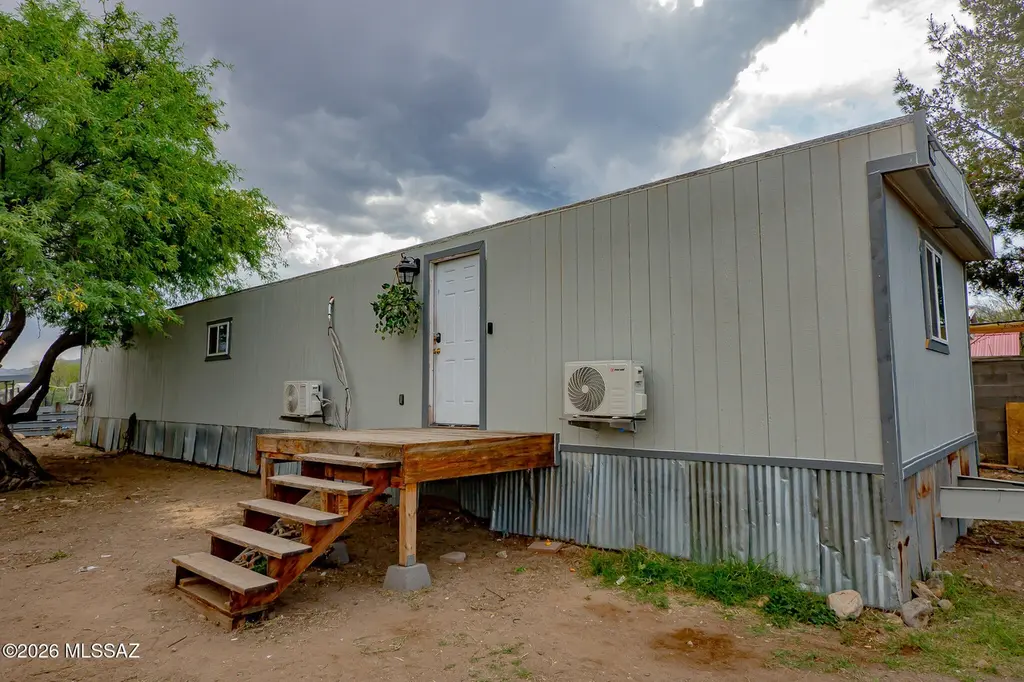
Updated and move-in ready, this singlewide in Thunderbird Mobile Estates offers a solid combination of upgrades and comfort. Major improvements include updated wiring, mostly new plumbing, new windows, new exterior siding and trim, and ceramic tile flooring throughout.The home is equipped with three mini-split systems for efficient heating and cooling, along with a tankless gas water heater. The kitchen has been refreshed with new cabinetry, creating a clean and functional space. Outside, you'll find a storage shed, a large shade tree, and a small deck at the entrance, perfect for enjoying the outdoor space. Located in Thunderbird Mobile Estates just south of Safford, this property provides an affordable option with many of the big-ticket updates already completed.Kennel does not convey
Key facts
- New plumbing
- Updated wiring
- Mini-split systems
Tags
Neighborhood map
What this means for you Summary
Snapshot
- This is a 2-bed/2.0-bath manufactured listed at $85k.
Deal economics
- At list price, monthly cash flow is $641 ($8k/yr) — positive.
- The deal already cash-flows at list — no discount required.
- Meets the 1% rule at list price ($2k rent vs $85k).
- Recommended offer: $80k (6.0% below list) — sets the bar for market timing.
Location & tenants
- Location reads 57/100 on livability (#232 in AZ) — a working-class tenant base; expect higher turnover. Strengths: cost of living A+, housing A, crime B+; Watch: schools F, amenities F, commute F.
- Safford Unified District (4218) (town): math 33% / reading 38% proficiency, ranked #88 of 249 in AZ (top 35%) — families likely to look elsewhere, expect single-tenant / working-renter base with shorter leases.
- Market conditions: 61 active listings in the ZIP; 137 units permitted in Graham County in 2024 (0 in 5+ unit buildings).
Forward outlook
- Local home prices are declining (-3.0%/yr); year-one equity from $588 of loan paydown is wiped out by about $3k of value loss. Plan a longer hold.
- Graham County population projected at +7% by 2050 — modest demand growth; plan on rents tracking national, not racing it.
- At projected returns (-3.0% appreciation + 3.0% rent growth), your $24k cash investment doubles in ~4 years — after that, you're playing with house money.
Negotiation context
- It's been on market 76 days — a 6% lower offer ($80k) is reasonable based on typical stale-listing flexibility.
- Current owner paid $16k; list at $85k implies a 431% gain — meaningful room to come down on a strong offer.
Risks & watch-outs
- Climate carrying-cost: major wildfire risk; extreme-heat days projected 6→17/yr by 2055 (HVAC capex compounding) — expect insurance premiums to compound above CPI over the hold.
Questions for the listing agent
- It's been on market 76 days. Have you received any prior offers? Is the seller open to a 6% concession, seller financing, or rate buy-down credit?
- Built in 1979 — when were the roof, HVAC, electrical panel, plumbing, and water heater last replaced?
- Why hasn't it sold? Are there any deal-killer items the seller is aware of (foundation, flood, title, zoning, code violations)?
- Is there a deadline driving the sale (1031 exchange, divorce, estate, relocation)? That informs how much negotiation room exists.
- Schools are F-rated, which usually means shorter tenancies and higher turnover. Who's the typical renter profile here, and what's been the actual vacancy rate?
- What's the average days-on-market for RENTAL listings here right now (not sales)? A rising rental-DOM trend means longer vacancies and softer asking-rent achievability than the comps imply.
- What's the recent tenant-quality profile in this submarket — average credit score on applications, eviction rate, late-payment / NSF rate, and stable-employment percentage? A property-management company in the area should have these aggregated.
- How much new for-sale + rental construction is in the pipeline within 1–3 miles? Heavy new supply typically softens prices + rents 12–24 months out; constrained supply supports both.
Investment metrics
- 1% rule
- 1.83% ✓
- Cap rate
- 15.35%
- Cash-on-cash
- 32.33%
- DSCR
- 2.44
- GRM
- 4.6
CMA / ARV
- ARV (on-the-fly)
- $106,820
- Comps found
- 1
Show comp detail 1 sale within ~0.75 mi
| Address | Dist | Beds/Ba | Sqft | Sold | Price | $/sf | Match |
|---|---|---|---|---|---|---|---|
| 922 W Cactus St | 0.30mi | 2/1.5 | 1,040 (+6%) | 20mo | $113,000 | $109 | 58 |
Match score weights: distance 35% · size 25% · config 20% · recency 20%. Top-matched comps best support the ARV.
Projected returns pro-forma
-3.0% appreciation · 3.0% rent growth · sell at horizon
- IRR
- 27.4%
- Equity multiple
- 2.14×
- Total profit
- $27,089
- Equity at exit
- $12,674
- IRR
- 34.9%
- Equity multiple
- 4.20×
- Total profit
- $76,271
- Equity at exit
- $7,349
Cash invested: $23,800 (down + closing). Projections, not guarantees.
Landlord ↔ Tenant lean methodology
- Overall (STATE)
- 87 Strongly Landlord-Friendly
- State Arizona
- 87 Strongly Landlord-Friendly · R+3
- County
- — inherits STATE
- City
- — inherits STATE
ZIP-level market 85546
- Home prices YoY
- -17.1%
- Active inventory
- 61
- Price-to-rent
- 4.6×
Monthly cashflow live
- Estimated rent
- $1,555 medium interval (Pro) →
- Mortgage (P&I)
- −$446
- Tax est. 1.5%
- −$106 /mo · $1,275/yr
- Insurance
- −$35
- HOA
- −$0
- Vacancy / Maint / Mgmt
- −$327
- Net cashflow
- $641
Break-even live
UW: 25.0% down · 7.5% · 30yr · 1.5% tax · 5.0% vac · 8.0% maint · 8.0% mgmt
Financing live
Cash to close
- Down payment
- $21,250
- Closing costs
- $2,550
- Reserves months
- —
- Total cash needed
- —
Loan-product check · same deal, 3 products live
Conventional
25% down · 7.5% · 30yr
- Down + closing
- —
- Monthly P&I
- —
- Monthly cashflow
- —
- DSCR
- —
- Eligible?
- —
Personal DTI + credit; lowest rate.
DSCR
20% down · 8.5% · 30yr
- Down + closing
- —
- Monthly P&I
- —
- Monthly cashflow
- —
- DSCR
- —
- Eligible?
- —
No personal income docs; deal must DSCR.
Hard money
10% down · 12.0% · 12mo
- Down + closing
- —
- Monthly P&I
- —
- Monthly cashflow
- —
- DSCR
- —
- Eligible?
- —
Short-term bridge; refi at stabilization.
Listing history 18 events
-
2026-06-19days on market $85,000 Active 76 DOM
-
2026-06-18days on market $85,000 Active 75 DOM
-
2026-06-17days on market $85,000 Active 74 DOM
-
2026-06-16days on market $85,000 Active 73 DOM
-
2026-06-15days on market $85,000 Active 72 DOM
-
2026-06-14days on market $85,000 Active 70 DOM
-
2026-06-12days on market $85,000 Active 69 DOM
-
2026-06-09days on market $85,000 Active 66 DOM
-
2026-06-08days on market $85,000 Active 65 DOM
-
2026-06-07days on market $85,000 Active 64 DOM
-
2026-06-07days on market $85,000 Active 63 DOM
-
2026-06-04days on market $85,000 Active 60 DOM
-
2026-06-02days on market $85,000 Active 59 DOM
-
2026-06-01days on market $85,000 Active 58 DOM
-
2026-05-31days on market $85,000 Active 57 DOM
-
2026-05-31days on market $85,000 Active 56 DOM
-
2026-04-04$85,000 Active 797-char remark
Show marketing remark (797 chars)
Updated and move-in ready, this singlewide in Thunderbird Mobile Estates offers a solid combination of upgrades and comfort. Major improvements include updated wiring, mostly new plumbing, new windows, new exterior siding and trim, and ceramic tile flooring throughout.The home is equipped with three mini-split systems for efficient heating and cooling, along with a tankless gas water heater. The kitchen has been refreshed with new cabinetry, creating a clean and functional space. Outside, you'll find a storage shed, a large shade tree, and a small deck at the entrance, perfect for enjoying the outdoor space. Located in Thunderbird Mobile Estates just south of Safford, this property provides an affordable option with many of the big-ticket updates already completed.Kennel does not convey
-
2024-04-15soldstatus $16,000
ⓘ Source: listings_history table (triggers on properties + properties_extension) + one-shot
backfill from property_details.listing_events for pre-trigger history.
Climate risk First Street
- Flood 1/10 Low FEMA zone X (unshaded) · 0% chance over 30 yrs
- Wildfire 7/10 Severe
- Heat 7/10 Severe 6 d/yr ≥102°F today · 17 d/yr by 30 yrs out
- Wind 1/10 Low
- Air quality 1/10 Low 0 unhealthy d/yr today · 0 by 30 yrs out
Nearby sold comps map
Loading sold comps map…
Walkable amenities ~0.75 mi
Loading nearby amenities…
Taxation est. · year 1
- Rental income
- $18,663
- − Mortgage interest
- −$4,761
- − Property taxes
- −$1,275
- − Insurance
- −$425
- − Repairs & maintenance
- −$1,493
- − Management
- −$1,493
- − Depreciation
- −$2,473
- Taxable income
- $6,743
- Est. tax owed @ 24.0%
- −$1,618
- After-tax cash flow
- $6,076/yr
For passive investors: Depreciation is non-cash, so a rental often shows a tax loss while cash-flowing — sheltering income. Rental losses are passive: they offset passive income freely, and up to $25,000/yr can offset ordinary (W-2) income if you actively participate and your MAGI is under $100k (phasing out to $0 by $150k); unused losses carry forward. On sale, claimed depreciation is recaptured at up to 25%, and gains may owe capital-gains tax (a 1031 exchange can defer both). Figures are a year-1 estimate at your 24.0% rate — not tax advice; consult a CPA.
Schools (NCES district)
- District
- Safford Unified District (4218)
- NCES district ID
- 0407240
- Math proficiency
- 33% ▼ -14.00%
- Reading proficiency
- 38% ▼ -7.00%
- Median HH income
- $46,177
- Composite
- 30.38/100
- National rank
- #6252
- State rank
- #88 of 249 in AZ
Livability — Swift Trail Junction
- Score
- 57/100
- State rank
- #232
- US rank
- #22079
Category grades
Schools grade is shown separately in the Schools card above.
Census & demographics
- Census place
- Swift Trail Junction, AZ
- Population (ZIP)
- 20,735
Population outlook (Graham County) Hauer SSP2
- Today (2025)
- 38,473 people
- By 2030
- 38,805 · +0.9%
- By 2040
- 39,728 · +3.3%
- By 2050
- 41,005 · +6.6%
- By 2075
- 43,529 · +13.1%
- By 2100
- 42,097 · +9.4%
Race, ethnicity, and origin ACS 2023
- Neighborhood character
- Majority White (52%)
- Race & ethnicity
- White 52% Hispanic / Latino 43% Two or more races 17% Native American 2% Black 2% Pacific Islander 1%
- Hispanic origin (detail)
- Mexican 38%
- Common ancestry
- Lithuanian 2% German 1% Scottish 1%
- Foreign-born
- 3% · Canada
- Languages at home
- 82% English-only · Spanish 16%
Political lean MEDSL · Graham
- 2024 margin
- Solid R (+48.1) · D 25.5% · R 73.6%
- 2008→2024 swing
- -7.4pp toward R · 2008: -40.7pp · 2024: -48.1pp
- All cycles
- 2024: R+48.1 2020: R+44.8 2016: R+39.6 2012: R+37.7 2008: R+40.7
Not yet ingested
- Civics
- —
Market trends
- HPI YoY
- ▼ -62.86%
- Current HPI
- 303.9835
- Rent YoY
- —
- Metro
- —
- State GDP YoY
- ▲ 4.54%
- F500 in state
- 20
Industry mix (Fortune 500 HQ in AZ)
| Industry | F500 HQs | Revenue |
|---|---|---|
| Technology | 2 | $13B |
|
||
| Mining / Metals | 1 | $23B |
|
||
| Environmental Services | 1 | $16B |
|
||
| Metals / Steel | 1 | $14B |
|
||
| Technology Distribution | 1 | $9B |
|
||
| Homebuilding | 1 | $8B |
|
||
Price history
+431.2% since first listed2 events — show timeline
- 2026-04-04 Listed $85,000 MLSSAZ
- 2024-04-15 Sold (Public Records) $16,000 Public Records
Property tax history
-1.0%/yrLatest (2025): $148 · +19.0% YoY. Source: county tax records.
Cash-flow waterfall
monthlySold comps — $/sqft
last 12 mo · ≤1 miLoading sold comps…