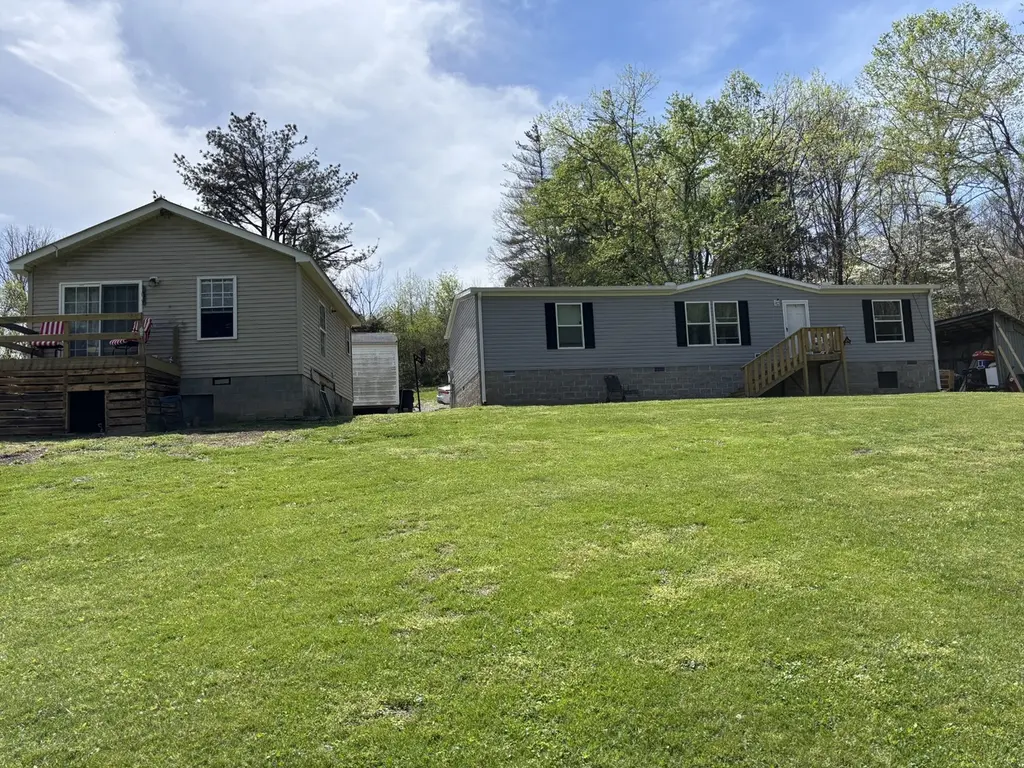
1417 Coolidge Rd · Lafayette, TN
Flood risk 3/10 · Minor
- FEMA flood zone
- X (unshaded)
- Chance of flooding over 30 yrs
- 0.2%
- Est. flood insurance / yr
- $507 – $1,088
Fire risk 4/10 · Minor
- Est. fire insurance / yr
- $949 – $1,763
Heat risk 5/10 · Moderate
- Hot days now (above 109°F)
- 7 days/yr
- Hot days in 30 yrs
- 20 days/yr
Wind risk 3/10 · Minor
- Chance of severe wind over 30 yrs
- 5.0%
Air-quality risk 2/10 · Minimal
- Unhealthy air days now
- 1 days/yr
- Unhealthy air days in 30 yrs
- 2 days/yr
Risk factors via First Street. Map © Google.
Why this score? — see what drove the F grade
The composite is a weighted blend of 9 inputs, each scored 0–100. Each bar is that input's sub-score; the figure is the points it added to the 100-point composite (weight × sub-score).
- Appreciation +10.0/10.0
- ARV discount +7.5/15.0
- Cash flow +3.6/30.0
- Livability +3.4/5.0
- Schools +2.6/10.0
- Rent growth +2.5/5.0
- Condition / age +2.5/5.0
- 1% rule +0.0/10.0
- DSCR +0.0/10.0
$262,500
🖨 Deal sheet 📄 Offer letter ✓ Due diligence
Listing remarks MLS
INVESTMENT OPPERTUNITY 2 HOMES 1 small house 1 bedroom and 1 bath plus a single wide 2 bedroom 1 bath-recent upgrades -sitting on 1.4 acres -private but close to town
Key facts
- 1.3 acre lot
- Built 2025
- Listed 26 days
Property features AI
Exterior
- Parking: No covered or designated parking spaces listed
- Utilities: Public water available; Septic tank; Electric service available
- Home design: Manufactured on land (residential); Single-story
- Construction: Vinyl siding exterior; Block foundation; Existing year built (not specified)
- Exterior features: 1.3-acre lot
Interior
- Kitchen: Electric oven; Range; Dishwasher; Microwave; Refrigerator
- Bedrooms: Three bedrooms (all on the main level)
- Flooring: Laminate
- Bathrooms: Two full bathrooms
- Heating & cooling: Central heating; Central air (electric)
- Interior features: Crawl space basement; Laminate flooring
Neighborhood map
What this means for you Summary
Snapshot
- This is a 3-bed/1.0-bath single-family listed at $262k.
Deal economics
- At list price, monthly cash flow is $-784 ($-9k/yr) — negative.
- To cash-flow at today's rent, offer at most $149k (43.2% below list).
- To meet the 1% rule (rent ≥ 1% of price), the offer needs to be $130k (50.3% below list).
- Recommended offer: $130k (50.3% below list) — sets the bar for 1% rule.
Location & tenants
- Location reads 68/100 on livability (#80 in TN) — a middle-class / working-renter tenant base. Strengths: cost of living A+, health & safety A+, crime A-; Watch: amenities F, commute F, employment F.
- Macon County (rural): math 34% / reading 29% proficiency, ranked #53 of 139 in TN (top 38%) — families likely to look elsewhere, expect single-tenant / working-renter base with shorter leases.
- Zoned schools: Fairlane Elementary (532 students, 0% FRL); Macon County High School (math 21% / reading 32%, grade F, #112 of 332 statewide, top 35%, 967 students, 0% FRL) — zoned schools average 0% FRL vs 53% district-wide (53 pts lower); this property's tenant base skews higher-income than the district average.
- Market conditions: 175 active listings in the ZIP; 181 units permitted in Macon County in 2024 (10 in 5+ unit buildings).
Forward outlook
- In year one you build about $28k of equity ($2k loan paydown + $26k appreciation (10.0% local appreciation)).
- Macon County population projected at +13% by 2050 — modest demand growth; plan on rents tracking national, not racing it.
- By year 2, paydown + projected appreciation supports a ~$45k cash-out refi (75% LTV) — recoverable capital for the next deal without selling this one.
Negotiation context
- It's been on market 27 days — a 2% lower offer ($259k) is reasonable based on typical stale-listing flexibility.
- 9 sale attempts since 13y ago with the ask held roughly flat each time — persistent listings suggest the price (not the market) is what's stuck; bring a comps-based counter.
- Current owner paid $28k; list at $262k implies a 855% gain — meaningful room to come down on a strong offer.
Risks & watch-outs
- Climate carrying-cost: extreme-heat days projected 7→20/yr by 2055 (HVAC capex compounding) — expect insurance premiums to compound above CPI over the hold.
Questions for the listing agent
- What do current leases actually rent for vs. the listed asking? Can we see a recent rent roll and the last 12 months of T-12 income?
- Is there a deadline driving the sale (1031 exchange, divorce, estate, relocation)? That informs how much negotiation room exists.
- Schools are F-rated, which usually means shorter tenancies and higher turnover. Who's the typical renter profile here, and what's been the actual vacancy rate?
- The area grade is low — what's the realistic commute time and amenity access for the typical tenant pool here? Any planned neighborhood developments (good or bad) we should know about?
- What's the average days-on-market for RENTAL listings here right now (not sales)? A rising rental-DOM trend means longer vacancies and softer asking-rent achievability than the comps imply.
- What's the recent tenant-quality profile in this submarket — average credit score on applications, eviction rate, late-payment / NSF rate, and stable-employment percentage? A property-management company in the area should have these aggregated.
- How much new for-sale + rental construction is in the pipeline within 1–3 miles? Heavy new supply typically softens prices + rents 12–24 months out; constrained supply supports both.
Investment metrics
- 1% rule
- 0.50% ✗
- Cap rate
- 2.71%
- Cash-on-cash
- -12.79%
- DSCR
- 0.43
- GRM
- 16.8
CMA / ARV
No comps found within radius.
Projected returns pro-forma
10.0% appreciation · 3.0% rent growth · sell at horizon
- IRR
- 15.4%
- Equity multiple
- 2.27×
- Total profit
- $93,073
- Equity at exit
- $236,481
- IRR
- 15.0%
- Equity multiple
- 5.26×
- Total profit
- $313,373
- Equity at exit
- $509,980
Cash invested: $73,500 (down + closing). Projections, not guarantees.
Landlord ↔ Tenant lean methodology
- Overall (STATE)
- 87 Strongly Landlord-Friendly
- State Tennessee
- 87 Strongly Landlord-Friendly · R+13
- County
- — inherits STATE
- City
- — inherits STATE
ZIP-level market 37083
- Home prices YoY
- 8.8%
- Active inventory
- 175
- Price-to-rent
- 16.8×
Monthly cashflow live
- Estimated rent
- $1,304 medium interval (Pro) →
- Mortgage (P&I)
- −$1,377
- Tax est. 1.5%
- −$328 /mo · $3,938/yr
- Insurance
- −$109
- HOA
- −$0
- Vacancy / Maint / Mgmt
- −$274
- Net cashflow
- $-784
Break-even live
UW: 25.0% down · 7.5% · 30yr · 1.5% tax · 5.0% vac · 8.0% maint · 8.0% mgmt
Financing live
Cash to close
- Down payment
- $65,625
- Closing costs
- $7,875
- Reserves months
- —
- Total cash needed
- —
Loan-product check · same deal, 3 products live
Conventional
25% down · 7.5% · 30yr
- Down + closing
- —
- Monthly P&I
- —
- Monthly cashflow
- —
- DSCR
- —
- Eligible?
- —
Personal DTI + credit; lowest rate.
DSCR
20% down · 8.5% · 30yr
- Down + closing
- —
- Monthly P&I
- —
- Monthly cashflow
- —
- DSCR
- —
- Eligible?
- —
No personal income docs; deal must DSCR.
Hard money
10% down · 12.0% · 12mo
- Down + closing
- —
- Monthly P&I
- —
- Monthly cashflow
- —
- DSCR
- —
- Eligible?
- —
Short-term bridge; refi at stabilization.
Listing history 4 events
-
2026-06-03days on market $262,500 Active 27 DOM
-
2026-06-02days on market $262,500 Active 26 DOM
-
2026-06-01remarks 110-char remark
-
2026-06-01$262,500 Active 25 DOM
ⓘ Source: listings_history table (triggers on properties + properties_extension) + one-shot
backfill from property_details.listing_events for pre-trigger history.
Climate risk First Street
- Flood 3/10 Moderate FEMA zone X (unshaded) · 20% chance over 30 yrs
- Wildfire 4/10 Moderate
- Heat 5/10 Major 7 d/yr ≥109°F today · 20 d/yr by 30 yrs out
- Wind 3/10 Moderate 5% chance of damaging wind over 30 yrs
- Air quality 2/10 Low 1 unhealthy d/yr today · 2 by 30 yrs out
Nearby sold comps map
Loading sold comps map…
Walkable amenities ~0.75 mi
Loading nearby amenities…
Taxation est. · year 1
- Rental income
- $15,652
- − Mortgage interest
- −$14,704
- − Property taxes
- −$3,938
- − Insurance
- −$1,312
- − Repairs & maintenance
- −$1,252
- − Management
- −$1,252
- − Depreciation
- −$7,636
- Taxable loss
- −$14,443
- Est. tax savings @ 24.0%
- +$3,466
- After-tax cash flow
- $-5,938/yr
For passive investors: Depreciation is non-cash, so a rental often shows a tax loss while cash-flowing — sheltering income. Rental losses are passive: they offset passive income freely, and up to $25,000/yr can offset ordinary (W-2) income if you actively participate and your MAGI is under $100k (phasing out to $0 by $150k); unused losses carry forward. On sale, claimed depreciation is recaptured at up to 25%, and gains may owe capital-gains tax (a 1031 exchange can defer both). Figures are a year-1 estimate at your 24.0% rate — not tax advice; consult a CPA.
Schools (NCES district)
- District
- Macon County
- NCES district ID
- 4702550
- Math proficiency
- 34% ▼ -4.00%
- Reading proficiency
- 29% ▼ -3.00%
- Median HH income
- $34,280
- Composite
- 25.97/100
- National rank
- #7329
- State rank
- #53 of 139 in TN
Livability — Lafayette
- Score
- 68/100
- State rank
- #80
- US rank
- #9247
Category grades
Schools grade is shown separately in the Schools card above.
Census & demographics
- Population (ZIP)
- 16,887
Population outlook (Macon County) Hauer SSP2
- Today (2025)
- 24,618 people
- By 2030
- 25,337 · +2.9%
- By 2040
- 26,739 · +8.6%
- By 2050
- 27,822 · +13.0%
- By 2075
- 30,614 · +24.4%
- By 2100
- 31,851 · +29.4%
Race, ethnicity, and origin ACS 2023
- Neighborhood character
- Predominantly White (88%)
- Race & ethnicity
- White 88% Hispanic / Latino 9% Two or more races 7%
- Hispanic origin (detail)
- Mexican 7%
- Common ancestry
- Italian 1% Slovak 1% Serbian 1%
- Foreign-born
- 3% · Canada
- Languages at home
- 95% English-only · Spanish 5%
Political lean MEDSL · Macon
- 2024 margin
- Solid R (+74.3) · D 12.4% · R 86.7%
- 2008→2024 swing
- -54.8pp toward R · 2008: -19.6pp · 2024: -74.3pp
- All cycles
- 2024: R+74.3 2020: R+71.6 2016: R+69.3 2012: R+53.7 2008: R+19.6
Not yet ingested
- Civics
- —
Market trends
- HPI YoY
- ▲ 31.33%
- Current HPI
- 388.8726
- Rent YoY
- —
- Metro
- —
- State GDP YoY
- ▲ 2.78%
- F500 in state
- 22
Industry mix (Fortune 500 HQ in TN)
| Industry | F500 HQs | Revenue |
|---|---|---|
| Healthcare | 3 | $91B |
|
||
| Retail | 3 | $72B |
|
||
| Transportation / Logistics | 1 | $88B |
|
||
| Paper / Packaging | 1 | $19B |
|
||
| Insurance | 1 | $13B |
|
||
| Energy | 1 | $12B |
|
||
Price history
+872.2% since first listed20 events — show timeline
- 2026-06-01 Relisted — REALTRACS as Distributed by MLS Grid
- 2026-04-09 Listed $262,500 REALTRACS as Distributed by MLS Grid
- 2026-04-07 Coming Soon $262,500 REALTRACS as Distributed by MLS Grid
- 2025-04-03 Listing Removed — REALTRACS as Distributed by MLS Grid
- 2025-04-03 Listing Removed — REALTRACS as Distributed by MLS Grid
- 2025-03-06 Relisted — REALTRACS as Distributed by MLS Grid
- 2025-03-06 Relisted — REALTRACS as Distributed by MLS Grid
- 2025-03-01 Listing Removed — REALTRACS as Distributed by MLS Grid
- 2025-03-01 Listing Removed — REALTRACS as Distributed by MLS Grid
- 2025-01-20 Relisted — REALTRACS as Distributed by MLS Grid
- 2025-01-20 Relisted — REALTRACS as Distributed by MLS Grid
- 2025-01-10 Listing Removed — REALTRACS as Distributed by MLS Grid
- 2025-01-10 Listing Removed — REALTRACS as Distributed by MLS Grid
- 2024-10-14 Listed $149,900 REALTRACS as Distributed by MLS Grid
- 2024-10-14 Listed $149,900 REALTRACS as Distributed by MLS Grid
- 2013-08-21 Listing Removed — REALTRACS as Distributed by MLS Grid
- 2013-08-21 Sold (MLS) $27,500 REALTRACS as Distributed by MLS Grid
- 2013-08-21 Sold (MLS) $27,500 REALTRACS as Distributed by MLS Grid
- 2013-06-19 Listed $38,900 REALTRACS as Distributed by MLS Grid
- 1999-08-20 Sold (Public Records) $27,000 Public Records
Property tax history
+2.3%/yrLatest (2025): $351 · +0.0% YoY. Source: county tax records.
Cash-flow waterfall
monthlySold comps — $/sqft
last 12 mo · ≤1 miLoading sold comps…