 🌊 Lakefront
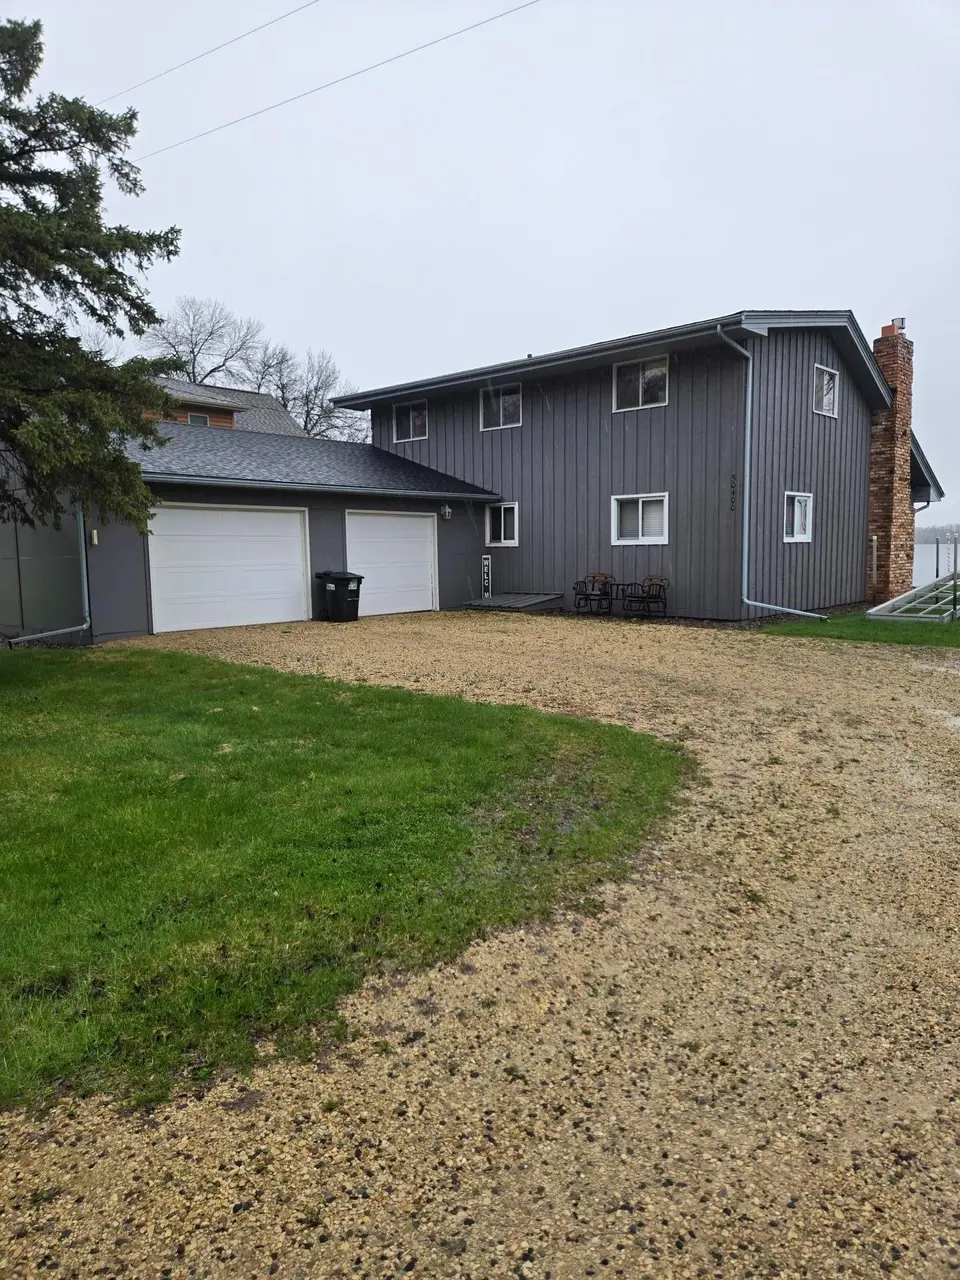
50400 Bayside Ave · Harris, MN
Flood risk 9/10 · Severe
- FEMA flood zone
- X (unshaded)
- Chance of flooding over 30 yrs
- 0.99%
- Est. flood insurance / yr
- $507 – $1,088
Fire risk 1/10 · Minimal
- Est. fire insurance / yr
- $888 – $1,650
Heat risk 2/10 · Minimal
- Hot days now (above 97°F)
- 7 days/yr
- Hot days in 30 yrs
- 13 days/yr
Wind risk 1/10 · Minimal
- Chance of severe wind over 30 yrs
- —
Air-quality risk 2/10 · Minimal
- Unhealthy air days now
- 1 days/yr
- Unhealthy air days in 30 yrs
- 1 days/yr
Risk factors via First Street. Map © Google.
Why this score? — see what drove the F grade
The composite is a weighted blend of 9 inputs, each scored 0–100. Each bar is that input's sub-score; the figure is the points it added to the 100-point composite (weight × sub-score).
- Cash flow +7.7/30.0
- ARV discount +7.5/15.0
- Schools +3.7/10.0
- Livability +3.0/5.0
- Rent growth +2.5/5.0
- Condition / age +2.5/5.0
- 1% rule +2.1/10.0
- DSCR +1.8/10.0
- Appreciation +1.3/10.0
$400,000
🖨 Deal sheet 📄 Offer letter ✓ Due diligence
Listing remarks
Here is a 4 bedroom 1 bathroom home on West Rush Lake. Home needs work.
Key facts
- 0.24 acre lot
- 2 garage spots
- Built 1965
Property features AI
Finance
- Other: On waterfront (lake front) with sandy lake bottom; Road between home and water: no; Road frontage on county road and unpaved streets; public road maintenance
Exterior
- Parking: Attached garage with automatic door opener; 2-car garage (approx. 30 x 28); Gravel parking areas
- Utilities: Well water; Private sewer (holding tank); 100 amp electric service with circuit breakers; Propane fuel
- Home design: Residential property; One and a half stories; Main floor primary bedroom; Pitched asphalt roof (age 8 years or less)
- Construction: Block construction; Block foundation
- Exterior features: Deck; Side porch; Dock with lake access; Panoramic lake view; Light tree coverage; No fencing
Interior
- Kitchen: Kitchen with center island; Kitchen window; Microwave; Range; Refrigerator
- Bedrooms: 4 bedrooms (including a main-floor bedroom)
- Bathrooms: Main-floor full bathroom
- Heating & cooling: Boiler heating; Hot water heating; Fireplace heat source; Ductless mini-split cooling
- Interior features: Ceiling fans; Vaulted ceiling; Natural woodwork; Sun room; Living/Dining room layout; Water filtration system; Water softener (owned)
- Laundry & utility: Washer/dryer hookup
Neighborhood map
What this means for you Summary
Snapshot
- This is a 3-bed/1.0-bath single-family listed at $400k.
Deal economics
- At list price, monthly cash flow is $-525 ($-6k/yr) — negative.
- To cash-flow at today's rent, offer at most $307k (23.2% below list).
- To meet the 1% rule (rent ≥ 1% of price), the offer needs to be $285k (28.8% below list).
- Recommended offer: $285k (28.8% below list) — sets the bar for 1% rule.
Location & tenants
- Location reads 60/100 on livability (#761 in MN) — a middle-class / working-renter tenant base. Strengths: employment A+, housing A+, cost of living B+; Watch: schools F, amenities F, commute F.
- Rush City Public School District (rural): math 37% / reading 47% proficiency, ranked #195 of 301 in MN (top 65%) — families likely to look elsewhere, expect single-tenant / working-renter base with shorter leases.
- Market conditions: 49 active listings in the ZIP; 362 units permitted in Chisago County in 2024 (121 in 5+ unit buildings).
Forward outlook
- Local home prices are declining (-3.0%/yr); year-one equity from $3k of loan paydown is wiped out by about $12k of value loss. Plan a longer hold.
- Chisago County population projected at -11% by 2050 — secular population decline; favor cash flow + early exit over multi-decade hold.
Negotiation context
- Only 1 days on market — expect competitive offers; lowballing is unlikely to land.
- 7 sale attempts since 34y ago with the ask held roughly flat each time — persistent listings suggest the price (not the market) is what's stuck; bring a comps-based counter.
Risks & watch-outs
- Watch-outs: flood insurance adds $66/mo.
- Climate carrying-cost: severe flood risk — expect insurance premiums to compound above CPI over the hold.
Questions for the listing agent
- What do current leases actually rent for vs. the listed asking? Can we see a recent rent roll and the last 12 months of T-12 income?
- Built in 1965 — when were the roof, HVAC, electrical panel, plumbing, and water heater last replaced?
- What's the actual annual flood-insurance premium (NFIP or private), and is the property in a SFHA with mandatory coverage?
- Is there a deadline driving the sale (1031 exchange, divorce, estate, relocation)? That informs how much negotiation room exists.
- Schools are F-rated, which usually means shorter tenancies and higher turnover. Who's the typical renter profile here, and what's been the actual vacancy rate?
- The area grade is low — what's the realistic commute time and amenity access for the typical tenant pool here? Any planned neighborhood developments (good or bad) we should know about?
- This sits on a lake — are riparian / water-frontage rights deeded with the parcel? Any dock permits, shoreline easements, or HOA water-use restrictions?
- What's the documented flood / surge / shoreline-erosion history here (FEMA AND non-FEMA — e.g., storm surge, creek backup, septic-field saturation)?
- Any water-quality or seasonal algae-bloom issues that affect tenant satisfaction or short-term-rental demand?
- What's the average days-on-market for RENTAL listings here right now (not sales)? A rising rental-DOM trend means longer vacancies and softer asking-rent achievability than the comps imply.
- What's the recent tenant-quality profile in this submarket — average credit score on applications, eviction rate, late-payment / NSF rate, and stable-employment percentage? A property-management company in the area should have these aggregated.
- How much new for-sale + rental construction is in the pipeline within 1–3 miles? Heavy new supply typically softens prices + rents 12–24 months out; constrained supply supports both.
Investment metrics
- 1% rule
- 0.71% ✗
- Cap rate
- 4.92%
- Cash-on-cash
- -4.91%
- DSCR
- 0.78
- GRM
- 11.7
CMA / ARV
No comps found within radius.
Projected returns pro-forma
-3.0% appreciation · 3.0% rent growth · sell at horizon
- IRR
- -25.9%
- Equity multiple
- 0.12×
- Total profit
- $-98,216
- Equity at exit
- $59,641
- IRR
- -22.5%
- Equity multiple
- -0.15×
- Total profit
- $-128,392
- Equity at exit
- $34,585
Cash invested: $112,000 (down + closing). Projections, not guarantees.
Landlord ↔ Tenant lean methodology
- Overall (STATE)
- 46 Balanced
- State Minnesota
- 46 Balanced · D+2
- County
- — inherits STATE
- City
- — inherits STATE
ZIP-level market 55069
- Home prices YoY
- -1.7%
- Active inventory
- 49
- Price-to-rent
- 11.7×
Monthly cashflow live
- Estimated rent
- $2,849 medium interval (Pro) →
- Mortgage (P&I)
- −$2,098
- Tax from tax record
- −$445 /mo · $5,340/yr
- Insurance
- −$167
- Flood insurance flood zone
- −$66 /mo · $798/yr
- HOA
- −$0
- Vacancy / Maint / Mgmt
- −$598
- Net cashflow
- $-525
Break-even live
UW: 25.0% down · 7.5% · 30yr · 1.5% tax · 5.0% vac · 8.0% maint · 8.0% mgmt
Financing live
Cash to close
- Down payment
- $100,000
- Closing costs
- $12,000
- Reserves months
- —
- Total cash needed
- —
Loan-product check · same deal, 3 products live
Conventional
25% down · 7.5% · 30yr
- Down + closing
- —
- Monthly P&I
- —
- Monthly cashflow
- —
- DSCR
- —
- Eligible?
- —
Personal DTI + credit; lowest rate.
DSCR
20% down · 8.5% · 30yr
- Down + closing
- —
- Monthly P&I
- —
- Monthly cashflow
- —
- DSCR
- —
- Eligible?
- —
No personal income docs; deal must DSCR.
Hard money
10% down · 12.0% · 12mo
- Down + closing
- —
- Monthly P&I
- —
- Monthly cashflow
- —
- DSCR
- —
- Eligible?
- —
Short-term bridge; refi at stabilization.
Listing history 25 events
-
2026-04-27status Pending
-
2026-04-27$400,000 Active
-
2024-09-22historical
-
2024-05-07price $529,900
-
2024-03-18$549,900 Active
-
2024-03-08price $549,900
-
2024-03-08historical
-
2023-09-07historical
-
2023-08-31price $559,900
-
2023-07-17price $569,900
-
2023-07-01status Active
-
2023-06-29historical Contingent - Sale of Another Property
-
2023-06-20$589,900 Active
-
2020-11-17soldstatus $390,000 Sold
-
2020-11-17soldstatus $390,000
-
2020-09-15status Pending
-
2020-09-10$375,000 Active
-
2018-08-07soldstatus $316,000 Sold
-
2018-08-07soldstatus $316,100
-
2018-06-20status Pending
-
2018-06-15historical Contingent - Inspection
-
2018-06-07$319,900 Active
-
1992-10-04soldstatus $96,150
-
1992-10-04soldstatus $96,150
-
1992-06-30$99,900
ⓘ Source: listings_history table (triggers on properties + properties_extension) + one-shot
backfill from property_details.listing_events for pre-trigger history.
Tax reassessment forecast MN · Partial reset (capped growth)
- Current annual tax
- $5,340 · $445/mo
- Projected year-2 tax
- $5,340 · $445/mo
- Expected delta
- $0/yr ($0/mo · 0.0%)
ⓘ Screening estimate from a state-policy table — verify with the county assessor before closing.
Climate risk First Street
- Flood 9/10 Extreme FEMA zone X (unshaded) · 99% chance over 30 yrs
- Wildfire 1/10 Low
- Heat 2/10 Low 7 d/yr ≥97°F today · 13 d/yr by 30 yrs out
- Wind 1/10 Low
- Air quality 2/10 Low 1 unhealthy d/yr today · 1 by 30 yrs out
Nearby sold comps map
Loading sold comps map…
Walkable amenities ~0.75 mi
Loading nearby amenities…
Taxation est. · year 1
- Rental income
- $34,186
- − Mortgage interest
- −$22,406
- − Property taxes
- −$5,340
- − Insurance
- −$2,798
- − Repairs & maintenance
- −$2,735
- − Management
- −$2,735
- − Depreciation
- −$11,636
- Taxable loss
- −$13,464
- Est. tax savings @ 24.0%
- +$3,231
- After-tax cash flow
- $-3,071/yr
For passive investors: Depreciation is non-cash, so a rental often shows a tax loss while cash-flowing — sheltering income. Rental losses are passive: they offset passive income freely, and up to $25,000/yr can offset ordinary (W-2) income if you actively participate and your MAGI is under $100k (phasing out to $0 by $150k); unused losses carry forward. On sale, claimed depreciation is recaptured at up to 25%, and gains may owe capital-gains tax (a 1031 exchange can defer both). Figures are a year-1 estimate at your 24.0% rate — not tax advice; consult a CPA.
Schools (NCES district)
- District
- Rush City Public School District
- NCES district ID
- 2732550
- Math proficiency
- 37% ▼ -26.00%
- Reading proficiency
- 47% ▼ -20.00%
- Median HH income
- $60,045
- Composite
- 37.08/100
- National rank
- #4499
- State rank
- #195 of 301 in MN
Livability — Harris
- Score
- 60/100
- State rank
- #761
- US rank
- #18834
Category grades
Schools grade is shown separately in the Schools card above.
Census & demographics
- City population
- 3,353
- Population (ZIP)
- 5,936
Population outlook (Chisago County) Hauer SSP2
- Today (2025)
- 55,187 people
- By 2030
- 55,036 · -0.3%
- By 2040
- 53,293 · -3.4%
- By 2050
- 49,157 · -10.9%
- By 2075
- 38,399 · -30.4%
- By 2100
- 24,646 · -55.3%
Race, ethnicity, and origin ACS 2023
- Neighborhood character
- Predominantly White (86%)
- Race & ethnicity
- White 86% Black 8% Two or more races 3% Asian 2% Native American 1%
- Common ancestry
- Portuguese 10% Romanian 3% Lithuanian 2%
- Foreign-born
- 2% · Canada
- Languages at home
- 98% English-only · Spanish 1% Other Asian/Pacific 1% Tagalog/Filipino 1%
Political lean MEDSL · Chisago
- 2024 margin
- Solid R (+31.4) · D 33.5% · R 64.9% · Other 1.6%
- 2008→2024 swing
- -21.2pp toward R · 2008: -10.3pp · 2024: -31.4pp
- All cycles
- 2024: R+31.4 2020: R+29.2 2016: R+30.5 2012: R+12.6 2008: R+10.3
Not yet ingested
- Civics
- —
Market trends
- HPI YoY
- ▼ -7.49%
- Current HPI
- 428.9296
- Rent YoY
- —
- Metro
- —
- State GDP YoY
- ▲ 2.41%
- F500 in state
- 34
Industry mix (Fortune 500 HQ in MN)
| Industry | F500 HQs | Revenue |
|---|---|---|
| Healthcare | 2 | $407B |
|
||
| Retail | 2 | $150B |
|
||
| Consumer Goods | 2 | $32B |
|
||
| Industrial Machinery | 2 | $6B |
|
||
| Agriculture | 1 | $40B |
|
||
| Healthcare / Medical Devices | 1 | $32B |
|
||
Price history
+300.4% since first listed25 events — show timeline
- 2026-04-27 Pending — NORTHSTARMLS as Distributed by MLS Grid
- 2026-04-27 Listed $400,000 NORTHSTARMLS as Distributed by MLS Grid
- 2024-09-22 Listing Removed — NORTHSTARMLS as Distributed by MLS Grid
- 2024-05-07 Price Changed $529,900 NORTHSTARMLS as Distributed by MLS Grid
- 2024-03-18 Listed $549,900 NORTHSTARMLS as Distributed by MLS Grid
- 2024-03-08 Price Changed $549,900 NORTHSTARMLS as Distributed by MLS Grid
- 2024-03-08 Coming Soon — NORTHSTARMLS as Distributed by MLS Grid
- 2023-09-07 Listing Removed — NORTHSTARMLS as Distributed by MLS Grid
- 2023-08-31 Price Changed $559,900 NORTHSTARMLS as Distributed by MLS Grid
- 2023-07-17 Price Changed $569,900 NORTHSTARMLS as Distributed by MLS Grid
- 2023-07-01 Relisted — NORTHSTARMLS as Distributed by MLS Grid
- 2023-06-29 Contingent — NORTHSTARMLS as Distributed by MLS Grid
- 2023-06-20 Listed $589,900 NORTHSTARMLS as Distributed by MLS Grid
- 2020-11-17 Sold (Public Records) $390,000 Public Records
- 2020-11-17 Sold (MLS) $390,000 NORTHSTARMLS as Distributed by MLS Grid
- 2020-09-15 Pending — NORTHSTARMLS as Distributed by MLS Grid
- 2020-09-10 Listed $375,000 NORTHSTARMLS as Distributed by MLS Grid
- 2018-08-07 Sold (Public Records) $316,100 Public Records
- 2018-08-07 Sold (MLS) $316,000 NORTHSTARMLS as Distributed by MLS Grid
- 2018-06-20 Pending — NORTHSTARMLS as Distributed by MLS Grid
- 2018-06-15 Contingent — NORTHSTARMLS as Distributed by MLS Grid
- 2018-06-07 Listed $319,900 NORTHSTARMLS as Distributed by MLS Grid
- 1992-10-04 Sold (Public Records) $96,150 Public Records
- 1992-10-04 Sold (MLS) $96,150 NORTHSTARMLS as Distributed by MLS Grid
- 1992-06-30 Listed $99,900 NORTHSTARMLS as Distributed by MLS Grid
Property tax history
+5.8%/yrLatest (2025): $5,340 · +16.5% YoY. Source: county tax records.
Cash-flow waterfall
monthlySold comps — $/sqft
last 12 mo · ≤1 miLoading sold comps…