 🏷️ Likely Rental
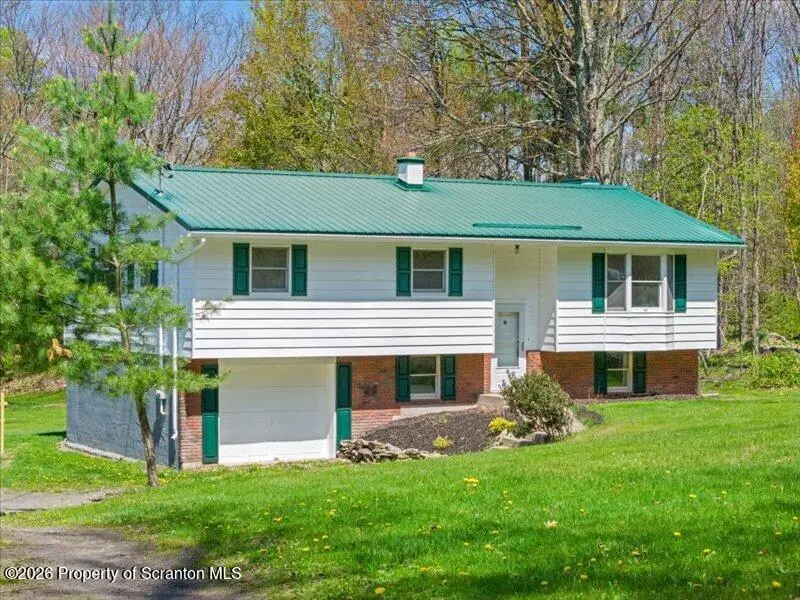
11 Padula Rd · Nicholson, PA
Flood risk 1/10 · Minimal
- FEMA flood zone
- X (unshaded)
- Chance of flooding over 30 yrs
- 0.0%
- Est. flood insurance / yr
- $473 – $860
Fire risk 1/10 · Minimal
- Est. fire insurance / yr
- $511 – $949
Heat risk 2/10 · Minimal
- Hot days now (above 94°F)
- 7 days/yr
- Hot days in 30 yrs
- 14 days/yr
Wind risk 2/10 · Minimal
- Chance of severe wind over 30 yrs
- 3.0%
Air-quality risk 2/10 · Minimal
- Unhealthy air days now
- 0 days/yr
- Unhealthy air days in 30 yrs
- 1 days/yr
Risk factors via First Street. Map © Google.
Why this score? — see what drove the D grade
The composite is a weighted blend of 9 inputs, each scored 0–100. Each bar is that input's sub-score; the figure is the points it added to the 100-point composite (weight × sub-score).
- ARV discount +15.0/15.0
- Cash flow +7.3/30.0
- Schools +4.0/10.0
- Appreciation +3.7/10.0
- Livability +3.5/5.0
- Rent growth +2.5/5.0
- Condition / age +2.5/5.0
- DSCR +1.5/10.0
- 1% rule +0.8/10.0
$289,900
🖨 Deal sheet 📄 Offer letter ✓ Due diligence
Listing remarks
This bi-level ranch home sits on 1.3 acres of beautiful country surroundings, with plenty of yard space, newer metal roof and an instant tenant in lower level. Inside you will find a wonderfully updated, modern main level with all new flooring throughout, brand new kitchen appliances, granite counters, lighting and a washer/dryer combo unit. Come see how many boxes this can check off for you! All OGM rights will transfer.
Key facts
- New flooring
- 1.3 acres
- Newer metal roof
Tags
Property features AI
Exterior
- Parking: 1-car garage; Driveway parking; Basement access from parking
- Utilities: Private well water; Septic tank sewer; Electricity connected with 100 amp service and circuit breakers; Water and sewer connected
- Home design: Single-family residence; Bi-level design; Built in 1979; Block foundation
- Construction: Aluminum siding construction; Metal roof; Block foundation; Year built 1979
- Exterior features: Metal roof; Aluminum siding; Level lot; City street frontage; Dirt and gravel road surface
Interior
- Kitchen: Free-standing gas range; Refrigerator; Microwave
- Bedrooms: 3 bedrooms (Bedroom 1 ~14.6 x 11; Bedroom 2 ~10 x 14; Bedroom 3 ~10.5 x 10)
- Flooring: Laminate
- Bathrooms: 2 full bathrooms
- Heating & cooling: Electric heating; Hot water heating; Oil heating; Ceiling fan(s)
- Interior features: Granite counters; Crawl opening attic access; Full, partially finished, heated walk-out basement
- Laundry & utility: Washer and dryer included
Neighborhood map
What this means for you Summary
Snapshot
- This is a 3-bed/2.0-bath single-family listed at $290k.
Deal economics
- At list price, monthly cash flow is $-382 ($-5k/yr) — negative.
- To cash-flow at today's rent, offer at most $222k (23.3% below list).
- To meet the 1% rule (rent ≥ 1% of price), the offer needs to be $168k (42.1% below list).
- Recommended offer: $168k (42.1% below list) — sets the bar for 1% rule.
Location & tenants
- Location reads 70/100 on livability (#767 in PA) — a middle-class / working-renter tenant base. Strengths: cost of living A+, housing A+, health & safety A-; Watch: schools D-, amenities F, commute F.
- Lackawanna Trail SD (suburban): math 39% / reading 53% proficiency, ranked #248 of 539 in PA (top 46%) — families likely to look elsewhere, expect single-tenant / working-renter base with shorter leases.
- Market conditions: 58 active listings in the ZIP; 33 units permitted in Wyoming County in 2024 (0 in 5+ unit buildings).
Forward outlook
- Local home prices are declining (-2.6%/yr); year-one equity from $2k of loan paydown is wiped out by about $7k of value loss. Plan a longer hold.
- Wyoming County population projected at -23% by 2050 — secular population decline; favor cash flow + early exit over multi-decade hold.
Negotiation context
- It's been on market 43 days — a 3% lower offer ($281k) is reasonable based on typical stale-listing flexibility.
Questions for the listing agent
- What do current leases actually rent for vs. the listed asking? Can we see a recent rent roll and the last 12 months of T-12 income?
- It's been on market 43 days. Have you received any prior offers? Is the seller open to a 42% concession, seller financing, or rate buy-down credit?
- Built in 1979 — when were the roof, HVAC, electrical panel, plumbing, and water heater last replaced?
- Is there a deadline driving the sale (1031 exchange, divorce, estate, relocation)? That informs how much negotiation room exists.
- Schools are D-rated, which usually means shorter tenancies and higher turnover. Who's the typical renter profile here, and what's been the actual vacancy rate?
- The area grade is low — what's the realistic commute time and amenity access for the typical tenant pool here? Any planned neighborhood developments (good or bad) we should know about?
- What's the average days-on-market for RENTAL listings here right now (not sales)? A rising rental-DOM trend means longer vacancies and softer asking-rent achievability than the comps imply.
- What's the recent tenant-quality profile in this submarket — average credit score on applications, eviction rate, late-payment / NSF rate, and stable-employment percentage? A property-management company in the area should have these aggregated.
- How much new for-sale + rental construction is in the pipeline within 1–3 miles? Heavy new supply typically softens prices + rents 12–24 months out; constrained supply supports both.
Investment metrics
- 1% rule
- 0.58% ✗
- Cap rate
- 4.71%
- Cash-on-cash
- -5.64%
- DSCR
- 0.75
- GRM
- 14.4
CMA / ARV
- ARV (median comp)
- $384,379
- List price
- $289,900
- Delta
- -24.58%
- Verdict
- UNDERPRICED
- Comps
- 5 within 2.0 mi
Projected returns pro-forma
-2.57% appreciation · 3.0% rent growth · sell at horizon
- IRR
- -22.7%
- Equity multiple
- 0.18×
- Total profit
- $-66,196
- Equity at exit
- $48,813
- IRR
- -17.1%
- Equity multiple
- -0.05×
- Total profit
- $-85,041
- Equity at exit
- $34,770
Cash invested: $81,172 (down + closing). Projections, not guarantees.
Landlord ↔ Tenant lean methodology
- Overall (STATE)
- 62 Landlord-Friendly
- State Pennsylvania
- 62 Landlord-Friendly · EVEN
- County
- — inherits STATE
- City
- — inherits STATE
ZIP-level market 18657
- Home prices YoY
- -1.0%
- Active inventory
- 58
- Price-to-rent
- 14.4×
Monthly cashflow live
- Estimated rent
- $1,677 medium interval (Pro) →
- Mortgage (P&I)
- −$1,520
- Tax from tax record
- −$66 /mo · $787/yr
- Insurance
- −$121
- HOA
- −$0
- Vacancy / Maint / Mgmt
- −$352
- Net cashflow
- $-382
Break-even live
UW: 25.0% down · 7.5% · 30yr · 1.5% tax · 5.0% vac · 8.0% maint · 8.0% mgmt
Financing live
Cash to close
- Down payment
- $72,475
- Closing costs
- $8,697
- Reserves months
- —
- Total cash needed
- —
Loan-product check · same deal, 3 products live
Conventional
25% down · 7.5% · 30yr
- Down + closing
- —
- Monthly P&I
- —
- Monthly cashflow
- —
- DSCR
- —
- Eligible?
- —
Personal DTI + credit; lowest rate.
DSCR
20% down · 8.5% · 30yr
- Down + closing
- —
- Monthly P&I
- —
- Monthly cashflow
- —
- DSCR
- —
- Eligible?
- —
No personal income docs; deal must DSCR.
Hard money
10% down · 12.0% · 12mo
- Down + closing
- —
- Monthly P&I
- —
- Monthly cashflow
- —
- DSCR
- —
- Eligible?
- —
Short-term bridge; refi at stabilization.
Listing history 15 events
-
2026-06-18days on market $289,900 Active 43 DOM
-
2026-06-17days on market $289,900 Active 42 DOM
-
2026-06-16days on market $289,900 Active 41 DOM
-
2026-06-15days on market $289,900 Active 40 DOM
-
2026-06-14days on market $289,900 Active 38 DOM
-
2026-06-13days on market $289,900 Active 37 DOM
-
2026-06-10days on market $289,900 Active 35 DOM
-
2026-06-09days on market $289,900 Active 34 DOM
-
2026-06-08days on market $289,900 Active 33 DOM
-
2026-06-07days on market $289,900 Active 32 DOM
-
2026-06-02days on market $289,900 Active 27 DOM
-
2026-06-01days on market $289,900 Active 26 DOM
-
2026-05-31days on market $289,900 Active 25 DOM
-
2026-05-30days on market $289,900 Active 24 DOM
-
2026-05-06$289,900 Active 425-char remark
ⓘ Source: listings_history table (triggers on properties + properties_extension) + one-shot
backfill from property_details.listing_events for pre-trigger history.
Tax reassessment forecast PA · Partial reset (capped growth)
- Current annual tax
- $787 · $66/mo
- Projected year-2 tax
- $2,684 · $224/mo
- Expected delta
- +$1,897/yr (+$158/mo · 240.9%)
ⓘ Screening estimate from a state-policy table — verify with the county assessor before closing.
Climate risk First Street
- Flood 1/10 Low FEMA zone X (unshaded) · 0% chance over 30 yrs
- Wildfire 1/10 Low
- Heat 2/10 Low 7 d/yr ≥94°F today · 14 d/yr by 30 yrs out
- Wind 2/10 Low 3% chance of damaging wind over 30 yrs
- Air quality 2/10 Low 0 unhealthy d/yr today · 1 by 30 yrs out
Nearby sold comps map
Loading sold comps map…
Walkable amenities ~0.75 mi
Loading nearby amenities…
Taxation est. · year 1
- Rental income
- $20,125
- − Mortgage interest
- −$16,239
- − Property taxes
- −$787
- − Insurance
- −$1,450
- − Repairs & maintenance
- −$1,610
- − Management
- −$1,610
- − Depreciation
- −$8,433
- Taxable loss
- −$10,004
- Est. tax savings @ 24.0%
- +$2,401
- After-tax cash flow
- $-2,180/yr
For passive investors: Depreciation is non-cash, so a rental often shows a tax loss while cash-flowing — sheltering income. Rental losses are passive: they offset passive income freely, and up to $25,000/yr can offset ordinary (W-2) income if you actively participate and your MAGI is under $100k (phasing out to $0 by $150k); unused losses carry forward. On sale, claimed depreciation is recaptured at up to 25%, and gains may owe capital-gains tax (a 1031 exchange can defer both). Figures are a year-1 estimate at your 24.0% rate — not tax advice; consult a CPA.
Schools (NCES district)
- District
- Lackawanna Trail SD
- NCES district ID
- 4212990
- Math proficiency
- 39% ▼ -7.00%
- Reading proficiency
- 53% ▼ -13.00%
- Median HH income
- $53,071
- Composite
- 39.71/100
- National rank
- #3904
- State rank
- #248 of 539 in PA
Livability — Nicholson
- Score
- 70/100
- State rank
- #767
- US rank
- #7683
Category grades
Schools grade is shown separately in the Schools card above.
Census & demographics
- Population (ZIP)
- 11,043
Population outlook (Wyoming County) Hauer SSP2
- Today (2025)
- 26,334 people
- By 2030
- 25,225 · -4.2%
- By 2040
- 22,707 · -13.8%
- By 2050
- 20,250 · -23.1%
- By 2075
- 15,192 · -42.3%
- By 2100
- 10,961 · -58.4%
Race, ethnicity, and origin ACS 2023
- Neighborhood character
- Predominantly White (95%)
- Race & ethnicity
- White 95% Two or more races 3% Hispanic / Latino 2%
- Common ancestry
- Romanian 9% Lithuanian 2% Iranian 2%
- Foreign-born
- 1% · Canada
- Languages at home
- 97% English-only · Spanish 1%
Political lean MEDSL · Wyoming
- 2024 margin
- Solid R (+36.8) · D 31.1% · R 67.9% · Other 1.0%
- 2008→2024 swing
- -29.2pp toward R · 2008: -7.6pp · 2024: -36.8pp
- All cycles
- 2024: R+36.8 2020: R+35.2 2016: R+38.7 2012: R+12.3 2008: R+7.6
Not yet ingested
- Civics
- —
Market trends
- HPI YoY
- ▼ -2.57%
- Current HPI
- 250.1268
- Rent YoY
- —
- Metro
- —
- State GDP YoY
- ▲ 1.68%
- F500 in state
- 34
Industry mix (Fortune 500 HQ in PA)
| Industry | F500 HQs | Revenue |
|---|---|---|
| Healthcare | 2 | $309B |
|
||
| Insurance | 2 | $27B |
|
||
| Telecommunications / Media | 1 | $124B |
|
||
| Industrial Distribution | 1 | $22B |
|
||
| Financial Services | 1 | $20B |
|
||
| Chemicals / Materials | 1 | $18B |
|
||
Price history
1 event — show timeline
- 2026-05-06 Listed $289,900 GSBR as distributed by MLS GRID
Property tax history
-10.2%/yrLatest (2026): $787 · -74.9% YoY. Source: county tax records.
Cash-flow waterfall
monthlySold comps — $/sqft
last 12 mo · ≤1 miLoading sold comps…