4908 Aspen St · Shady Side, MD
Flood risk 7/10 · Major
- FEMA flood zone
- X (unshaded)
- Chance of flooding over 30 yrs
- 0.94%
- Est. flood insurance / yr
- $507 – $1,088
Fire risk 1/10 · Minimal
- Est. fire insurance / yr
- $755 – $1,403
Heat risk 8/10 · Major
- Hot days now (above 104°F)
- 7 days/yr
- Hot days in 30 yrs
- 15 days/yr
Wind risk 6/10 · Moderate
- Chance of severe wind over 30 yrs
- 71.0%
Air-quality risk 3/10 · Minor
- Unhealthy air days now
- 3 days/yr
- Unhealthy air days in 30 yrs
- 3 days/yr
Risk factors via First Street. Map © Google.
Why this score? — see what drove the C- grade
The composite is a weighted blend of 9 inputs, each scored 0–100. Each bar is that input's sub-score; the figure is the points it added to the 100-point composite (weight × sub-score).
- Cash flow +15.8/30.0
- ARV discount +15.0/15.0
- DSCR +4.9/10.0
- 1% rule +3.9/10.0
- Livability +3.4/5.0
- Schools +2.9/10.0
- Rent growth +2.5/5.0
- Condition / age +2.5/5.0
- Appreciation +0.0/10.0
$304,000
🖨 Deal sheet (PDF) 📄 Offer letter ✓ Due diligence
Listing remarks
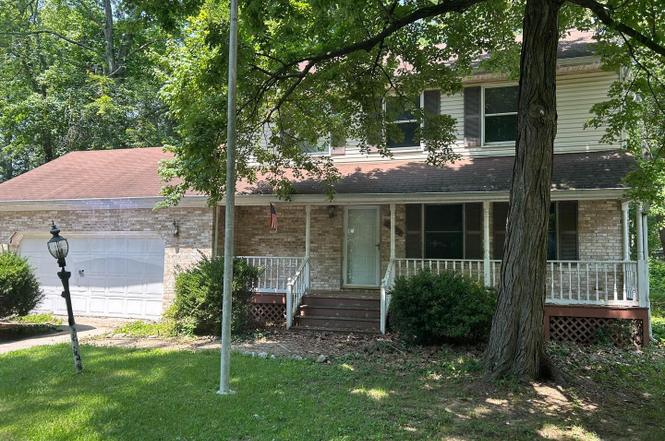
Welcome to this 2-story home nestled in the serene Avalon Shores community. This home features 3 bedrooms, 2 full baths, and 1 half bath. Eat in kitchen with additional room for table space. The exterior boasts multi-level decks ideal for outdoor entertaining, a shady yard offering privacy, and spacious 2 car garage. Located in the peaceful Avalon Shores subdivision, this home is close to Anne Arundel County Public Schools and offers easy access to local amenities and recreational activities. Additionally, you’ll find shopping centers, restaurants, and parks just a short drive away. Check out the virtual tour !
Key facts
- Shopping centers
- Multi-level decks
- Shady yard
Tags
Neighborhood map
What this means for you Summary
Snapshot
- This is a 3-bed/1.5-bath single-family listed at $304k.
Deal economics
- At list price, monthly cash flow is $74 ($887/yr) — positive.
- The deal already cash-flows at list — no discount required.
- To meet the 1% rule (rent ≥ 1% of price), the offer needs to be $271k (10.9% below list).
- Recommended offer: $271k (10.9% below list) — sets the bar for 1% rule.
- Cap rate 6.8% vs local median 3.2% in Shady Side — top-decile yield for the area; either an underpriced asset or a hidden risk that comps aren't pricing in. Stress-test before assuming the spread holds.
Location & tenants
- Location reads 68/100 on livability (#205 in MD) — a middle-class / working-renter tenant base. Strengths: employment A+, housing A+, crime A-; Watch: amenities F, commute F, cost of living F.
- Anne Arundel County Public Schools (suburban): math 20% / reading 37% proficiency, ranked #10 of 24 in MD (top 42%) — low school quality limits family demand, transient renter base, plan for 1-2y turnover.
- Zoned schools: Shady Side Elementary (math 12% / reading 27%, grade F, #353 of 860 statewide, top 45%, 401 students, 29% FRL); Southern Middle (math 8% / reading 39%, grade F, #118 of 225 statewide, top 54%, 755 students, 45% FRL); Southern High (math 52% / reading 73%, grade B-, #62 of 222 statewide, top 29%, 1,066 students, 40% FRL).
- Market conditions: 55 active listings in the ZIP; 2 comparable units currently listed for rent nearby; 1,303 units permitted in Anne Arundel County in 2024 (299 in 5+ unit buildings).
Forward outlook
- Local home prices are declining (-3.0%/yr); year-one equity from $2k of loan paydown is wiped out by about $9k of value loss. Plan a longer hold.
- Anne Arundel County population projected at +17% by 2050 — long-run rental-demand tailwind backs the buy-and-hold thesis.
Negotiation context
- It's been on market 26 days — a 2% lower offer ($299k) is reasonable based on typical stale-listing flexibility.
- 2 sale attempts with the ask held roughly flat each time — persistent listings suggest the price (not the market) is what's stuck; bring a comps-based counter.
- Current owner paid $140k; list at $304k implies a 117% gain — meaningful room to come down on a strong offer.
Risks & watch-outs
- Watch-outs: flood insurance adds $66/mo.
- Climate carrying-cost: major flood risk; major wind risk, 71% chance of damaging wind over 30y; extreme-heat days projected 7→15/yr by 2055 (HVAC capex compounding) — expect insurance premiums to compound above CPI over the hold.
Questions for the listing agent
- What's the actual annual flood-insurance premium (NFIP or private), and is the property in a SFHA with mandatory coverage?
- Is there a deadline driving the sale (1031 exchange, divorce, estate, relocation)? That informs how much negotiation room exists.
- Schools are D-rated, which usually means shorter tenancies and higher turnover. Who's the typical renter profile here, and what's been the actual vacancy rate?
- What's the average days-on-market for RENTAL listings here right now (not sales)? A rising rental-DOM trend means longer vacancies and softer asking-rent achievability than the comps imply.
- What's the recent tenant-quality profile in this submarket — average credit score on applications, eviction rate, late-payment / NSF rate, and stable-employment percentage? A property-management company in the area should have these aggregated.
- How much new for-sale + rental construction is in the pipeline within 1–3 miles? Heavy new supply typically softens prices + rents 12–24 months out; constrained supply supports both.
Investment metrics
- 1% rule
- 0.89% ✗
- Cap rate
- 6.85%
- Cash-on-cash
- 1.98%
- DSCR
- 1.09
- GRM
- 9.4
CMA / ARV
- ARV (on-the-fly)
- $436,500
- Comps found
- 12
Show comp detail 12 sales within ~0.75 mi
| Address | Dist | Beds/Ba | Sqft | Sold | Price | $/sf | Match |
|---|---|---|---|---|---|---|---|
| 1205 Avalon Blvd | 0.05mi | 3/2.5 | 1,500 (0%) | 2mo | $440,000 | $293 | 92 |
| 4977 Lerch Dr | 0.11mi | 3/1.0 | 1,407 (-6%) | 10mo | $389,000 | $276 | 74 |
| 1330 Jordan Dr | 0.41mi | 3/2.5 | 1,440 (-4%) | 2mo | $385,000 | $267 | 69 |
| 1222 Hawthorne St | 0.15mi | 3/2.5 | 1,564 (+4%) | 16mo | $440,000 | $281 | 69 |
| 1237A Juniper St | 0.21mi | 3/2.5 | 1,664 (+11%) | 1mo | $475,000 | $285 | 67 |
| 4911 Chestnut St | 0.14mi | 3/2.0 | 1,356 (-10%) | 15mo | $410,000 | $302 | 63 |
| 1250 Juniper St | 0.25mi | 3/2.5 | 1,332 (-11%) | 7mo | $440,000 | $330 | 60 |
| 1248-A Hawthorne St | 0.25mi | 3/2.5 | 1,612 (+8%) | 19mo | $390,000 | $242 | 56 |
| 1241 Avalon Blvd | 0.17mi | 3/2.5 | 1,326 (-12%) | 16mo | $480,000 | $362 | 55 |
| 1334 Jordan Dr | 0.43mi | 3/1.5 | 1,340 (-11%) | 10mo | $390,000 | $291 | 54 |
| 1260 Juniper St | 0.28mi | 3/2.5 | 1,296 (-14%) | 20mo | $380,000 | $293 | 44 |
| 4921 Bonniewood Dr | 0.31mi | 3/2.5 | 1,296 (-14%) | 19mo | $375,000 | $289 | 43 |
Match score weights: distance 35% · size 25% · config 20% · recency 20%. Top-matched comps best support the ARV.
Projected returns pro-forma
-3.0% appreciation · 3.0% rent growth · sell at horizon
- IRR
- -14.6%
- Equity multiple
- 0.48×
- Total profit
- $-44,534
- Equity at exit
- $45,327
- IRR
- -5.9%
- Equity multiple
- 0.62×
- Total profit
- $-32,641
- Equity at exit
- $26,284
Cash invested: $85,120 (down + closing). Projections, not guarantees.
Landlord ↔ Tenant lean methodology
- Overall (STATE)
- 27 Tenant-Leaning
- State Maryland
- 27 Tenant-Leaning · D+14
- County
- — inherits STATE
- City
- — inherits STATE
ZIP-level market 20764
- Home prices YoY
- -32.8%
- Active inventory
- 55
- Price-to-rent
- 9.4×
Monthly cashflow live
- Estimated rent
- $2,707 medium interval (Pro) →
- Mortgage (P&I)
- −$1,594
- Tax from tax record
- −$277 /mo · $3,330/yr
- Insurance
- −$127
- Flood insurance flood zone
- −$66 /mo · $798/yr
- HOA
- −$0
- Vacancy / Maint / Mgmt
- −$569
- Net cashflow
- $74
Break-even live
Sensitivity live
| Price | -10% $246 | -5% $160 | +0% $74 | +5% $-12 | +10% $-98 |
|---|---|---|---|---|---|
| Rent | -10% $-140 | -5% $-33 | +0% $74 | +5% $181 | +10% $288 |
| Rate | -1.0pp $227 | -0.5pp $151 | base $74 | +0.5pp $-5 | +1.0pp $-85 |
UW: 25.0% down · 7.5% · 30yr · 1.5% tax · 5.0% vac · 8.0% maint · 8.0% mgmt
Financing live
Cash to close
- Down payment
- $76,000
- Closing costs
- $9,120
- Reserves months
- —
- Total cash needed
- —
Loan-product check · same deal, 3 products live
Conventional
25% down · 7.5% · 30yr
- Down + closing
- —
- Monthly P&I
- —
- Monthly cashflow
- —
- DSCR
- —
- Eligible?
- —
Personal DTI + credit; lowest rate.
DSCR
20% down · 8.5% · 30yr
- Down + closing
- —
- Monthly P&I
- —
- Monthly cashflow
- —
- DSCR
- —
- Eligible?
- —
No personal income docs; deal must DSCR.
Hard money
10% down · 12.0% · 12mo
- Down + closing
- —
- Monthly P&I
- —
- Monthly cashflow
- —
- DSCR
- —
- Eligible?
- —
Short-term bridge; refi at stabilization.
Rent comps 2 comps
| Address | Beds | Baths | Sqft | Rent | $/sqft | DOM | Units | Dist |
|---|---|---|---|---|---|---|---|---|
| 1304 Avalon Blvd Shady Side, MD | 3.0 | 2.5 | 1414 | $2,795 | $1.98 | 45d | 1 | 0.31mi |
| 1193 Maple Ave Shady Side, MD | 3.0 | 1.5 | 1296 | $2,250 | $1.74 | 45d | 1 | 1.49mi |
Listing history 5 events
-
2025-10-16status Pending
-
2025-10-03status Active
-
2025-02-07status Pending
-
2025-01-25$304,000 Active
-
1992-04-27soldstatus $140,000
ⓘ Source: listings_history table (triggers on properties + properties_extension) + one-shot
backfill from property_details.listing_events for pre-trigger history.
Tax reassessment forecast MD · Partial reset (capped growth)
- Current annual tax
- $3,330 · $277/mo
- Projected year-2 tax
- $3,330 · $277/mo
- Expected delta
- $0/yr ($0/mo · 0.0%)
ⓘ Screening estimate from a state-policy table — verify with the county assessor before closing.
Climate risk First Street
- Flood 7/10 Severe FEMA zone X (unshaded) · 94% chance over 30 yrs
- Wildfire 1/10 Low
- Heat 8/10 Severe 7 d/yr ≥104°F today · 15 d/yr by 30 yrs out
- Wind 6/10 Major 71% chance of damaging wind over 30 yrs
- Air quality 3/10 Moderate 3 unhealthy d/yr today · 3 by 30 yrs out
Nearby sold comps map
Loading sold comps map…
Walkable amenities ~0.75 mi
Loading nearby amenities…
Taxation est. · year 1
- Rental income
- $32,487
- − Mortgage interest
- −$17,029
- − Property taxes
- −$3,330
- − Insurance
- −$2,318
- − Repairs & maintenance
- −$2,599
- − Management
- −$2,599
- − Depreciation
- −$8,844
- Taxable loss
- −$4,230
- Est. tax savings @ 24.0%
- +$1,015
- After-tax cash flow
- $1,902/yr
For passive investors: Depreciation is non-cash, so a rental often shows a tax loss while cash-flowing — sheltering income. Rental losses are passive: they offset passive income freely, and up to $25,000/yr can offset ordinary (W-2) income if you actively participate and your MAGI is under $100k (phasing out to $0 by $150k); unused losses carry forward. On sale, claimed depreciation is recaptured at up to 25%, and gains may owe capital-gains tax (a 1031 exchange can defer both). Figures are a year-1 estimate at your 24.0% rate — not tax advice; consult a CPA.
Schools (NCES district)
- District
- Anne Arundel County Public Schools
- NCES district ID
- 2400060
- Math proficiency
- 20% ▼ -21.00%
- Reading proficiency
- 37% ▼ -13.00%
- Median HH income
- $87,880
- Composite
- 28.52/100
- National rank
- #6733
- State rank
- #10 of 24 in MD
Livability — Shady Side
- Score
- 68/100
- State rank
- #205
- US rank
- #9775
Category grades
Schools grade is shown separately in the Schools card above.
Census & demographics
- Census place
- Shady Side, MD
- City population
- 3,011
- Population (ZIP)
- 3,011
Population outlook (Anne Arundel County) Hauer SSP2
- Today (2025)
- 617,384 people
- By 2030
- 642,094 · +4.0%
- By 2040
- 686,621 · +11.2%
- By 2050
- 723,031 · +17.1%
- By 2075
- 809,346 · +31.1%
- By 2100
- 837,658 · +35.7%
Race, ethnicity, and origin ACS 2023
- Neighborhood character
- Predominantly White (79%)
- Race & ethnicity
- White 79% Black 14% Two or more races 6% Hispanic / Latino 3%
- Common ancestry
- Polish 4% Slovak 3% Romanian 3%
- Foreign-born
- 4% · Canada
- Languages at home
- 92% English-only · Spanish 6% Russian/Polish/Slavic 1% German/W. Germanic 1%
Political lean MEDSL · Anne Arundel
- 2024 margin
- D (+13.9) · D 55.7% · R 41.7% · Other 2.6%
- 2008→2024 swing
- +15.7pp toward D · 2008: -1.8pp · 2024: 13.9pp
- All cycles
- 2024: D+13.9 2020: D+14.5 2016: D+0.7 2012: R+0.9 2008: R+1.8
Not yet ingested
- Civics
- —
Market trends
- HPI YoY
- ▼ -128.97%
- Current HPI
- 264.1045
- Rent YoY
- —
- Metro
- —
- State GDP YoY
- ▲ 2.97%
- F500 in state
- 12
Industry mix (Fortune 500 HQ in MD)
| Industry | F500 HQs | Revenue |
|---|---|---|
| Aerospace / Defense | 1 | $71B |
|
||
| Utilities | 1 | $25B |
|
||
| Hotels | 1 | $24B |
|
||
| Consumer Goods | 1 | $7B |
|
||
| Real Estate | 1 | $6B |
|
||
| Chemicals | 1 | $2B |
|
||
Price history
+117.1% since first listed5 events — show timeline
- 2025-10-16 Pending — BRIGHT MLS
- 2025-10-03 Relisted — BRIGHT MLS
- 2025-02-07 Pending — BRIGHT MLS
- 2025-01-25 Listed $304,000 BRIGHT MLS
- 1992-04-27 Sold (Public Records) $140,000 Public Records
Property tax history
+4.1%/yrLatest (2025): $3,330 · +2.3% YoY. Source: county tax records.
Cash-flow waterfall
monthlySold comps — $/sqft
last 12 mo · ≤1 miLoading sold comps…