 Triplex
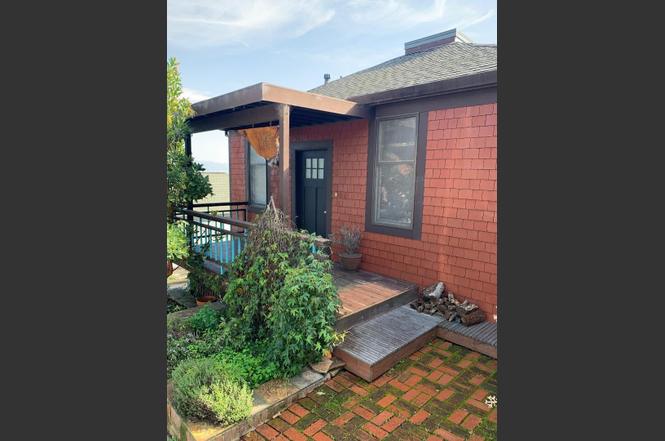
141-145 Eddy St · Richmond, CA
Flood risk 1/10 · Minimal
- FEMA flood zone
- X (unshaded)
- Chance of flooding over 30 yrs
- 0.0%
- Est. flood insurance / yr
- $473 – $860
Fire risk 1/10 · Minimal
- Est. fire insurance / yr
- $659 – $1,223
Heat risk 4/10 · Minor
- Hot days now (above 84°F)
- 7 days/yr
- Hot days in 30 yrs
- 16 days/yr
Wind risk 1/10 · Minimal
- Chance of severe wind over 30 yrs
- —
Air-quality risk 8/10 · Major
- Unhealthy air days now
- 14 days/yr
- Unhealthy air days in 30 yrs
- 14 days/yr
Risk factors via First Street. Map © Google.
Why this score? — see what drove the F grade
The composite is a weighted blend of 9 inputs, each scored 0–100. Each bar is that input's sub-score; the figure is the points it added to the 100-point composite (weight × sub-score).
- Cash flow +9.6/30.0
- ARV discount +7.5/15.0
- Rent growth +3.5/5.0
- Livability +3.1/5.0
- Schools +3.0/10.0
- 1% rule +2.8/10.0
- DSCR +2.7/10.0
- Condition / age +2.5/5.0
- Appreciation +0.0/10.0
$745,000
🖨 Deal sheet 📄 Offer letter ✓ Due diligence
Multi-family units
County records classify this as Multi-Family (2-4 Unit). Listing-text estimate: 3 units. confirmed
Listing remarks MLS
This well maintained duplex is located in a quite neighborhood of Point Richmond, conveniently situated near freeway access. Front unit offers 2 spacious bedrooms and 2 baths. The rear unit is a spacious 1 Bedroom 1 Bath with a beautiful view. Each unit is rented providing immediate cash flow for an investor.
Key facts
- 3,720 sq ft lot
- Built 1904
Property features AI
Finance
- Other: Living area reported as 2,238; Lot size about 0.0854 acres (assessor)
- Financial info: Property contains 2 total units; Annual rental income reported as $61,200; Annual gross income reported as $61,200; Gross scheduled income reported as $61,200; Gross rent multiplier of 12.17; Total expenses reported as $20,527; Other expenses reported as $1,500; Tenant pays utilities for electric, gas, and heating; Annual property tax reported as $8,827; Trash expense reported as $2,800; Utility expenses reported as $1,100
Exterior
- Parking: Assigned parking spaces; Carport with space for 3 vehicles
- Security: Security features noted (see remarks)
- Utilities: Separate electric meters; Separate gas meters; Public water
- Home design: Trust ownership; R2 zoning
- Construction: One building on the lot; Foundation described as 'Other'
- Exterior features: Roof described as 'Other (See Remarks)'; Public utilities; Sewer is public
Interior
- Interior features: Central forced air heating; Security features noted (see remarks)
Neighborhood map
What this means for you Summary
Snapshot
- This is a 3 × 1-bed/?-bath units multifamily listed at $745k.
Deal economics
- At list price, monthly cash flow is $-504 ($-6k/yr) — negative. Per door: $-168/mo.
- To cash-flow at today's rent, offer at most $656k (11.9% below list).
- To meet the 1% rule (rent ≥ 1% of price), the offer needs to be $584k (21.7% below list).
- Recommended offer: $584k (21.7% below list) — sets the bar for 1% rule.
- Cap rate 5.5% vs local median 2.7% in Richmond — top-decile yield for the area; either an underpriced asset or a hidden risk that comps aren't pricing in. Stress-test before assuming the spread holds.
Location & tenants
- Location reads 62/100 on livability (#497 in CA) — a middle-class / working-renter tenant base. Strengths: commute A+, employment A, health & safety B+; Watch: schools F, crime F, amenities F.
- West Contra Costa Unified (suburban): math 24% / reading 35% proficiency, ranked #993 of 1,400 in CA (top 71%) — low school quality limits family demand, transient renter base, plan for 1-2y turnover.
- Market conditions: Rents rising (+4.0%/yr); 98 active listings in the ZIP; solid renter incomes; 2,169 units permitted in Contra Costa County in 2024 (896 in 5+ unit buildings).
- At $5,835/mo this rent would consume 86% of the median local household income ($82k/yr) (locally 1277% of renters already pay >50% of income on rent) — very limited rent-growth headroom before tenants either downsize or default.
Forward outlook
- Local home prices are declining (-3.0%/yr); year-one equity from $5k of loan paydown is wiped out by about $22k of value loss. Plan a longer hold.
- Contra Costa County population projected at +26% by 2050 — long-run rental-demand tailwind backs the buy-and-hold thesis.
Negotiation context
- Only 1 days on market — expect competitive offers; lowballing is unlikely to land.
- 3 sale attempts since 2y ago with the ask held roughly flat each time — persistent listings suggest the price (not the market) is what's stuck; bring a comps-based counter.
- Current owner paid $99k; list at $745k implies a 653% gain — meaningful room to come down on a strong offer.
Risks & watch-outs
- Watch-outs: built in 1904 — expect roof / HVAC / electrical / plumbing capex.
Questions for the listing agent
- What do current leases actually rent for vs. the listed asking? Can we see a recent rent roll and the last 12 months of T-12 income?
- Can we see the unit-by-unit rent roll, current vacancy, and any below-market leases? What's the average tenancy length?
- What capital expenditures (roof, boiler, parking lot, exteriors) have been made in the last 5 years, and what's planned in the next 2?
- Built in 1904 — when were the roof, HVAC, electrical panel, plumbing, and water heater last replaced?
- Is there a deadline driving the sale (1031 exchange, divorce, estate, relocation)? That informs how much negotiation room exists.
- Schools are F-rated, which usually means shorter tenancies and higher turnover. Who's the typical renter profile here, and what's been the actual vacancy rate?
- Crime grade is F in this area — have there been break-ins, vandalism, or insurance claims at this property in the last 3 years? What carrier currently insures it and at what premium?
- The area grade is low — what's the realistic commute time and amenity access for the typical tenant pool here? Any planned neighborhood developments (good or bad) we should know about?
- What's the average days-on-market for RENTAL listings here right now (not sales)? A rising rental-DOM trend means longer vacancies and softer asking-rent achievability than the comps imply.
- What's the recent tenant-quality profile in this submarket — average credit score on applications, eviction rate, late-payment / NSF rate, and stable-employment percentage? A property-management company in the area should have these aggregated.
- How much new apartment / multifamily construction is in the pipeline within 1–3 miles? Heavy new supply (>2% of stock underway) typically softens rents 12–24 months out; light construction supports rent growth.
Investment metrics
- 1% rule
- 0.78% ✗
- Cap rate
- 5.48%
- Cash-on-cash
- -2.90%
- DSCR
- 0.87
- GRM
- 10.6
CMA / ARV
No comps found within radius.
Projected returns pro-forma
-3.0% appreciation · 3.98% rent growth · sell at horizon
- IRR
- -20.0%
- Equity multiple
- 0.30×
- Total profit
- $-146,944
- Equity at exit
- $111,082
- IRR
- -11.0%
- Equity multiple
- 0.31×
- Total profit
- $-144,697
- Equity at exit
- $64,414
Cash invested: $208,600 (down + closing). Projections, not guarantees.
Landlord ↔ Tenant lean methodology
- Overall (STATE)
- 18 Strongly Tenant-Friendly
- State California
- 18 Strongly Tenant-Friendly · D+13
- County
- — inherits STATE
- City
- — inherits STATE
ZIP-level market 94801
- Rents YoY
- 4.0%
- Active inventory
- 98
- Price-to-rent
- 31.9×
Monthly cashflow live
- Estimated rent
- $5,835 medium interval (Pro) →
- Mortgage (P&I)
- −$3,907
- Tax from tax record
- −$896 /mo · $10,756/yr
- Insurance
- −$310
- HOA
- −$0
- Vacancy / Maint / Mgmt
- −$1,225
- Net cashflow
- $-504
Break-even live
3-unit breakdown (identical units grouped — click to expand)
| Units | Beds | Baths | Est. rent |
|---|---|---|---|
| 3× units | 1 | — | $5,835 |
| #1 | 1 | — | $1,945 |
| #2 | 1 | — | $1,945 |
| #3 | 1 | — | $1,945 |
| Total (3 units) | $5,835 | ||
UW: 25.0% down · 7.5% · 30yr · 1.5% tax · 5.0% vac · 8.0% maint · 8.0% mgmt
Financing live
Cash to close
- Down payment
- $186,250
- Closing costs
- $22,350
- Reserves months
- —
- Total cash needed
- —
Loan-product check · same deal, 3 products live
Conventional
25% down · 7.5% · 30yr
- Down + closing
- —
- Monthly P&I
- —
- Monthly cashflow
- —
- DSCR
- —
- Eligible?
- —
Personal DTI + credit; lowest rate.
DSCR
20% down · 8.5% · 30yr
- Down + closing
- —
- Monthly P&I
- —
- Monthly cashflow
- —
- DSCR
- —
- Eligible?
- —
No personal income docs; deal must DSCR.
Hard money
10% down · 12.0% · 12mo
- Down + closing
- —
- Monthly P&I
- —
- Monthly cashflow
- —
- DSCR
- —
- Eligible?
- —
Short-term bridge; refi at stabilization.
Listing history 2 events
-
2026-06-17remarks 310-char remark
Show marketing remark (310 chars)
This well maintained duplex is located in a quite neighborhood of Point Richmond, conveniently situated near freeway access. Front unit offers 2 spacious bedrooms and 2 baths. The rear unit is a spacious 1 Bedroom 1 Bath with a beautiful view. Each unit is rented providing immediate cash flow for an investor.
-
2026-06-17$745,000 Active 1 DOM
Show marketing remark (310 chars)
This well maintained duplex is located in a quite neighborhood of Point Richmond, conveniently situated near freeway access. Front unit offers 2 spacious bedrooms and 2 baths. The rear unit is a spacious 1 Bedroom 1 Bath with a beautiful view. Each unit is rented providing immediate cash flow for an investor.
ⓘ Source: listings_history table (triggers on properties + properties_extension) + one-shot
backfill from property_details.listing_events for pre-trigger history.
Tax reassessment forecast CA · Resets to sale price
- Current annual tax
- $10,756 · $896/mo
- Projected year-2 tax
- $10,756 · $896/mo
- Expected delta
- $0/yr ($0/mo · 0.0%)
ⓘ Screening estimate from a state-policy table — verify with the county assessor before closing.
Climate risk First Street
- Flood 1/10 Low FEMA zone X (unshaded) · 0% chance over 30 yrs
- Wildfire 1/10 Low
- Heat 4/10 Moderate 7 d/yr ≥84°F today · 16 d/yr by 30 yrs out
- Wind 1/10 Low
- Air quality 8/10 Severe 14 unhealthy d/yr today · 14 by 30 yrs out
Nearby sold comps map
Loading sold comps map…
Walkable amenities ~0.75 mi
Loading nearby amenities…
Taxation est. · year 1
- Rental income
- $70,020
- − Mortgage interest
- −$41,732
- − Property taxes
- −$10,756
- − Insurance
- −$3,725
- − Repairs & maintenance
- −$5,602
- − Management
- −$5,602
- − Depreciation
- −$21,673
- Taxable loss
- −$19,069
- Est. tax savings @ 24.0%
- +$4,576
- After-tax cash flow
- $-1,471/yr
For passive investors: Depreciation is non-cash, so a rental often shows a tax loss while cash-flowing — sheltering income. Rental losses are passive: they offset passive income freely, and up to $25,000/yr can offset ordinary (W-2) income if you actively participate and your MAGI is under $100k (phasing out to $0 by $150k); unused losses carry forward. On sale, claimed depreciation is recaptured at up to 25%, and gains may owe capital-gains tax (a 1031 exchange can defer both). Figures are a year-1 estimate at your 24.0% rate — not tax advice; consult a CPA.
Schools (NCES district)
- District
- West Contra Costa Unified
- NCES district ID
- 0632550
- Math proficiency
- 24% ▲ 1.00%
- Reading proficiency
- 35% ▲ 1.00%
- Median HH income
- $64,837
- Composite
- 30.04/100
- National rank
- #11623
- State rank
- #993 of 1400 in CA
Livability — Richmond
- Score
- 62/100
- State rank
- #497
- US rank
- #16759
Category grades
Schools grade is shown separately in the Schools card above.
Census & demographics
- Census place
- Richmond, CA
- County
- Contra Costa County · 1,059,880 people
- City population
- 183,357
- Metro
- San Francisco-Oakland-Berkeley, CA
- Population (ZIP)
- 33,591
- Household income
- $81,728
- Rent vs Own
- Severe rent burden
- 1277.0
Population outlook (Contra Costa County) Hauer SSP2
- Today (2025)
- 1,287,720 people
- By 2030
- 1,364,937 · +6.0%
- By 2040
- 1,506,209 · +17.0%
- By 2050
- 1,624,373 · +26.1%
- By 2075
- 1,853,193 · +43.9%
- By 2100
- 1,901,231 · +47.6%
Race, ethnicity, and origin ACS 2023
- Neighborhood character
- Predominantly Hispanic (66%)
- Race & ethnicity
- Hispanic / Latino 66% Two or more races 19% White 12% Black 11% Asian 6% Native American 3%
- Hispanic origin (detail)
- Mexican 42%
- Common ancestry
- Italian 3% Lithuanian 1% Swedish 1%
- Foreign-born
- 40% · Canada, China, Vietnam
- Languages at home
- 32% English-only · Spanish 61% Other Asian/Pacific 3% Chinese 2%
Political lean MEDSL · Contra Costa
- 2024 margin
- Solid D (+38.0) · D 67.3% · R 29.4% · Other 3.3%
- 2008→2024 swing
- +0.2pp no change · 2008: 37.8pp · 2024: 38.0pp
- All cycles
- 2024: D+38.0 2020: D+45.3 2016: D+43.5 2012: D+33.7 2008: D+37.8
Not yet ingested
- Civics
- —
Market trends
- HPI YoY
- ▼ -334.07%
- Current HPI
- 390.1045
- Rent YoY
- ▲ 3.98%
- Metro
- San Francisco-Oakland-Berkeley, CA
- State GDP YoY
- ▲ 3.21%
- F500 in state
- 116
Industry mix (Fortune 500 HQ in CA)
| Industry | F500 HQs | Revenue |
|---|---|---|
| Technology | 27 | $1,492B |
|
||
| Financial Services | 3 | $174B |
|
||
| Retail | 3 | $44B |
|
||
| Insurance | 3 | $26B |
|
||
| Media / Entertainment | 2 | $115B |
|
||
| Pharmaceuticals / Biotech | 2 | $62B |
|
||
Price history
+900.0% since first listed8 events — show timeline
- 2026-06-17 Listed $745,000 MLSListings
- 2026-06-17 Listed $745,000 bridgeMLS, Bay East AOR, or Contra Costa AOR
- 2024-03-22 Rental Removed $2,800 BRIDGEMLS
- 2024-02-14 Price Changed $2,800 BRIDGEMLS
- 2024-02-07 Listed for Rent $2,900 BRIDGEMLS
- 1988-07-13 Sold (Public Records) $99,000 Public Records
- 1988-03-29 Sold (Public Records) $74,500 Public Records
- 1988-03-29 Sold (Public Records) $74,500 Public Records
Property tax history
+3.8%/yrLatest (2025): $10,756 · +21.9% YoY. Source: county tax records.
Cash-flow waterfall
monthlySold comps — $/sqft
last 12 mo · ≤1 miLoading sold comps…