 🌊 Lakefront
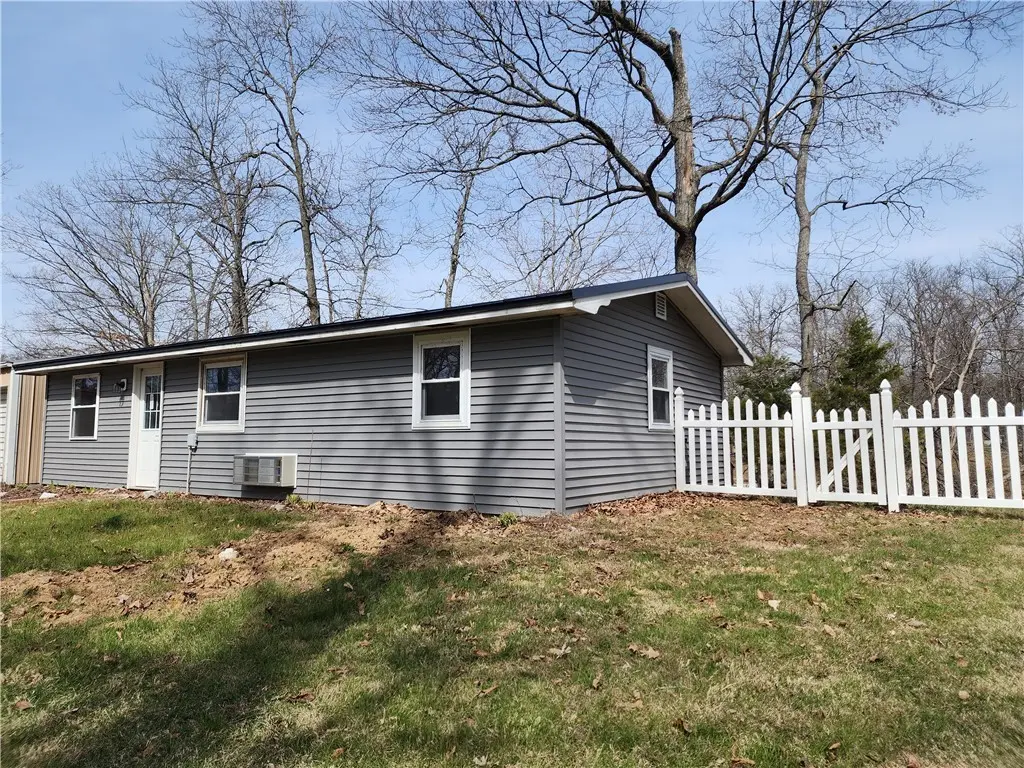
13903 E Lake Jasper South Ave · Newton, IL
Flood risk No data
- FEMA flood zone
- —
- Chance of flooding over 30 yrs
- —
- Est. flood insurance / yr
- —
Fire risk No data
- Est. fire insurance / yr
- —
Heat risk No data
- Hot days now (above threshold)
- —
- Hot days in 30 yrs
- —
Wind risk No data
- Chance of severe wind over 30 yrs
- —
Air-quality risk No data
- Unhealthy air days now
- —
- Unhealthy air days in 30 yrs
- —
Risk factors via First Street. Map © Google.
Why this score? — see what drove the C grade
The composite is a weighted blend of 9 inputs, each scored 0–100. Each bar is that input's sub-score; the figure is the points it added to the 100-point composite (weight × sub-score).
- Cash flow +18.7/30.0
- Appreciation +10.0/10.0
- ARV discount +7.4/15.0
- DSCR +5.9/10.0
- 1% rule +5.0/10.0
- Livability +3.2/5.0
- Schools +2.6/10.0
- Rent growth +2.5/5.0
- Condition / age +2.5/5.0
$79,500
🖨 Deal sheet 📄 Offer letter ✓ Due diligence
Listing remarks MLS
Beautiful view of Lake Jasper, featuring nice deck, outside firepit. 2 car detached garage and storage shed. Home has new flooring and paint. Property sells subject to lake approval and yearly dues.
Key facts
- Outdoor fireplace
- Remodeled bathroom
- Open-concept kitchen
Tags
Neighborhood map
What this means for you Summary
Snapshot
- This is a 1-bed/1.0-bath single-family listed at $80k.
Deal economics
- At list price, monthly cash flow is $78 ($939/yr) — positive.
- The deal already cash-flows at list — no discount required.
- To meet the 1% rule (rent ≥ 1% of price), the offer needs to be $79k (0.0% below list).
- Recommended offer: $78k (1.5% below list) — sets the bar for market timing.
Location & tenants
- Location reads 63/100 on livability (#809 in IL) — a middle-class / working-renter tenant base. Strengths: cost of living A+, housing A+; Watch: schools D, employment D, amenities F.
- Jasper County CUD 1 (town): math 29% / reading 30% proficiency, ranked #253 of 620 in IL (top 41%) — low school quality limits family demand, transient renter base, plan for 1-2y turnover.
- Market conditions: 18 active listings in the ZIP.
Forward outlook
- In year one you build about $8k of equity ($550 loan paydown + $8k appreciation (10.0% local appreciation)).
- Jasper County population projected at -16% by 2050 — secular population decline; favor cash flow + early exit over multi-decade hold.
- At projected returns (10.0% appreciation + 3.0% rent growth), your $22k cash investment doubles in ~3 years — after that, you're playing with house money.
- By year 4, paydown + projected appreciation supports a ~$30k cash-out refi (75% LTV) — recoverable capital for the next deal without selling this one.
Negotiation context
- It's been on market 28 days — a 2% lower offer ($78k) is reasonable based on typical stale-listing flexibility.
- 2 sale attempts since 15y ago with the ask held roughly flat each time — persistent listings suggest the price (not the market) is what's stuck; bring a comps-based counter.
- Current owner paid $40k; list at $80k implies a 99% gain — meaningful room to come down on a strong offer.
Questions for the listing agent
- Built in 1968 — when were the roof, HVAC, electrical panel, plumbing, and water heater last replaced?
- Is there a deadline driving the sale (1031 exchange, divorce, estate, relocation)? That informs how much negotiation room exists.
- Schools are D-rated, which usually means shorter tenancies and higher turnover. Who's the typical renter profile here, and what's been the actual vacancy rate?
- This sits on a lake — are riparian / water-frontage rights deeded with the parcel? Any dock permits, shoreline easements, or HOA water-use restrictions?
- What's the documented flood / surge / shoreline-erosion history here (FEMA AND non-FEMA — e.g., storm surge, creek backup, septic-field saturation)?
- Any water-quality or seasonal algae-bloom issues that affect tenant satisfaction or short-term-rental demand?
- What's the average days-on-market for RENTAL listings here right now (not sales)? A rising rental-DOM trend means longer vacancies and softer asking-rent achievability than the comps imply.
- What's the recent tenant-quality profile in this submarket — average credit score on applications, eviction rate, late-payment / NSF rate, and stable-employment percentage? A property-management company in the area should have these aggregated.
- How much new for-sale + rental construction is in the pipeline within 1–3 miles? Heavy new supply typically softens prices + rents 12–24 months out; constrained supply supports both.
Investment metrics
- 1% rule
- 1.00% ✗
- Cap rate
- 7.47%
- Cash-on-cash
- 4.22%
- DSCR
- 1.19
- GRM
- 8.3
CMA / ARV
- ARV (on-the-fly)
- $79,344
- Comps found
- 1
Show comp detail 1 sale within ~0.75 mi
| Address | Dist | Beds/Ba | Sqft | Sold | Price | $/sf | Match |
|---|---|---|---|---|---|---|---|
| 13903 E Lake Jasper South Ave | 0.00mi | 1/1.0 | 684 (0%) | 1mo | $79,500 | $116 | 99 |
Match score weights: distance 35% · size 25% · config 20% · recency 20%. Top-matched comps best support the ARV.
Projected returns pro-forma
10.0% appreciation · 3.0% rent growth · sell at horizon
- IRR
- 27.3%
- Equity multiple
- 3.17×
- Total profit
- $48,292
- Equity at exit
- $71,620
- IRR
- 23.9%
- Equity multiple
- 7.21×
- Total profit
- $138,318
- Equity at exit
- $154,451
Cash invested: $22,260 (down + closing). Projections, not guarantees.
Landlord ↔ Tenant lean methodology
- Overall (STATE)
- 43 Moderately Tenant-Leaning
- State Illinois
- 43 Moderately Tenant-Leaning · D+7
- County
- — inherits STATE
- City
- — inherits STATE
ZIP-level market 62448
- Home prices YoY
- 13.4%
- Active inventory
- 18
- Price-to-rent
- 8.3×
Monthly cashflow live
- Estimated rent
- $795 medium interval (Pro) →
- Mortgage (P&I)
- −$417
- Tax from tax record
- −$100 /mo · $1,197/yr
- Insurance
- −$33
- HOA
- −$0
- Vacancy / Maint / Mgmt
- −$167
- Net cashflow
- $78
Break-even live
UW: 25.0% down · 7.5% · 30yr · 1.5% tax · 5.0% vac · 8.0% maint · 8.0% mgmt
Financing live
Cash to close
- Down payment
- $19,875
- Closing costs
- $2,385
- Reserves months
- —
- Total cash needed
- —
Loan-product check · same deal, 3 products live
Conventional
25% down · 7.5% · 30yr
- Down + closing
- —
- Monthly P&I
- —
- Monthly cashflow
- —
- DSCR
- —
- Eligible?
- —
Personal DTI + credit; lowest rate.
DSCR
20% down · 8.5% · 30yr
- Down + closing
- —
- Monthly P&I
- —
- Monthly cashflow
- —
- DSCR
- —
- Eligible?
- —
No personal income docs; deal must DSCR.
Hard money
10% down · 12.0% · 12mo
- Down + closing
- —
- Monthly P&I
- —
- Monthly cashflow
- —
- DSCR
- —
- Eligible?
- —
Short-term bridge; refi at stabilization.
Listing history 6 events
-
2026-04-20status Pending
-
2026-04-07historical Active Under Contract
-
2026-03-23$79,500 Active
-
2021-09-15soldstatus $40,000
-
2011-10-03soldstatus $40,000 198-char remark
Show marketing remark (198 chars)
Beautiful view of Lake Jasper, featuring nice deck, outside firepit. 2 car detached garage and storage shed. Home has new flooring and paint. Property sells subject to lake approval and yearly dues.
-
2011-04-07$44,000 198-char remark
Show marketing remark (198 chars)
Beautiful view of Lake Jasper, featuring nice deck, outside firepit. 2 car detached garage and storage shed. Home has new flooring and paint. Property sells subject to lake approval and yearly dues.
ⓘ Source: listings_history table (triggers on properties + properties_extension) + one-shot
backfill from property_details.listing_events for pre-trigger history.
Tax reassessment forecast IL · Partial reset (capped growth)
- Current annual tax
- $1,197 · $100/mo
- Projected year-2 tax
- $1,501 · $125/mo
- Expected delta
- +$304/yr (+$25/mo · 25.4%)
ⓘ Screening estimate from a state-policy table — verify with the county assessor before closing.
Nearby sold comps map
Loading sold comps map…
Walkable amenities ~0.75 mi
Loading nearby amenities…
Taxation est. · year 1
- Rental income
- $9,539
- − Mortgage interest
- −$4,453
- − Property taxes
- −$1,197
- − Insurance
- −$398
- − Repairs & maintenance
- −$763
- − Management
- −$763
- − Depreciation
- −$2,313
- Taxable loss
- −$347
- Est. tax savings @ 24.0%
- +$83
- After-tax cash flow
- $1,022/yr
For passive investors: Depreciation is non-cash, so a rental often shows a tax loss while cash-flowing — sheltering income. Rental losses are passive: they offset passive income freely, and up to $25,000/yr can offset ordinary (W-2) income if you actively participate and your MAGI is under $100k (phasing out to $0 by $150k); unused losses carry forward. On sale, claimed depreciation is recaptured at up to 25%, and gains may owe capital-gains tax (a 1031 exchange can defer both). Figures are a year-1 estimate at your 24.0% rate — not tax advice; consult a CPA.
Schools (NCES district)
- District
- Jasper County CUD 1
- NCES district ID
- 1720380
- Math proficiency
- 29% ▼ -9.00%
- Reading proficiency
- 30% ▼ -8.00%
- Median HH income
- $50,304
- Composite
- 25.82/100
- National rank
- #7358
- State rank
- #253 of 620 in IL
Livability — Newton
- Score
- 63/100
- State rank
- #809
- US rank
- #15982
Category grades
Schools grade is shown separately in the Schools card above.
Census & demographics
- Population (ZIP)
- 5,263
Population outlook (Jasper County) Hauer SSP2
- Today (2025)
- 9,203 people
- By 2030
- 8,927 · -3.0%
- By 2040
- 8,350 · -9.3%
- By 2050
- 7,733 · -16.0%
- By 2075
- 6,335 · -31.2%
- By 2100
- 4,960 · -46.1%
Race, ethnicity, and origin ACS 2023
- Neighborhood character
- Predominantly White (96%)
- Race & ethnicity
- White 96% Two or more races 3% Hispanic / Latino 2%
- Common ancestry
- Iranian 3% Slovak 2% Lithuanian 1%
- Foreign-born
- 1% · Canada
- Languages at home
- 99% English-only · Spanish 1%
Political lean MEDSL · Jasper
- 2024 margin
- Solid R (+65.2) · D 16.8% · R 82.1% · Other 1.1%
- 2008→2024 swing
- -47.7pp toward R · 2008: -17.6pp · 2024: -65.2pp
- All cycles
- 2024: R+65.2 2020: R+62.4 2016: R+59.7 2012: R+41.2 2008: R+17.6
Not yet ingested
- Civics
- —
Market trends
- HPI YoY
- ▲ 23.86%
- Current HPI
- 201.3868
- Rent YoY
- —
- Metro
- —
- State GDP YoY
- ▲ 1.59%
- F500 in state
- 60
Industry mix (Fortune 500 HQ in IL)
| Industry | F500 HQs | Revenue |
|---|---|---|
| Insurance | 4 | $201B |
|
||
| Consumer Goods | 4 | $87B |
|
||
| Industrial Machinery | 3 | $64B |
|
||
| Healthcare | 2 | $55B |
|
||
| Retail / Pharmacy | 1 | $148B |
|
||
| Agriculture / Food | 1 | $86B |
|
||
Price history
+80.7% since first listed6 events — show timeline
- 2026-04-20 Pending — CIBR
- 2026-04-07 Contingent — CIBR
- 2026-03-23 Listed $79,500 CIBR
- 2021-09-15 Sold (Public Records) $40,000 Public Records
- 2011-10-03 Sold (MLS) $40,000 MRED as Distributed by MLS Grid
- 2011-04-07 Listed $44,000 MRED as Distributed by MLS Grid
Property tax history
+5.7%/yrLatest (2024): $1,197 · +5.3% YoY. Source: county tax records.
Cash-flow waterfall
monthlySold comps — $/sqft
last 12 mo · ≤1 miLoading sold comps…