51519 1 Hwy 6 Unit C-43 · Glenwood Springs, CO
Flood risk 1/10 · Minimal
- FEMA flood zone
- X
- Chance of flooding over 30 yrs
- 0.0%
- Est. flood insurance / yr
- $507 – $1,088
Fire risk 5/10 · Moderate
- Est. fire insurance / yr
- $939 – $1,743
Heat risk 3/10 · Minor
- Hot days now (above 85°F)
- 12 days/yr
- Hot days in 30 yrs
- 31 days/yr
Wind risk 1/10 · Minimal
- Chance of severe wind over 30 yrs
- —
Air-quality risk 2/10 · Minimal
- Unhealthy air days now
- 1 days/yr
- Unhealthy air days in 30 yrs
- 1 days/yr
Risk factors via First Street. Map © Google.
Why this score? — see what drove the C+ grade
The composite is a weighted blend of 9 inputs, each scored 0–100. Each bar is that input's sub-score; the figure is the points it added to the 100-point composite (weight × sub-score).
- Cash flow +25.7/30.0
- DSCR +8.6/10.0
- ARV discount +7.5/15.0
- 1% rule +7.2/10.0
- Livability +3.3/5.0
- Schools +3.1/10.0
- Rent growth +2.5/5.0
- Condition / age +2.5/5.0
- Appreciation +0.0/10.0
$305,000
🖨 Deal sheet 📄 Offer letter ✓ Due diligence
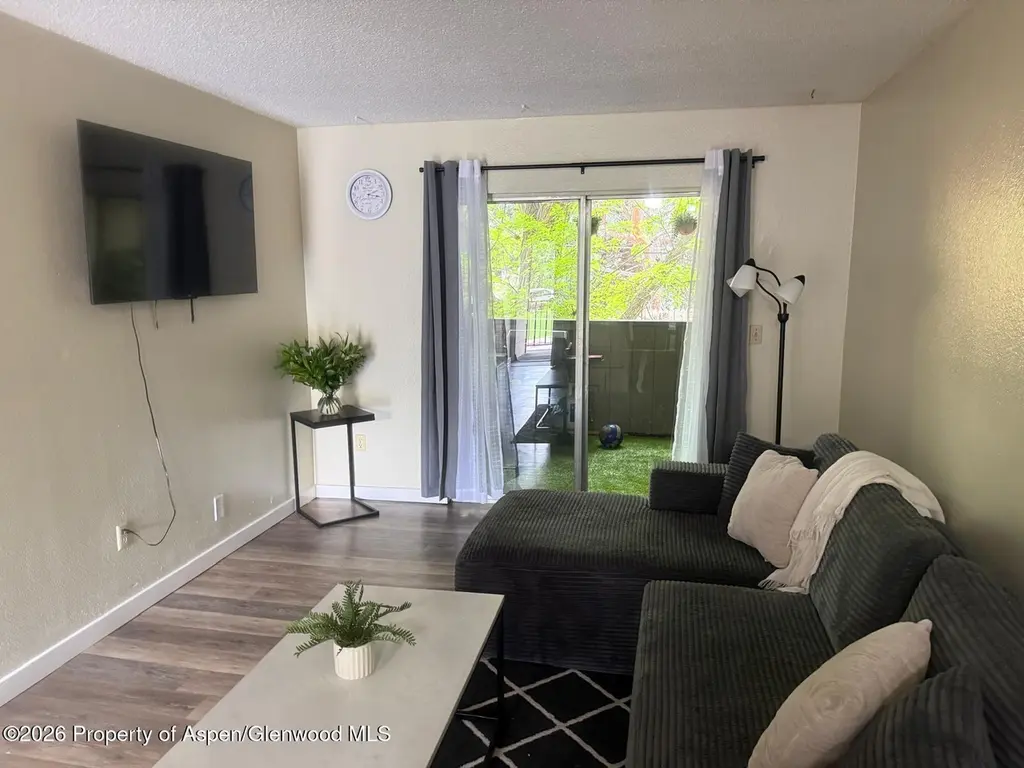
Listing remarks
Move in ready, priced to sell. Spacious 2-bed/1-bath condo in West Glenwood Springs. HOA covers heat, water, sewer, trash and grounds. No deed restrictions. Easy I-70 access, RFTA bus route nearby, close to shopping, dining, and medical. Top floor unit with great private and covered patio.
Key facts
- Easy i-70 access
- Close to dining
- Move in ready
Tags
Property features AI
Finance
- Other: Located in the Valley View Townhouse subdivision; Directions: From Glenwood Springs head west on Highway 6 & 24; property at 51519 Highway 6 & 24
- HOA & community: Association-managed community; Monthly association fee of $350; HOA fee includes unit heat, water, trash, sewer and snow removal
Exterior
- Parking: Assigned parking
- Home design: Condominium
- Exterior features: Membrane roof; Not new construction
Interior
- Kitchen: Oven; Refrigerator; Dishwasher
- Bathrooms: One full bathroom
- Heating & cooling: Baseboard heating; Has heating
- Interior features: Excellent condition
Neighborhood map
What this means for you Summary
Snapshot
- This is a 2-bed/1.0-bath condo listed at $305k.
Deal economics
- At list price, monthly cash flow is $728 ($9k/yr) — positive.
- The deal already cash-flows at list — no discount required.
- Meets the 1% rule at list price ($4k rent vs $305k).
- Recommended offer: $300k (1.5% below list) — sets the bar for market timing.
- Cap rate 9.2% vs local median 1.8% in Glenwood Springs — top-decile yield for the area; either an underpriced asset or a hidden risk that comps aren't pricing in. Stress-test before assuming the spread holds.
Location & tenants
- Location reads 66/100 on livability (#138 in CO) — a middle-class / working-renter tenant base. Strengths: employment A+, commute B+; Watch: amenities D, schools F, crime F.
- Roaring Fork School District No. Re-1 (town): math 28% / reading 39% proficiency, ranked #37 of 86 in CO (top 43%) — families likely to look elsewhere, expect single-tenant / working-renter base with shorter leases.
- Market conditions: 203 active listings in the ZIP; solid renter incomes; 171 units permitted in Garfield County in 2024 (64 in 5+ unit buildings).
- This rent runs 41% of the median local income ($110k/yr) — at the standard rent-burdened threshold; future hikes will face affordability resistance.
Forward outlook
- Local home prices are declining (-3.0%/yr); year-one equity from $2k of loan paydown is wiped out by about $9k of value loss. Plan a longer hold.
- Garfield County population projected at +5% by 2050 — modest demand growth; plan on rents tracking national, not racing it.
Negotiation context
- It's been on market 27 days — a 2% lower offer ($300k) is reasonable based on typical stale-listing flexibility.
- Current owner paid $90k; list at $305k implies a 239% gain — meaningful room to come down on a strong offer.
Risks & watch-outs
- Climate carrying-cost: moderate wildfire risk — expect insurance premiums to compound above CPI over the hold.
Questions for the listing agent
- Built in 1979 — when were the roof, HVAC, electrical panel, plumbing, and water heater last replaced?
- What does the HOA fee cover, when was the last increase, and are there any pending special assessments or reserve-fund shortfalls?
- Any open or pending special assessments — roof, HVAC, plumbing, elevator, façade? What's the per-unit balance and payoff schedule, and is the seller paying it off at close or rolling it to the buyer?
- Is there a deadline driving the sale (1031 exchange, divorce, estate, relocation)? That informs how much negotiation room exists.
- Schools are F-rated, which usually means shorter tenancies and higher turnover. Who's the typical renter profile here, and what's been the actual vacancy rate?
- Crime grade is F in this area — have there been break-ins, vandalism, or insurance claims at this property in the last 3 years? What carrier currently insures it and at what premium?
- What's the average days-on-market for RENTAL listings here right now (not sales)? A rising rental-DOM trend means longer vacancies and softer asking-rent achievability than the comps imply.
- What's the recent tenant-quality profile in this submarket — average credit score on applications, eviction rate, late-payment / NSF rate, and stable-employment percentage? A property-management company in the area should have these aggregated.
- How much new apartment / multifamily construction is in the pipeline within 1–3 miles? Heavy new supply (>2% of stock underway) typically softens rents 12–24 months out; light construction supports rent growth.
Investment metrics
- 1% rule
- 1.22% ✓
- Cap rate
- 9.16%
- Cash-on-cash
- 10.23%
- DSCR
- 1.46
- GRM
- 6.9
CMA / ARV
No comps found within radius.
Projected returns pro-forma
-3.0% appreciation · 3.0% rent growth · sell at horizon
- IRR
- -0.9%
- Equity multiple
- 0.97×
- Total profit
- $-2,926
- Equity at exit
- $45,476
- IRR
- 8.8%
- Equity multiple
- 1.67×
- Total profit
- $57,642
- Equity at exit
- $26,371
Cash invested: $85,400 (down + closing). Projections, not guarantees.
Landlord ↔ Tenant lean methodology
- Overall (STATE)
- 38 Tenant-Leaning
- State Colorado
- 38 Tenant-Leaning · D+4
- County
- — inherits STATE
- City
- — inherits STATE
ZIP-level market 81623
- Active inventory
- 203
- Price-to-rent
- 6.9×
Monthly cashflow live
- Estimated rent
- $3,710 medium interval (Pro) →
- Mortgage (P&I)
- −$1,599
- Tax from tax record
- −$126 /mo · $1,515/yr
- Insurance
- −$127
- HOA
- −$350
- Vacancy / Maint / Mgmt
- −$779
- Net cashflow
- $728
Break-even live
UW: 25.0% down · 7.5% · 30yr · 1.5% tax · 5.0% vac · 8.0% maint · 8.0% mgmt
Financing live
Cash to close
- Down payment
- $76,250
- Closing costs
- $9,150
- Reserves months
- —
- Total cash needed
- —
Loan-product check · same deal, 3 products live
Conventional
25% down · 7.5% · 30yr
- Down + closing
- —
- Monthly P&I
- —
- Monthly cashflow
- —
- DSCR
- —
- Eligible?
- —
Personal DTI + credit; lowest rate.
DSCR
20% down · 8.5% · 30yr
- Down + closing
- —
- Monthly P&I
- —
- Monthly cashflow
- —
- DSCR
- —
- Eligible?
- —
No personal income docs; deal must DSCR.
Hard money
10% down · 12.0% · 12mo
- Down + closing
- —
- Monthly P&I
- —
- Monthly cashflow
- —
- DSCR
- —
- Eligible?
- —
Short-term bridge; refi at stabilization.
HOA detail condo
- Monthly dues
- $350 · $4,200/yr
- Likely covers
- watersewertrashlandscaping
- Assessments
- None detected in remarks — confirm with the listing agent.
Listing history 22 events
-
2026-06-19days on market $305,000 Active 27 DOM
-
2026-06-18days on market $305,000 Active 26 DOM
-
2026-06-17days on market $305,000 Active 25 DOM
-
2026-06-16days on market $305,000 Active 24 DOM
-
2026-06-15days on market $305,000 Active 23 DOM
-
2026-06-14days on market $305,000 Active 21 DOM
-
2026-06-12days on market $305,000 Active 20 DOM
-
2026-06-09days on market $305,000 Active 17 DOM
-
2026-06-08days on market $305,000 Active 16 DOM
-
2026-06-07days on market $305,000 Active 15 DOM
-
2026-06-02days on market $305,000 Active 10 DOM
-
2026-06-01days on market $305,000 Active 9 DOM
-
2026-05-31days on market $305,000 Active 8 DOM
-
2026-05-30days on market $305,000 Active 7 DOM
-
2026-05-23$305,000 Active
-
2016-07-15soldstatus $90,000
-
2013-12-31soldstatus $87,000
-
2001-12-28soldstatus $86,000
-
1995-11-22soldstatus $72,500
-
1995-06-26soldstatus $63,000
-
1995-03-16soldstatus $53,000
-
1987-08-07soldstatus $18,000
ⓘ Source: listings_history table (triggers on properties + properties_extension) + one-shot
backfill from property_details.listing_events for pre-trigger history.
Tax reassessment forecast CO · Resets to sale price
- Current annual tax
- $1,515 · $126/mo
- Projected year-2 tax
- $1,678 · $140/mo
- Expected delta
- +$162/yr (+$14/mo · 10.7%)
ⓘ Screening estimate from a state-policy table — verify with the county assessor before closing.
Climate risk First Street
- Flood 1/10 Low FEMA zone X · 0% chance over 30 yrs
- Wildfire 5/10 Major
- Heat 3/10 Moderate 12 d/yr ≥85°F today · 31 d/yr by 30 yrs out
- Wind 1/10 Low
- Air quality 2/10 Low 1 unhealthy d/yr today · 1 by 30 yrs out
Nearby sold comps map
Loading sold comps map…
Walkable amenities ~0.75 mi
Loading nearby amenities…
Taxation est. · year 1
- Rental income
- $44,522
- − Mortgage interest
- −$17,085
- − Property taxes
- −$1,515
- − Insurance
- −$1,525
- − Repairs & maintenance
- −$3,562
- − Management
- −$3,562
- − HOA
- −$4,200
- − Depreciation
- −$8,873
- Taxable income
- $4,201
- Est. tax owed @ 24.0%
- −$1,008
- After-tax cash flow
- $7,731/yr
For passive investors: Depreciation is non-cash, so a rental often shows a tax loss while cash-flowing — sheltering income. Rental losses are passive: they offset passive income freely, and up to $25,000/yr can offset ordinary (W-2) income if you actively participate and your MAGI is under $100k (phasing out to $0 by $150k); unused losses carry forward. On sale, claimed depreciation is recaptured at up to 25%, and gains may owe capital-gains tax (a 1031 exchange can defer both). Figures are a year-1 estimate at your 24.0% rate — not tax advice; consult a CPA.
Schools (NCES district)
- District
- Roaring Fork School District No. Re-1
- NCES district ID
- 0804260
- Math proficiency
- 28% ▼ -3.00%
- Reading proficiency
- 39% ▼ -2.00%
- Median HH income
- $67,893
- Composite
- 30.78/100
- National rank
- #6150
- State rank
- #37 of 86 in CO
Livability — Glenwood Springs
- Score
- 66/100
- State rank
- #138
- US rank
- #11529
Category grades
Schools grade is shown separately in the Schools card above.
Census & demographics
- Census place
- Glenwood Springs, CO
- County
- Garfield County · 31,911 people
- City population
- 16,844
- Metro
- Glenwood Springs, CO
- Population (ZIP)
- 15,067
- Household income
- $109,661
- Rent vs Own
- Severe rent burden
- 391.0
Population outlook (Garfield County) Hauer SSP2
- Today (2025)
- 61,756 people
- By 2030
- 63,255 · +2.4%
- By 2040
- 64,952 · +5.2%
- By 2050
- 64,937 · +5.2%
- By 2075
- 62,413 · +1.1%
- By 2100
- 55,730 · -9.8%
Race, ethnicity, and origin ACS 2023
- Neighborhood character
- Predominantly White (67%)
- Race & ethnicity
- White 67% Hispanic / Latino 28% Two or more races 7%
- Hispanic origin (detail)
- Mexican 18%
- Common ancestry
- Portuguese 4% Slovak 4% Romanian 3%
- Foreign-born
- 16% · Canada, Dominican Republic, China
- Languages at home
- 73% English-only · Spanish 23% German/W. Germanic 2% Other Indo-European 1%
Political lean MEDSL · Garfield
- 2024 margin
- Toss-up / Even · D 49.8% · R 47.7% · Other 2.5%
- 2008→2024 swing
- +2.1pp toward D · 2008: -0.0pp · 2024: 2.1pp
- All cycles
- 2024: D+2.1 2020: D+2.3 2016: R+7.1 2012: R+4.9 2008: R+0.0
Not yet ingested
- Civics
- —
Market trends
- HPI YoY
- ▼ -606.12%
- Current HPI
- 526.3564
- Rent YoY
- —
- Metro
- Glenwood Springs, CO
- State GDP YoY
- ▲ 1.95%
- F500 in state
- 14
Industry mix (Fortune 500 HQ in CO)
| Industry | F500 HQs | Revenue |
|---|---|---|
| Technology Distribution | 1 | $31B |
|
||
| Food / Agriculture | 1 | $18B |
|
||
| Packaging | 1 | $14B |
|
||
| Healthcare | 1 | $13B |
|
||
| Energy | 1 | $10B |
|
||
| Technology | 1 | $4B |
|
||
Price history
+1594.4% since first listed8 events — show timeline
- 2026-05-23 Listed $305,000 AGMLS
- 2016-07-15 Sold (Public Records) $90,000 Public Records
- 2013-12-31 Sold (Public Records) $87,000 Public Records
- 2001-12-28 Sold (Public Records) $86,000 Public Records
- 1995-11-22 Sold (Public Records) $72,500 Public Records
- 1995-06-26 Sold (Public Records) $63,000 Public Records
- 1995-03-16 Sold (Public Records) $53,000 Public Records
- 1987-08-07 Sold (Public Records) $18,000 Public Records
Property tax history
+12.5%/yrLatest (2025): $1,515 · +46.5% YoY. Source: county tax records.
Cash-flow waterfall
monthlySold comps — $/sqft
last 12 mo · ≤1 miLoading sold comps…