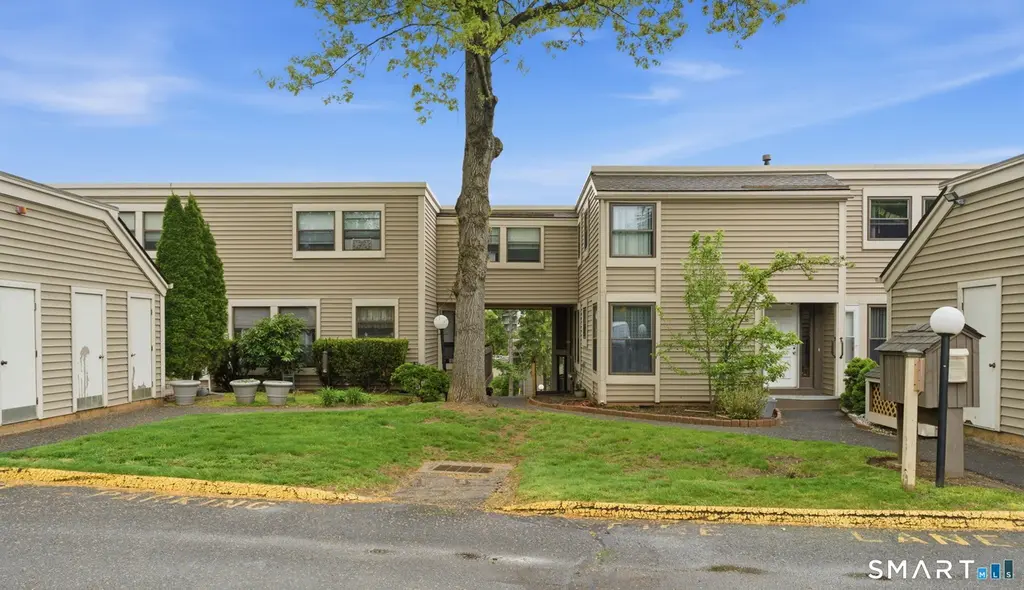
6 Stevens Pl #6 · Newington, CT
Flood risk 4/10 · Minor
- FEMA flood zone
- X (unshaded)
- Chance of flooding over 30 yrs
- 0.24%
- Est. flood insurance / yr
- $507 – $1,088
Fire risk 1/10 · Minimal
- Est. fire insurance / yr
- $829 – $1,539
Heat risk 5/10 · Moderate
- Hot days now (above 98°F)
- 7 days/yr
- Hot days in 30 yrs
- 15 days/yr
Wind risk 6/10 · Moderate
- Chance of severe wind over 30 yrs
- 27.0%
Air-quality risk 3/10 · Minor
- Unhealthy air days now
- 2 days/yr
- Unhealthy air days in 30 yrs
- 3 days/yr
Risk factors via First Street. Map © Google.
Why this score? — see what drove the D grade
The composite is a weighted blend of 9 inputs, each scored 0–100. Each bar is that input's sub-score; the figure is the points it added to the 100-point composite (weight × sub-score).
- Cash flow +11.5/30.0
- ARV discount +7.5/15.0
- 1% rule +6.5/10.0
- Schools +5.6/10.0
- Livability +4.0/5.0
- DSCR +3.4/10.0
- Rent growth +3.4/5.0
- Condition / age +1.0/5.0
- Appreciation +0.0/10.0
$184,900
🖨 Deal sheet 📄 Offer letter ✓ Due diligence
Listing remarks
MULTIPLE OFFERS RECEIVED- PLEASE SUBMIT HIGHEST AND BEST BY 5/19Townhome offering 2 bedrooms, 2 full baths, and 1 half bath with a functional layout that includes a fireplaced living room, second-floor laundry, exterior deck, and partially finished lower level. Additional features include covered carport parking for one vehicle and access to the association pool. Set within a desirable community known for its pleasant walking areas and convenient setting. Property requires extensive renovation and is being sold in as-is condition. Aggressively priced to reflect the substantial updates and repairs needed, presenting a significant opportunity for the right buyer to build equity. Seller makes
Key facts
- Association pool
- Exterior deck
- $461 HOA
Tags
Property features AI
Finance
- Other: Nearby amenities: golf course and playground/tot lot
- HOA & community: Homeowners association with monthly fee; HOA fee covers grounds maintenance, snow removal, property management, and pool service; Association amenities include pool; Pets allowed per HOA; Professional off-site property management; 108-unit community
Exterior
- Parking: One garage (carport/unassigned parking noted); Two total parking spaces
- Utilities: Public water connected; Public sewer connected; Hot water: other
- Home design: Condominium; End unit; Part of Cold Spring Village complex; Tan exterior color
- Construction: Frame construction
- Exterior features: Vinyl siding; Deck; In-ground gunite swimming pool
Interior
- Kitchen: Oven/Range; Refrigerator; Dishwasher
- Bedrooms: Two bedrooms
- Bathrooms: Two full bathrooms; One half bathroom
- Heating & cooling: Hot water heating; Natural gas fuel
- Interior features: Four total rooms; Three levels in unit; One fireplace; Full, partially finished basement; Attic accessible via hatch
- Laundry & utility: Laundry on upper level
Neighborhood map
What this means for you Summary
Snapshot
- This is a 2-bed/2.5-bath condo listed at $185k. Condition is rated poor.
Deal economics
- At list price, monthly cash flow is $-62 ($-746/yr) — negative.
- To cash-flow at today's rent, offer at most $176k (4.9% below list).
- Meets the 1% rule at list price ($2k rent vs $185k).
- Recommended offer: $176k (4.9% below list) — sets the bar for cash-flow.
- Cap rate 5.9% vs local median 4.4% in Newington — top-decile yield for the area; either an underpriced asset or a hidden risk that comps aren't pricing in. Stress-test before assuming the spread holds.
Location & tenants
- Location reads 79/100 on livability (#30 in CT, #2,143 nationally) — a middle-class / working-renter tenant base. Strengths: employment A+, housing A+, health & safety A+; Watch: amenities F, commute F.
- Rocky Hill School District (suburban): math 59% / reading 67% proficiency, ranked #34 of 153 in CT (top 22%) — acceptable for families but not a draw, mixed tenant base, ~2y average lease; only 10% free/reduced lunch — higher-income household profile.
- Zoned schools: West Hill School (math 82% / reading 72%, grade A, #28 of 553 statewide, top 7%, 399 students, 13% FRL); Rocky Hill High School (math 57% / reading 77%, grade B, #26 of 194 statewide, top 16%, 722 students, 21% FRL).
- Market conditions: Rents rising (+3.4%/yr); 54 active listings in the ZIP; 3 comparable units currently listed for rent nearby; rentals leasing fast (median 2d on market — plan ~1-2 weeks tenant-placement turnaround); solid renter incomes; 1,867 units permitted in Capitol Planning Region in 2024 (1,399 in 5+ unit buildings).
Forward outlook
- Local home prices are declining (-3.0%/yr); year-one equity from $1k of loan paydown is wiped out by about $6k of value loss. Plan a longer hold.
Negotiation context
- Only 5 days on market — expect competitive offers; lowballing is unlikely to land.
Risks & watch-outs
- Watch-outs: HOA is 22% of rent.
- Climate carrying-cost: major wind risk, 27% chance of damaging wind over 30y; extreme-heat days projected 7→15/yr by 2055 (HVAC capex compounding) — expect insurance premiums to compound above CPI over the hold.
Questions for the listing agent
- What do current leases actually rent for vs. the listed asking? Can we see a recent rent roll and the last 12 months of T-12 income?
- Have any recent inspections been done? Can we get a copy of the seller's disclosures and any deferred-maintenance estimates?
- Built in 1974 — when were the roof, HVAC, electrical panel, plumbing, and water heater last replaced?
- What does the HOA fee cover, when was the last increase, and are there any pending special assessments or reserve-fund shortfalls?
- Any open or pending special assessments — roof, HVAC, plumbing, elevator, façade? What's the per-unit balance and payoff schedule, and is the seller paying it off at close or rolling it to the buyer?
- Is there a deadline driving the sale (1031 exchange, divorce, estate, relocation)? That informs how much negotiation room exists.
- The area grade is low — what's the realistic commute time and amenity access for the typical tenant pool here? Any planned neighborhood developments (good or bad) we should know about?
- What's the average days-on-market for RENTAL listings here right now (not sales)? A rising rental-DOM trend means longer vacancies and softer asking-rent achievability than the comps imply.
- What's the recent tenant-quality profile in this submarket — average credit score on applications, eviction rate, late-payment / NSF rate, and stable-employment percentage? A property-management company in the area should have these aggregated.
- How much new apartment / multifamily construction is in the pipeline within 1–3 miles? Heavy new supply (>2% of stock underway) typically softens rents 12–24 months out; light construction supports rent growth.
Investment metrics
- 1% rule
- 1.15% ✓
- Cap rate
- 5.89%
- Cash-on-cash
- -1.44%
- DSCR
- 0.94
- GRM
- 7.3
CMA / ARV
No comps found within radius.
Projected returns pro-forma
-3.0% appreciation · 3.43% rent growth · sell at horizon
- IRR
- -17.8%
- Equity multiple
- 0.37×
- Total profit
- $-32,684
- Equity at exit
- $27,569
- IRR
- -8.5%
- Equity multiple
- 0.45×
- Total profit
- $-28,461
- Equity at exit
- $15,987
Cash invested: $51,772 (down + closing). Projections, not guarantees.
Landlord ↔ Tenant lean methodology
- Overall (STATE)
- 27 Tenant-Leaning
- State Connecticut
- 27 Tenant-Leaning · D+7
- County
- — inherits STATE
- City
- — inherits STATE
ZIP-level market 06067
- Rents YoY
- 3.4%
- Active inventory
- 54
- Price-to-rent
- 7.3×
Monthly cashflow live
- Estimated rent
- $2,122 medium interval (Pro) →
- Mortgage (P&I)
- −$970
- Tax est. 1.5%
- −$231 /mo · $2,774/yr
- Insurance
- −$77
- HOA
- −$461
- Vacancy / Maint / Mgmt
- −$446
- Net cashflow
- $-62
Break-even live
UW: 25.0% down · 7.5% · 30yr · 1.5% tax · 5.0% vac · 8.0% maint · 8.0% mgmt
Financing live
Cash to close
- Down payment
- $46,225
- Closing costs
- $5,547
- Reserves months
- —
- Total cash needed
- —
Loan-product check · same deal, 3 products live
Conventional
25% down · 7.5% · 30yr
- Down + closing
- —
- Monthly P&I
- —
- Monthly cashflow
- —
- DSCR
- —
- Eligible?
- —
Personal DTI + credit; lowest rate.
DSCR
20% down · 8.5% · 30yr
- Down + closing
- —
- Monthly P&I
- —
- Monthly cashflow
- —
- DSCR
- —
- Eligible?
- —
No personal income docs; deal must DSCR.
Hard money
10% down · 12.0% · 12mo
- Down + closing
- —
- Monthly P&I
- —
- Monthly cashflow
- —
- DSCR
- —
- Eligible?
- —
Short-term bridge; refi at stabilization.
Rent comps 3 comps
| Address | Beds | Baths | Sqft | Rent | $/sqft | DOM | Units | Dist |
|---|---|---|---|---|---|---|---|---|
| 98 Cold Spring Rd Rocky Hill, CT | 1.0–2.0 | 1.0–2.0 | 1032 | $1,949 | $1.89 | 1d | 27 | 0.25mi |
| 17 Sagamore Ln Rocky Hill, CT | 1.0–2.0 | 1.0–2.0 | 971 | $2,940 | $3.03 | 1d | 9 | 1.02mi |
| 11 Kensington Ln Rocky Hill, CT | 1.0–2.0 | 1.0–2.0 | 958 | $2,825 | $2.95 | 1d | 1 | 1.05mi |
HOA detail condo
- Monthly dues
- $461 · $5,532/yr
- Likely covers
- pool
- Assessments
- None detected in remarks — confirm with the listing agent.
Listing history 1 events
-
2026-05-15$184,900 Active 830-char remark
ⓘ Source: listings_history table (triggers on properties + properties_extension) + one-shot
backfill from property_details.listing_events for pre-trigger history.
Climate risk First Street
- Flood 4/10 Moderate FEMA zone X (unshaded) · 24% chance over 30 yrs
- Wildfire 1/10 Low
- Heat 5/10 Major 7 d/yr ≥98°F today · 15 d/yr by 30 yrs out
- Wind 6/10 Major 27% chance of damaging wind over 30 yrs
- Air quality 3/10 Moderate 2 unhealthy d/yr today · 3 by 30 yrs out
Nearby sold comps map
Loading sold comps map…
Walkable amenities ~0.75 mi
Loading nearby amenities…
Taxation est. · year 1
- Rental income
- $25,468
- − Mortgage interest
- −$10,357
- − Property taxes
- −$2,774
- − Insurance
- −$924
- − Repairs & maintenance
- −$2,037
- − Management
- −$2,037
- − HOA
- −$5,532
- − Depreciation
- −$5,379
- Taxable loss
- −$3,573
- Est. tax savings @ 24.0%
- +$858
- After-tax cash flow
- $112/yr
For passive investors: Depreciation is non-cash, so a rental often shows a tax loss while cash-flowing — sheltering income. Rental losses are passive: they offset passive income freely, and up to $25,000/yr can offset ordinary (W-2) income if you actively participate and your MAGI is under $100k (phasing out to $0 by $150k); unused losses carry forward. On sale, claimed depreciation is recaptured at up to 25%, and gains may owe capital-gains tax (a 1031 exchange can defer both). Figures are a year-1 estimate at your 24.0% rate — not tax advice; consult a CPA.
Condition & rehab AI · 30 photos
This townhouse requires extensive renovation and is in poor condition. Significant updates are needed to increase its value for resale and rental.
Repairs flagged
- Major kitchen cabinets — dated and in poor condition
- Major bathroom cabinets — dated and in poor condition
- Major exterior siding — weathered and in poor condition
- Major deck — damaged and in poor condition
- Major flooring — damaged and uneven
Value-add opportunities
- Both kitchen renovation — modernizing the kitchen would increase both resale and rental value
- Both bathroom renovation — modernizing the bathrooms would increase both resale and rental value
- Both exterior siding and deck repair — repairing the siding and deck would improve curb appeal and increase both resale and rental value
- Both flooring replacement — replacing the flooring would improve the overall appearance and increase both resale and rental value
Renovation cost estimate screening
| Repair item | Severity | Est. cost |
|---|---|---|
| kitchen cabinets · dated and in poor condition | Major | $15,000–50,000 |
| bathroom cabinets · dated and in poor condition | Major | $15,000–50,000 |
| exterior siding · weathered and in poor condition | Major | $15,000–50,000 |
| deck · damaged and in poor condition | Major | $15,000–50,000 |
| flooring · damaged and uneven | Major | $15,000–50,000 |
| Total estimated repair cost · 5 items | $75,000–250,000 |
Value-add ROI direction
- Both kitchen renovation — modernizing the kitchen would increase both resale and rental value ↑
- Both bathroom renovation — modernizing the bathrooms would increase both resale and rental value ↑
- Both exterior siding and deck repair — repairing the siding and deck would improve curb appeal and increase both resale and rental value ↑
- Both flooring replacement — replacing the flooring would improve the overall appearance and increase both resale and rental value ↑
ⓘ Cost ranges are severity-bucket heuristics (US national rule-of-thumb). Get contractor quotes + a written scope before underwriting a rehab budget.
Schools (NCES district)
- District
- Rocky Hill School District
- NCES district ID
- 0903840
- Math proficiency
- 59% ▼ -7.00%
- Reading proficiency
- 67% ▼ -8.00%
- Median HH income
- $75,825
- Composite
- 56.01/100
- National rank
- #1191
- State rank
- #34 of 153 in CT
Livability — Newington
- Score
- 79/100
- State rank
- #30
- US rank
- #2143
Category grades
Schools grade is shown separately in the Schools card above.
Census & demographics
- County
- Hartford County · 754,208 people
- City population
- 30,896
- Metro
- Hartford-East Hartford-Middletown, CT
- Population (ZIP)
- 20,872
- Household income
- $100,027
- Rent vs Own
- Severe rent burden
- 560.0
Population outlook (Capitol County) Hauer SSP2
- By 2040
- 1,063,519
Race, ethnicity, and origin ACS 2023
- Neighborhood character
- Predominantly White (69%)
- Race & ethnicity
- White 69% Asian 14% Hispanic / Latino 8% Two or more races 7% Black 5%
- Hispanic origin (detail)
- Puerto Rican 5%
- Common ancestry
- Romanian 9% Lithuanian 4% Russian 3%
- Foreign-born
- 23% · Canada, China, Jamaica
- Languages at home
- 69% English-only · Other Indo-European 11% Spanish 7% Russian/Polish/Slavic 6%
Political lean MEDSL · Capitol
- 2024 margin
- Strong D (+21.9) · D 60.1% · R 38.2% · Other 1.7%
- All cycles
- 2024: D+21.9
Not yet ingested
- Civics
- —
Market trends
- HPI YoY
- ▼ -188.36%
- Current HPI
- 184.2022
- Rent YoY
- ▲ 3.43%
- Metro
- Hartford-East Hartford-Middletown, CT
- State GDP YoY
- ▲ 1.06%
- F500 in state
- 38
Industry mix (Fortune 500 HQ in CT)
| Industry | F500 HQs | Revenue |
|---|---|---|
| Industrial Machinery | 4 | $38B |
|
||
| Insurance | 3 | $71B |
|
||
| Financial Services | 2 | $25B |
|
||
| Transportation / Logistics | 2 | $18B |
|
||
| Healthcare | 1 | $247B |
|
||
| Telecommunications | 1 | $55B |
|
||
Price history
+22.3% since first listed3 events — show timeline
- 2026-06-15 Sold (MLS) $226,130 Smart MLS
- 2026-05-20 Pending — Smart MLS
- 2026-05-15 Listed $184,900 Smart MLS
Cash-flow waterfall
monthlySold comps — $/sqft
last 12 mo · ≤1 miLoading sold comps…